Abstract
To achieve high mixing efficiency in microfluidic devices, complex designs are often required. Microfluidic devices have been evaluated with light and confocal microscopy, but fluid-flow characteristics at different depths are difficult to separate from the en face images produced. By using optical coherence tomography (OCT), an imaging modality capable of imaging 3D microstructures at micrometer-scale resolutions over millimeter-size scales, we obtained 3D dynamic functional and structural data for three representative microfluidic mixers: a Y channel mixer, a 3D serpentine mixer, and a vortex mixer. In the serpentine mixer, OCT image analysis revealed that the mixing efficiency was linearly dependent on the Reynolds number, whereas it appeared to have exponential dependence when imaged with light microscopy. The visual overlap of fluid flows in light-microscopy images leads to an overestimation of the mixing efficiency, an effect that was eliminated with OCT imaging. Doppler OCT measurements determined velocity profiles at various points in the serpentine mixer. Mixing patterns in the vortex mixer were compared with light-microscopy and OCT image analysis. These results demonstrate that OCT can significantly improve the characterization of 3D microfluidic device structure and function.
Microfluidic devices have attracted a great deal of attention during the past several years because of their applications in biology and biotechnology (1-3). These devices offer several advantages over macroscale laboratory operations, e.g., small reaction volume, automation, and integration. The small scale of these systems, however, precludes the use of turbulent flow for fast mixing in these systems. Still, complete and thorough mixing is necessary for many biochemical reactions. Devices that enhance mixing at the microscale include active mixers and passive mixers based on chaotic advection (4-7).
Light microscopy and confocal microscopy have been commonly used to analyze mixing efficiency in these microfluidic mixers (4, 5, 7-10). However, light-microscopic imaging methods produce only en face images that optically superimpose the flows at various depths. Because the visual superposition of fluids can make separated fluids appear to be mixed, it has been suggested that these imaging methods may overestimate the mixing efficiency. Confocal microscopy can produce high-resolution images of cross-sectional structure, but imaging depths are limited to a few hundred micrometers. Although individual channels of most microfluidic devices are around this size, it is desirable to obtain overall structural images of entire microfluidic devices over millimeter-length scales. When confocal microscopy is used for mixing analysis, exogenous fluorescent dyes are typically needed to obtain signals. In addition, images acquired with light and confocal microscopy do not fully provide functional information of flow inside microchannels such as spatially resolved cross-sectional flow direction and velocity. Particle image velocimetry has been used on the microscale for imaging flow in microfluidic devices (11, 12). However, this technique typically relies on high-numerical-aperture objectives, which can present the same limitations as confocal microscopy.
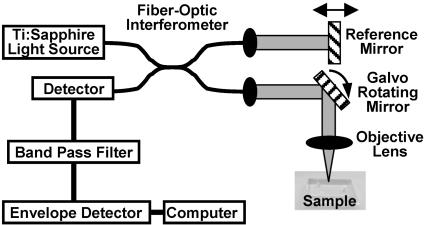
Optical coherence tomography (OCT) is an emerging high-resolution medical and biological imaging technology (13-15) that can perform optical ranging of biological and nonbiological structures in a manner similar to ultrasound (Fig. 1). Because OCT uses the shorter wavelength of near-infrared light rather than sound, imaging resolution can be 10-100 times higher. Near-infrared wavelengths are used in OCT imaging to increase imaging penetration through highly scattering structures. It is possible to image depths of several centimeters through transparent structures and of a few millimeters in highly scattering media or tissue. OCT is ideally suited to image microfluidic devices, which are routinely constructed from optically transparent polymers at scales between 10 and 1,000 μm. OCT is not only capable of imaging 3D microstructures at micrometer-scale resolutions but can also obtain velocity profiles at real-time acquisition rates in small lumens and vessels (16-20) in a manner analogous to laser-Doppler velocimetry or Doppler ultrasound. Here we report the use of OCT to image 3D microstructures, mixing patterns, and flow profiles inside complex channels of three commonly used passive microfluidic mixers. More accurate mixing efficiency measurements in microfluidic channel were obtained by using OCT.
Fig. 1.
Schematic diagram of the OCT imaging system. Light from a low-coherence light source is split into two identical beams in a fiber-optic inter-ferometer and transmitted to a reference mirror and a sample. By measuring the interference between light backscattered from the sample and from the reference mirror, the distance and magnitude of optical scattering within the sample can be measured within micrometers. Scanning the light beam across the sample and recording the magnitude of the interference produces a complete cross-sectional image.
Materials and Methods
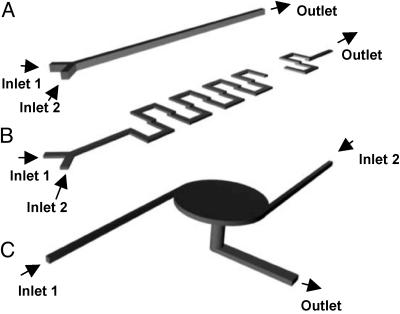
Microfluidic Devices. Polydimethyl siloxane (PDMS) microfluidic devices were fabricated by using micromolding and replica-molding techniques as described (21, ¶). We studied three representative types of microfluidic mixers: a Y channel mixer with a straight channel, a 3D serpentine mixer, and a vortex mixer. Fig. 2 shows schematics of these designs. These mixers are modified designs of devices previously reported in the literature (4, 21). The Y channel mixer represents a typical design with slow diffusion-based mixing at the interface of two liquids under adjacent laminar flow. The 3D serpentine mixer consists of two PDMS layers with open connections between layers to force fluid into a helical flow pattern and improve mixing efficiency. The vortex mixer consists of two layers of PDMS. The top layer consists of a larger circular mixing chamber with multiple input channels, and the bottom layer contains a vertically oriented output channel. The vortex chamber is capable of supporting a larger range of input fluid-flow velocities for mixing.
Fig. 2.
Schematic 3D diagrams of the three representative types of microfluidic mixers investigated in this study: Y channel mixer (A), 3D serpentine mixer (B), and vortex mixer (C). The main channel of the Y-shaped mixer is 100 μm in width and 100 μm in depth. For the 3D serpentine mixer, channels on both layers are 300 μm in width and 100 μm in depth. For the vortex mixer, the central mixing chamber is 2 mm in diameter and 100 μm in depth, with inlets that are 100 μm in width and 100 μm in depth. The images are not to scale.
Mixing Experiments with Light Microscopy. Mixing experiments were carried out in the 3D serpentine mixer and vortex mixer by simultaneously flowing two aqueous fluids differentiated with red and blue food dyes (red nos. 40 and 30 and blue no. 1, Durkee, San Francisco). Light-microscopy images were acquired by using a digital color video camera (Sony ExwaveHAD SSC-DC54A, Sony, Tokyo) controlled by image-acquisition software (studio 8, Pinnacle Systems, Mountain View, CA) installed on a light microscope (VWR VistaVision Inverted Microscope, VWR Scientific). Relative mixing efficiency in the serpentine mixer was characterized by using a previously described method (5). Sample injections into the microfluidic mixer were controlled by using a syringe pump (WPI 200i, WPI Instruments, Aston, U.K.). Image processing was performed with photoshop 7.0 (Adobe Systems, San Jose, CA) for color filtering and imagej (nih image, http://rsb.info.nih.gov/ij/index.html) for pixel-intensity measurement.
Mixing Experiments and Flow-Rate Experiments with OCT. Mixing experiments were carried out in the 3D serpentine mixer and vortex mixer by simultaneously flowing two aqueous fluids of different concentrations of skim milk diluted with water. Injections into the microfluidic mixers were controlled by using a syringe pump (WPI 200i, WPI Instruments). The OCT system consisted of galvanometer-scanned mirrors for the delay mechanism and the transverse scanning. The optical source was a mode-locked titanium-sapphire laser centered at 800 nm with output broadened by propagation through ultrahigh-numerical-aperture fiber (22) to ≈100-nm bandwidth (2.8-μm axial resolution). The light (with 10 mW of optical power) was directed at a 15° angle and focused into the microfluidic mixers by a 40-mm-focal-length achromatic lens, which achieved a depth of field of ≈1 mm and a transverse resolution of 15 μm. Image-acquisition rates were 15-30 sec depending on the image size and could be considerably faster (4-32 frames per second) when using more sophisticated delay-line scanning mechanisms (23, 24). Each recorded image had 120 axial scans. 3D volumetric images were reconstructed from a series of 64 cross-sectional images by using slicer dicer software (PIXOTEC, Renton, WA) and other cross-sectional images along y and z axes were also obtained with the same software. The scattering intensity of the OCT images was averaged over 5 × 5-pixel areas to minimize the effect of speckle. The mixing efficiency in the serpentine mixer was inferred from the scattering intensity produced by the concentration of the two milk fluids at various points in the channel. The efficiency was calculated by using the following formula from the averaged scattering intensities of the OCT image at each pixel:
 |
 |
 |
A ratio of 0.5 indicated that an equal amount of each liquid was present at that point, and therefore complete mixing was achieved because equal volumes of both liquids were injected into the channel initially. Deviation from 0.5 indicated that a higher density of one of the component liquids was present at that point. All intensity measurements were taken from images acquired along the x axis of the channel sections. To apply this expression, we assumed that each individual fluid maintained the initial concentration if mixing did not occur, and that measured backscatter was linearly related to the concentration of the scattering species within the coherent detection volume. Our analysis with skim milk fulfilled these two assumptions. Relative mixing efficiency was calculated by comparing the ratio of pixels with mixing efficiency raging from 0.4 to 0.6 from each measurement at different flow rates with the ratio of pixels with mixing efficiency raging from 0.4 to 0.6 from measurements when the two liquids were mixed completely.
Velocity information was calculated from axial scans acquired by the aforementioned OCT system. The complex analytic signal of the sampled axial scan was computed by using a fast-Fourier-transform-implemented Hilbert transform (25) and by using the differences in the complex phase of adjacent samples, which are proportional to the radial component of the speed of the flow. The phase was averaged over adjacent samples to increase the signal-to-noise ratio of the resulting velocity profile. Acquired and processed data were assembled to generate cross-sectional Doppler OCT images of fluid flow within the microfluidic channels.
As stated in the Introduction, light microscopy and confocal microscopy have several limitations for the analysis of microfluidic devices that are overcome by the use of OCT. Light-microscopy images frequently show the superimposition of two or more distinct fluids. OCT, in contrast, is capable of measuring the optical scattering intensity of a fluid at particular depths in the microfluidic channel by coherently gating the returned signal from a particular depth. Therefore, OCT images allow the spatial localization of unmixed and mixed liquids and the 3D spatial quantification of mixing efficiency. As a result, we show that lightmicroscopy image analysis overestimates the mixing efficiency and OCT image analysis provides more precise and thorough characterization of the mixing efficiency. The penetration depth of confocal microscopy is limited to the working distance of the objective, usually on the order of a few hundred micrometers. In addition, it is more sensitive to stray scattering, because it does not use a coherence gate to remove multiply scattered light. OCT can use low-numerical-aperture objectives and therefore can probe deep within microfluidic structures. The use of interferometry in OCT allows measurements similar to laser-Doppler velocimetry or Doppler ultrasound such that OCT can obtain both structural and functional information of microfluidic devices with a single hardware configuration and detect velocities ranging from 10 μm/sec (26) to 200 mm/sec (27). OCT can noninvasively detect the endogenous scattering properties of different fluids and agents, including proteins, bacterial cells, and constituents in human blood. OCT imaging therefore is less likely to affect the mixing dynamics and reaction kinetics. For these reasons, we believe OCT can provide insight into microfluidic mixing reactors unavailable from other instruments.
Results
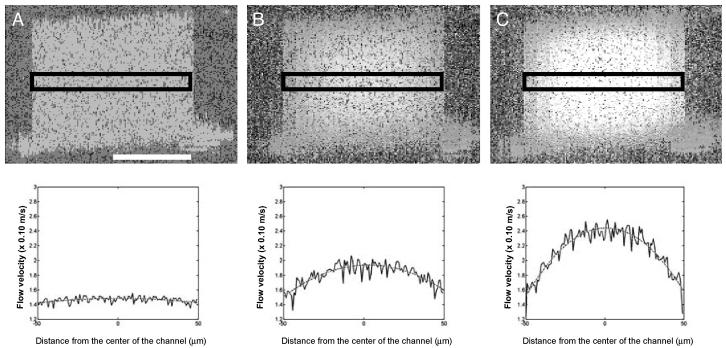
Flow Profile Analysis in the Straight Channel by Using OCT. Complete diffusion-based mixing was observed by using both light-microscopy and OCT image analysis in the output channel in 1 min after stopping the flow (data not shown). The 3D flow profile of the straight channel, as determined by Doppler OCT, is shown in Fig. 3. The image contains 2D spatial information, and the pixel intensity represents a third dimension of flow-velocity information. The measured profile is consistent with standard models of laminar fluid flow in a narrow channel, indicating that the highest flow velocity is in the center of the channel, whereas it is almost zero close to the wall of the channel.
Fig. 3.
Doppler OCT images (Upper) and plots (Lower) showing the 3D and 2D flow profiles, respectively, across the straight channel in a Y channel mixer at flow rates of 0 m/sec (A), 3.3 × 10⁻² m/sec (B), and 6.6 × 10⁻² m/sec (C). The 3D images represent two spatial dimensions with pixel intensity proportional to fluid-flow velocity. The rectangle in each image indicates the area from which flow-velocity information was extracted. The phase was averaged over adjacent samples to increase the signal-to-noise ratio of the resulting velocity profile. The solid lines in the plots indicate the experimental flow-velocity profile, and the dotted lines indicate the theoretical flow-velocity profiles. The baseline for static flow is at 1.4 × 10⁻¹ m/sec. [Scale bar, 50 μm (applies to all images).]
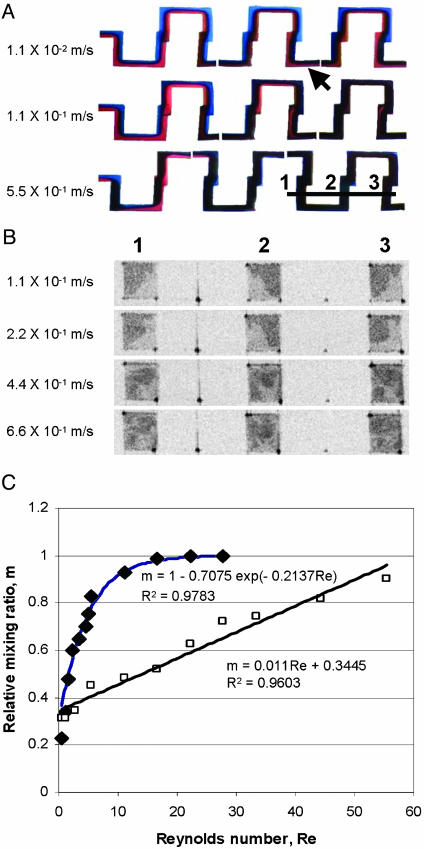
Mixing Dynamics in the Serpentine Mixer by Using Light Microscopy and OCT. The mixing efficiency of the 3D serpentine mixer was first characterized by monitoring the mixing of two fluid streams (distinguished with red and blue dyes) using light microscopy as a function of varying Reynolds number (Re) ≈0.55-27.5 (Fig. 4 A and C). These results are in good agreement with observations described in previous studies (4, 5). Confocal-microscopy analysis has shown that the twisting and turning of the flow through serpentine channels generate strong secondary flows that produce significant stretching in the fluid (4). Because lightmicroscopy images frequently show superimposition of two distinct fluids, they may overestimate the mixing efficiency.
Fig. 4.
Analysis of mixing efficiency in the serpentine mixer. (A) Light-microscopy images showing mixing of red- and blue-colored liquids at flow rates of 1.1 × 10⁻², 1.1 × 10⁻¹, and 5.5 × 10⁻¹ m/sec, from top to bottom, respectively. Images were reconstructed from several imaging fields covering the first six sections of the serpentine mixer. (B) OCT cross-sectional images showing mixing of two liquids with different concentrations of milk in the first part of the mixer. Positions of the cross-sectional images are indicated by the line and the corresponding numbers shown in A. The flow rates are 1.1 × 10⁻¹, 2.2 × 10⁻¹, 4.4 × 10⁻¹, and 6.6 × 10⁻¹ m/sec, from top to bottom, respectively. (C) Degree of mixing at the output indicated with an arrow in A and quantified from light-microscopy (filled diamonds) and OCT (open squares) images. Mixing exhibits an exponential dependence on the Reynolds number based on the light-microscopy image analysis and a linear dependence on the Reynolds number based on OCT image analysis. The images in A and B are not to scale.
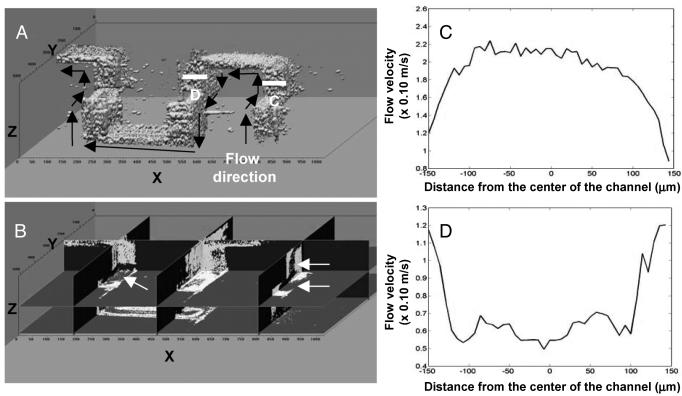
The solution to this problem addressed in this study is to use coherence ranging to obtain cross-sectional images of mixing profiles. Fig. 4B shows cross-sectional images obtained with OCT from a channel of the serpentine mixer containing two different water-diluted concentrations of skim milk at different flow rates. The two fluids with different concentrations of scatterers (lipids and proteins) produce different amounts of optical backscatter in OCT, thereby allowing the localization of unmixed and mixed liquids and spatial quantification of mixing efficiency. OCT images register the twisting, turning, and trapping of the flow. Using the described method, we found that the mixing efficiency in the serpentine mixer increased linearly with Reynolds numbers ranging from 0.55 to 55.5 (Fig. 4C), which is significantly lower than the efficiency found by light-microscopy image analysis. We believe that the results obtained by OCT image analysis are more accurate, because OCT image analysis does not measure superimposed flows as mixed fluids. Furthermore, OCT images provide information on the spatially varying regions of mixing within the microfluidic channels and devices. A series of cross-sectional images were taken with OCT of flows of two concentrations of milk in the serpentine mixer channel, which were reconstructed to obtain the 3D structure of the serpentine mixer (Fig. 5 A and B) using the slicer dicer program (PIXO-TEC). Mixing patterns inside channels can be seen from three perpendicular (x, y, and z) sections from this reconstructed 3D image, which characterize the overall mixing dynamics in the microfluidic channels (Fig. 5B). In addition, the flow profiles across channels of the serpentine mixer were also characterized with Doppler OCT (Fig. 5C). Because of the distortion of the flow at the connections between the layers of the microfluidic mixer, the velocity profile is not as smooth and parabolic in shape as would be found in a straight, uniform channel. As expected, the twisting and turning of the flow through the serpentine channel distorts the flow profile, and these distortions and variations can be imaged by using OCT.
Fig. 5.
3D OCT imaging of the serpentine mixer. (A) Portion of the serpentine mixer reconstructed from cross-sectional images. (B) Corresponding 3D mixing patterns from the channel extracted from the 3D data set for a flow rate of 5.5 × 10⁻¹ m/sec. Arrows indicate twisting and entrapment of two different fluids. (C and D) Cross-sectional flow profiles for a flow rate of 1.1 × 10⁻¹ m/sec at corresponding positions of the channel (indicated with lines C and D in A) characterized with Doppler OCT. The images are not to scale.
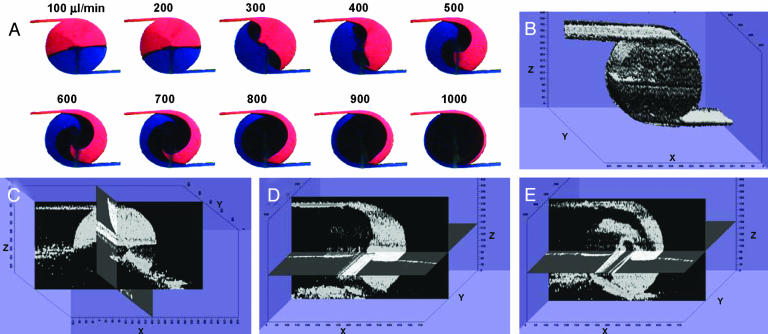
Analysis of Mixing in the Vortex Mixer by Using Light Microscopy and OCT. Using light microscopy, we obtained en face images (Fig. 6A) of a vortex mixer containing two fluid flows dyed red and blue at flow rates ranging from 100 to 1,000 μl/min. At all flow rates tested, light-microscopy images of outlet channel show complete mixing of the dyes (data not shown). A series of cross-sectional images of the same mixer with flows of two different milk concentrations were also obtained with OCT and assembled to obtain the 3D structure of the vortex mixer (Fig. 6B). Mixing profiles can be seen from x-, y-, and z-axis-oriented sections from this reconstructed 3D image. Although mixing patterns from x-axis-oriented sections (Fig. 6 C, D, and E) correspond to what was seen with light microscopy at the same flow rates tested, these OCT-acquired sections of the outlet channel at three different flow rates (Fig. 6 C, D, and E) show that mixing was incomplete. The overlapping of two fluids and entrapping of one fluid inside the other fluid can be seen clearly in these sections.
Fig. 6.
Mixing patterns in the vortex mixer. (A) Mixing pattern observed in the vortex mixer using light microscopy. Inlet flow rates are from 100 to 1,000 μl/min, indicated above each image. (B) Top view of 3D image of vortex mixer reconstructed from OCT cross-sectional images. Corresponding 3D mixing patterns at flow rates of 100 μl/min (C), 500 μl/min (D), and 800 μl/min (E) are shown. The images are not to scale. The original images for B and C were acquired along different axes and rotated to show corresponding mixing patterns.
Discussion
Fast and complete mixing is necessary for many biochemical reactions. However, the small scale of microfluidic devices precludes the use of turbulent flow for fast mixing in these systems. The designs of microfluidic systems will likely become more complex with 3D microstructures and dynamic as well as passive elements to increase mixing efficiency for biochemical reactions and to manipulate fluids and reactions in an automated manner. The use of OCT for understanding the mixing dynamics in microfluidic devices will help to improve and optimize the designs of these microfluidic systems. In addition, understanding and quantifying the 4D (3D spatial and time) mixing patterns in these devices on the microscale will help validate computational models.
To investigate the mixing dynamics in representative microfluidic devices, three types of microfluidic mixers (a Y channel mixer with a straight channel, a 3D serpentine mixer, and a vortex mixer) were investigated and imaged in this study. By using light-microscopy and OCT image analysis, mixing efficiency in the microfluidic channels of the 3D serpentine mixer was found to be significantly greater than the mixing efficiency in a straight channel at a given Reynolds number, as expected. However, distinctly different results were obtained between the two imaging techniques. Light-microscopy image analysis determined that the mixing efficiency in the channels of the 3D serpentine mixer was exponentially dependent on the Reynolds number (Fig. 4 A and C) (5), whereas OCT image analysis showed that the mixing efficiency was linearly dependent on the Reynolds number (Fig. 4 B and C). Light microscopy also determined that the mixing efficiency in the Y channel mixer did not increase with increasing Reynolds number, as reported previously (5), and this was validated with OCT (data not shown). OCT image analysis validated that complex microfluidic mixer designs do improve the mixing efficiency in microfluidic devices; however, the improvement is not as significant as demonstrated with light-microscopy analysis. Similar results also were obtained from the vortex mixer. Light-microscopy image analysis showed complete mixing at the outlet of the vortex mixer, whereas OCT image analysis showed that this was incorrect (Fig. 6). The differences noted in mixing efficiencies in these representative microf luidic mixers obtained with light-microscopy and OCT analyses are due to the different methods by which the images are generated. By performing depth-resolved cross-sectional imaging through microfluidic devices using OCT, a more accurate characterization of mixing dynamics can be determined, compared with light microscopy.
The 3D mixing patterns and flow-velocity profiles in microfluidic devices are also important parameters for quantifying performance and characterizing microscale fundamental flow phenomenon in microfluidic devices. OCT image analysis showed the twisting, turning, and trapping of the flow that occurs in a representative 3D serpentine mixer (Figs. 4B and 5B), which was also observed previously with confocal-microscopy analysis (4). By using OCT, deep imaging of the overall structure of microfluidic devices can be obtained (Figs. 5 A and B and 6), which can often be inaccessible with high-resolution confocal microscopy with high-numerical-aperture objectives. Flow-velocity profiles obtained with Doppler OCT in the straight channel of the Y channel mixer (Fig. 3) are consistent with standard models of laminar fluid flow in a narrow channel, and the distorted flow profiles obtained in the channels of the 3D serpentine mixer (Fig. 4) confirm the twisting and turning of the flow through the helical-shaped channel. Although these profiles represent the flow dynamics under constant flow velocities, the use of high-speed OCT and Doppler OCT can enable the visualization and quantification of transient mixing effects in real time.
OCT imaging has the potential to assist in the design and development of more complex microfluidic devices, because visualization of 3D structure and quantification of mixing performance deep within these devices is feasible. Our mixing analysis presented here can be applied when mixing is the only interaction between fluids and no other additional physical or chemical reactions have occurred. In these scenarios, reactions may result in the formation of new species or the degradation of the original species, with subsequent changes in the scattering profiles. Additional characterization of the scattering properties of the mixed and unmixed fluids would be required before quantitative measurements were made by using OCT. Because OCT is a coherent imaging technique, the presence of speckle and the averaging techniques used to reduce the effects of speckle can also reduce the spatial resolution of OCT. However, this loss of resolution is not significant compared with the typical size scales of microfluidic devices and channels. Additional consideration must also be given to the inherent tradeoff between imaging-acquisition rate and fluid-flow rate. In general, fast image-acquisition rates make detecting small flow velocities and small velocity changes problematic, and OCT acquisition rates should vary depending on the fluid-flow velocities under investigation.
Our results demonstrate that complex structural and more accurate functional information (e.g., mixing efficiency and flow-velocity profiles) can be obtained from microfluidic mixers by using OCT image analysis. In addition to the passive mixers investigated in this study, similar information can be obtained from various dynamic mixers or biomicroelectromechanical system devices containing active pumps, valves, and mechanics. New information obtained with OCT will likely improve future designs and validate computational models.
Acknowledgments
We thank Dr. Michal Balberg and Alex Schaefer for contributions during the early stages of this research. This research was supported in part by National Science Foundation Grant BES 00-86696 (to S.A.B.).
Abbreviation: OCT, optical coherence tomography.
Footnotes
Xi, C., Balberg, M., Selby, J., Boppart, S. A. & Raskin, L., Second Annual International Institute of Electrical and Electronics Engineers-Engineering in Medicine and Biology Society Special Topic Conference on Microtechnologies in Medicine and Biology, May 2-4, 2002, Madison, WI.
References
- 1.Figeys, D. & Pinto, D. (2000) Anal. Chem. 72, 330A-335A. [DOI] [PubMed] [Google Scholar]
- 2.Mitchell, P. (2001) Nat. Biotechnol. 19, 717-721. [DOI] [PubMed] [Google Scholar]
- 3.Harrison, D. J., Fluri, K., Seiler, K., Fan, Z. H., Effenhauser, C. S. & Manz, A. (1993) Science 261, 895-897. [DOI] [PubMed] [Google Scholar]
- 4.Liu, R. H., Stremler, M. A., Sharp, K. V., Olsen, M. G., Santiago, J. G., Adrian, R. J., Aref, H. & Beebe, D. J. (2000) J. Microelectromech. Syst. 9, 190-197. [Google Scholar]
- 5.Therriault, D., White, S. R. & Lewis, J. A. (2003) Nat. Mater. 2, 265-271. [DOI] [PubMed] [Google Scholar]
- 6.Vijayendran, R. A., Motsegood, K. M., Beebe, D. J. & Leckband, D. E. (2003) Langmuir 19, 1824-1828. [Google Scholar]
- 7.Stroock, A. D., Dertinger, S. K. W., Ajdari, A., Mezic, I., Stone, H. A. & Whitesides, G. M. (2002) Science 295, 647-651. [DOI] [PubMed] [Google Scholar]
- 8.Johnson, T. J., Ross, D. & Locascio, L. E. (2002) Anal. Chem. 74, 45-51. [DOI] [PubMed] [Google Scholar]
- 9.Sato, Y., Irisawa, G., Ishizuka, M., Hishida, K. & Maeda, M. (2003) Meas. Sci. Technol. 14, 114-121. [Google Scholar]
- 10.Tsai, J. H. & Lin, L. W. (2002) Sens. Actuators A Phys. 97/98, 665-671. [Google Scholar]
- 11.Grant, I. (1997) Proc. Inst. Mech. Eng. C J. Mech. Eng. Sci. 211, 55-76. [Google Scholar]
- 12.Meinhart, C. D., Wereley, S. T. & Santiago, J. G. (1999) Exp. Fluids 27, 414-419. [Google Scholar]
- 13.Huang, D., Swanson, E. A., Lin, C. P., Schuman, J. S., Stinson, W. G., Chang, W., Hee, M. R., Flotte, T., Gregory, K., Puliafito, C. A., et al. (1991) Science 254, 1178-1181. [DOI] [PMC free article] [PubMed] [Google Scholar]
- 14.Boppart, S. A., Bouma, B. E., Pitris, C., Southern, J. F., Brezinski, M. E. & Fujimoto, J. G. (1998) Nat. Med. 4, 861-865. [DOI] [PubMed] [Google Scholar]
- 15.Boppart, S. A., Tearney, G. J., Bouma, B. E., Southern, J. F., Brezinski, M. E. & Fujimoto, J. G. (1997) Proc. Natl. Acad. Sci. USA 94, 4256-4261. [DOI] [PMC free article] [PubMed] [Google Scholar]
- 16.Kulkarni, M. D., van Leeuwen, T. G., Yazdanfar, S. & Izatt, J. A. (1998) Opt. Lett. 23, 1057-1059. [DOI] [PubMed] [Google Scholar]
- 17.Wang, X. J., Milner, T. E. & Nelson, J. S. (1995) Opt. Lett. 20, 1337-1339. [DOI] [PubMed] [Google Scholar]
- 18.Chen, Z. P., Milner, T. E., Dave, D. & Nelson, J. S. (1997) Opt. Lett. 22, 64-66. [DOI] [PubMed] [Google Scholar]
- 19.Ren, H. W., Brecke, K. M., Ding, Z. H., Zhao, Y. H., Nelson, J. S. & Chen, Z. P. (2002) Opt. Lett. 27, 409-411. [DOI] [PubMed] [Google Scholar]
- 20.Schaefer, A. W., Reynolds, J. J., Marks, D. L. & Boppart, S. A. (2004) IEEE Trans. Biomed. Eng. 51, 186-190. [DOI] [PubMed] [Google Scholar]
- 21.Jo, B. H., Van Lerberghe, L. M., Motsegood, K. M. & Beebe, D. J. (2000) J. Microelectromech. Syst. 9, 76-81. [Google Scholar]
- 22.Marks, D. L., Oldenburg, A. L., Reynolds, J. J. & Boppart, S. A. (2002) Opt. Lett. 27, 2010-2012. [DOI] [PubMed] [Google Scholar]
- 23.Tearney, G. J., Bouma, B. E., Boppart, S. A., Golubovic, B., Swanson, E. A. & Fujimoto, J. G. (1996) Opt. Lett. 21, 1408-1410. [DOI] [PubMed] [Google Scholar]
- 24.Oldenburg, A. L., Reynolds, J. J., Marks, D. L. & Boppart, S. A. (2003) Appl. Opt. 42, 4606-4611. [DOI] [PubMed] [Google Scholar]
- 25.Mandel, L. & Wolf, E. (1995) Optical Coherence and Quantum Optics (Cambridge Univ. Press, Cambridge, U.K.).
- 26.Zhao, Y. H., Chen, Z. P., Saxer, C., Shen, Q. M., Xiang, S. H., de Boer, J. F. & Nelson, J. S. (2000) Opt. Lett. 25, 1358-1360. [DOI] [PubMed] [Google Scholar]
- 27.van Leeuwen, T. G., Kulkarni, M. D., Yazdanfar, S., Rollins, A. M. & Izatt, J. A. (1999) Opt. Lett. 24, 1584-1586. [DOI] [PubMed] [Google Scholar]


