Abstract
Purpose
This study examines methylprednisolone (MPL) effects on the dynamics of hepatic low-density lipoprotein receptor (LDLR) mRNA and plasma lipids associated with increased risks for atherosclerosis.
Materials and methods
Normal male Wistar rats were given 50 mg/kg MPL intramuscularly (IM) and sacrificed at various times. Measurements included plasma MPL and CST, hepatic glucocorticoid receptor (GR) mRNA, cytosolic GR density and hepatic LDLR mRNA, and plasma total cholesterol (TC), low-density lipoprotein cholesterol (LDLC), high density lipoprotein cholesterol (HDLC), and triglycerides (TG).
Results
MPL showed bi-exponential disposition with two first-order absorption components. Hepatic GR and LDLR mRNA exhibited circadian patterns which were disrupted by MPL. Down-regulation in GR mRNA (40–50%) was followed by a delayed rebound phase. LDLR mRNA exhibited transient down-regulation (60–70%). Cytosolic GR density was significantly suppressed but returned to baseline by 72 h. Plasma TC and LDLC showed increases (55 and 142%) at 12 h. A mechanistic receptor/gene pharmacokinetic/pharmacodynamic model was developed to describe CS effects on hepatic LDLR mRNA and plasma cholesterols.
Conclusions
Our PK/PD model was able to satisfactorily capture the MPL effects on hepatic LDLR, its relationship to various plasma cholesterols, and builds the foundation to explore this area in the future.
Keywords: cholesterol, corticosteroids, glucocorticoid receptors, LDL receptors, lipids, pharmacodynamics
INTRODUCTION
Corticosteroids are among the most important anti-inflammatory and immunomodulatory agents used for the treatment of asthma, lupus erythematosus, rheumatoid arthritis, organ transplantation, and many other conditions. Despite their beneficial effects, long-term use of these drugs is generally associated with severe metabolic side effects including steroid-induced diabetes, muscle atrophy, and disorders in lipid metabolism which limit their therapeutic usefulness (1).
The effects of CS on lipid metabolism include development of the usual features of Cushing’s syndrome such as obesity in the upper-body, moon face, hyperglycemia, hypercholesterolemia, hypertriglyceridemia, and occurrences of abdominal striae. Alterations in plasma lipids associated with CS therapy were reported by Adlersberg et al. (2) where 77% of patients under study showed significant increases in their plasma TC, 36% exceeding 280 mg/dl. More recently, Blum and colleagues (3) observed a significant correlation between prednisolone concentrations and changes in total serum cholesterol in patients with chronic rheumatologic disorder. Many reports suggest a direct association between changes in specific lipoprotein associated cholesterol and CS therapy (4–6), which may ultimately lead to premature risks for atherosclerosis. Although CS-mediated adverse plasma lipid profiles are well documented, the mechanisms behind such changes are still not clear.
One of the major regulators of plasma cholesterol is the hepatic low-density lipoprotein receptor (LDLR), which contributes up to 50–80% of LDL clearance from the plasma in various animal species and affects both the rates of formation and clearance of LDL (7,8). Defects or mutations in the LDLR gene result in increased plasma cholesterol, leading to an increase risk of coronary heart diseases and atherosclerosis (9). Reports studying both in vitro and in vivo systems showed CS-mediated decreases in hepatic LDLR mRNA and activity, resulting in decreased binding and degradation of LDL in both humans and rats (6,8,10). Our recent microarray studies (11) as well as preliminary studies in ADX rats where animals were dosed with 50 mg/kg MPL (unpublished results) showed a significant decrease (30–40% of baseline) in hepatic LDLR mRNA expression at 2 h post-treatment, which returned to baseline at approximately 12 h.
Our laboratory has been engaged in investigating various metabolic effects of CS from a quantitative perspective for the past two decades and highly mechanistic models have been built to characterize various biomarkers of CS in several tissues (12,13). However, to date little attention has been paid to the metabolic effects of CS on lipid metabolism. The objectives of our current study were to examine CS-mediated changes of various plasma lipids, especially those considered as risk factors for atherosclerosis and to quantitatively identify relevant physiological factors that may be involved in the alterations of lipids such as hepatic LDLR mRNA expression.
MATERIALS AND METHODS
Animals
Normal male Wistar rats weighing between 125 and 175 g were purchased from Harlan-Sprague-Dawley (Indianapolis, IN). The animals were housed in our University Laboratory Animal Facility and acclimatized under constant temperature (22°C) and humidity (72%) with a controlled 12 h/12 h light/dark cycle (lights on at 6:15 am and lights off at 6:15 pm) for at least 2 weeks. All rats had free access to standard rat chow and drinking water. Our protocol adhered to the Principles of Laboratory Animal Care (National Institute of Health publication 85-23, revised 1985) and was approved by the University at Buffalo Institutional Animal Care and Use Committee.
Experimental Design
After 2–3 weeks of acclimatization, rats (250–325 g) received 50 mg/kg methylprednisolone succinate (Solu-Medrol®, Pharmacia & Upjohn, Kalamazoo, MI) by IM injection in the left hind haunch (gluteus muscle) at the nadir of the circadian pattern of their endogenous CST (between 7:45 and 9:45 am). Rats were weighed, anesthetized with ketamine/xylazine, and sacrificed by aortic exsanguinations at 0.25, 0.5, 0.75, 1, 2, 4, 5, 6, 7, 8, 12, 24, 36, 48, 60, 72, 84 and 96 h (n=3 per time point). Six rats, injected with saline and sacrificed at 12 and 24 h (n=3 per time point), served as controls. Blood was collected from the abdominal aorta; plasma was harvested by centrifuging blood at 2,000×g at 4°C for 15 min and stored at −80°C until analysis.
Plasma Drug Assay
Plasma was thawed and kept on ice until steroid extraction. Methylprednisolone and corticosterone concentrations were determined by a normal phase high-performance liquid chromatography (HPLC) method (14). The lower limits of quantification for both of these steroids are 10 ng/ml. Inter-day and intra-day coefficients of variations were less than 10%.
Glucocorticoid Receptors
A previously developed (12) radio-ligand binding assay was used to quantify the hepatic free cytosolic GR density with some modifications. Liver tissues stored at −80°C were ground in liquid nitrogen chilled mortars and pestles. The ground liver tissue, 1.5 g, was thawed in 9 ml of ice-cold assay buffer (50 nM Trizma base, 0.2 mM sodium EDTA, and 10 mM sodium molybdate at pH=7.5) for 20 min. Livers were homogenized and centrifuged at 10,000×g (4°C) for 30 min. The supernatant was passed through two layers of cheesecloth to obtain “crude” cytosol; 0.5 ml of dextran-coated activated charcoal in ice-cold assay buffer (5%) was then added to this supernatant (0.5 ml charcoal/5 ml of supernatant) and centrifuged at 10,000×g at 4°C for 15 min to remove any free MPL or CST. The resulting supernatant was spun at 90,000×g (4°C) for 90 min in a Beckman L7–55 ultracentrifuge (Beckman Instruments, Fullerton, CA) to obtain cytosol. This step removes materials which increase the non-specific binding of the 3H-labeled dexamethasone (DEX) in the cytosol. Aliquots of 300 µl cytosol were incubated at 4°C for 18 h with 75 µl of 3H-labeled DEX (39 Ci/mmole; Amersham, Arlington Heights, IL) in 1.5 ml polypropylene microfuge tubes (VWR Scientific, Rochester, NY). Assay concentrations of DEX ranged from 0.63 to 50 nM. Parallel incubations were set up in the presence and absence of 75 µl excess unlabeled DEX (Sigma Chemical, St. Louis, MO; assay concentration, 16.7 µM). Final assay volumes were 450 µl. Two 50 µl aliquots of cytosol were counted by liquid scintillation (Packard Instrument, Meriden, CT) to determine the total concentrations of 3H-DEX added into the assay. After 18 h of incubation, 150 µl of dextran-coated charcoal in ice-cold assay buffer was added to the cytosol to remove any free 3H-DEX. After centrifugation (12,800×g, 15 min, 4°C), 400 µl aliquots of the supernatants were counted to determine total binding (DT) and non-specific binding (DNS). Cytosolic free GR density (Bmax) was estimated using the ADAPT II program (Biomedical Simulations Resource, Los Angeles, CA) by simultaneously solving:
| (1) |
and
| (2) |
where KD is the equilibrium dissociation constant for DEX for glucocorticoid receptor binding and KNS is the non-specific binding constant. The receptor density (Bmax) values were normalized by the protein content in the cytosol preparation.
Hepatic GR and LDLR Measurements
Total RNA was extracted from ground liver stored at −80°C in TRIzol reagent (Invitrogen, Carlsbad, CA) according to manufacturer’s instructions. To account for variable extraction yields, an external cRNA standard (GRG 1-cRNA) was added to each liver sample before extraction. The quality and integrity of extracted RNAs were confirmed by the ratio of optical densities at 260 and 280 nm and agarose formaldehyde gel electrophoresis. RNA quantities were determined by optical densities at 260 nm. Total RNA samples were diluted to desired concentrations in nuclease free water (Ambion, Austin, TX) and stored at −80°C until further analysis. The yield of RNA extraction was determined for each liver sample by comparing the quantity of external cRNA standard added before the extraction into liver tissue with that recovered after extraction (15).
For construction of the LDLR cRNA standard, a 738 bp region of the rat LDLR gene (Accession # NM_175762) was cloned into pCR® II-TOPO (Invitrogen, Carlsbad, CA). The following primers (custom synthesized by Bioresearch Technologies, Novato, CA) were used for cloning; forward: 5′(AAGAAAGGGGGTTTGAATGG)3′, reverse: 5′(GGAGGACACTGTCACCGACT)3′. The cloned construct was used to synthesize a cRNA standard specific for rat LDLR, by in vitro transcription. To synthesize the cRNA standard, plasmid was linearized with Hind III and transcribed in vitro with T7 polymerase (MEGASCRIPT T7 polymerase kit, Ambion, Austin, TX). The purity and integrity of the cRNA was confirmed by 260/280 absorbance ratios and electrophoresis on 5% acrylamide/8M urea gels. The final concentration of cRNA was determined by the absorbance at 260 nm.
To quantify LDLR, GR, and GRG-1 mRNAs the kinetic-based QRT RT-PCR assays developed with gene specific TAQMAN probes and primers for QRT RT-PCR assays were employed. Specific TaqMan probes and primers were designed using PrimerExpress software (Applied Biosystems, Foster City, CA); sequences sharing homology with other rat genes were excluded. Primers/probes were custom synthesized by Biosearch Technologies (Novato, CA). The probes were synthesized with the fluorescent reporter FAM (for LDLR and GR) or HEX (GRG) attached to the 5′ end and the appropriate BHQ attached to the 3′ end. Forward and reverse primer design allowed positioning of the two oligonucleotides as close to one another without overlapping the probe.
The assay was performed using the Brilliant 1-Step Quantitative RT-PCR Core Reagent Kit (Stratagene) according to the manufacturer’s instructions in a MX3000 flourecence based thermal cycler (Stratagene). A cRNA standard curve was generated for each assay; standards were run in duplicate whereas samples were run in triplicate. A reverse transcriptase minus control (non-amplification control) for each sample to test for the possibility of genomic DNA contamination in extracted RNA and non-template controls (NTC) were run with each assay. In all cases these controls gave no significant amplification signal. Construction of cRNA standard curves allowed quantification of mRNA in moles of message. The optimum concentrations for the various forward and reverse primers, probes, and magnesium chloride along with the oligonucleotide sequences are listed in Table I. As a time saving measure, a multiplex assay for GR and GRG-1 message was run in a single tube without reduction in sensitivity. The intra- and inter-assay coefficients of variation for all transcripts of interest were less than 15%.
Table I.
Primer and Probe Sequences
| Gene | Oligonucleotide | Conc., nM | Sequence 5′-3′ | MgCI2, mM |
|---|---|---|---|---|
| LDL-receptor | Forward primer | 200 | CCTCCCAGAAGTCGACACTGTAC | 2.5 |
| Reverse primer | 200 | TTCAGTGACACAGCAGCTGATG | ||
| FAM-labeled probe | 100 | CACCATTGGGCCTGTGGTCACCA | ||
| Glucocorticoid receptor | Forward primer | 300 | AACATGTTAGGTGGGCGTCAA | 5 |
| Reverse primer | 300 | GGTGTAAGTTTCTCAAGCCTAGTATCG | ||
| FAM-labeled probe | 100 | TGATTGCAGCAGTGAAATGGGCAAAG | ||
| GRG-1 (external standard) | Forward primer | 300 | CGGTTCTGGTGTAATGCTAAAGCT | 5 |
| Reverse primer | 300 | AGTTCGCCAAGGGCTTCTC | ||
| HEX-labeled probe | 100 | CCCTTCGAAATTCCAAGCCAAGTATGTCAT |
Lipid Assays
Commercially available kits (Wako Diagnostics, Richmond, VA) were used for quantitative determination of plasma total cholesterol (cholesterol E: in vitro enzymatic colorimetric method, code no. 276-64909), HDL-cholesterol (HDL-cholesterol E, phosphotugstate–magnesium salt precipitation method, code no. 431-52501), LDL-cholesterol (L-type LDL-C, 993-00404: reagent 1, 999-00504: reagent 2, 991-00302: HDL-C/LDL-C calibrator) and triglycerides (L-type TG H, 997–37492: reagent 1, 993–37592: reagent 2, 996–41791: lipid calibrator). All assays were performed with modifications of manufacturer’s procedures in order to scale down to a microplate format.
The general principle for measuring HDL and LDL cholesterol was to remove other lipoprotein fractions, followed by measurement of cholesterol associated with these two moieties. This involved conversion of cholesterol esters in the plasma to free cholesterol. Free cholesterol (either converted from the esters or already existing as free cholesterol) are then oxidized to form hydrogen peroxide (as byproduct) followed by its quantitative oxidative condensation with 4-aminoantipyrene and N-(2-hydrocy-3-sulfopropyl)-3,5-dimethoxyaniline to produce a blue color complex which was read at 600 nm using a microplate reader (SpectraMAX 190 ELISA plate reader, Molecular Devices, CA). The plasma total triglyceride assay involved hydrolysis of triglycerides to fatty acids and glycerol, conversion of glycerol to glycerol-3-phosphate and oxidation of glycerol-3-phosphate to form hydrogen peroxide. Thereafter, the chemical reaction was identical to that for cholesterol. For all assays, dilutions of the provided lipid calibrators were made to obtain the standard curve. The standards were run in duplicate and samples were run in triplicate. In all cases, the variability of the assay was less than 10%.
Additional Data Source
Information regarding daily fluctuations of various mRNA and protein markers were obtained from a circadian rhythm study previously performed in our lab (16,17). In this study, two groups of rats were acclimatized to a strict 12 h/12 h light/dark regimen and sacrificed at various time points to characterize circadian variation of various glucocorticoid-regulated biomarkers.
Methylprednisolone Pharmacokinetics
A two-compartment mammillary model with two absorption pathways from the injection site was used to describe the plasma PK following dosing with 50 mg/kg IM MPL (18). The equations describing the model are:
| (3) |
| (4) |
where A, C and D are the amount, concentration and dose in the corresponding compartments designated by the subscripts P and T representing plasma and tissue (distribution) compartments; kel is the first-order elimination rate constant, Vc is the central volume of distribution, k12 and k21 are first-order inter-compartmental distribution rate constants, Fr and (1–Fr) are the fractions of dose absorbed through two absorption pathways described by two first-order rate constants, ka1 and ka2. The overall IM bioavailability (F) was determined by simultaneously fitting plasma MPL concentrations after 50 mg/kg IV and IM dosing (18).
Molecular Mechanisms of Corticosteroid Pharmacodynamics
Most metabolic effects of CS are known to be receptor/gene-mediated. These moderately lipophilic drugs enter the cells, predominantly by passive diffusion. There, they bind to cytosolic glucocorticoid receptors (GR). Binding of ligand causes subsequent conformational changes, phosphorylation and activation of the receptors (19). The activated drug-receptor complex rapidly translocates into the nucleus (20,21) where it binds to specific sequences in the target gene, glucocorticoid response elements (GRE), causing changes in rates of transcription of the target gene. Such changes result in alterations in levels of specific mRNA and subsequent changes in proteins leading to various physiological effects exerted by CS (1,19). Part of these receptors may undergo degradation and the rest may recycle back to the cytosol to bind to new ligand (22). Although less is known about CS inhibitory (negative GRE) compared to stimulatory (positive GRE) effects (23), CS are known to inhibit expression of their own receptor gene (22,24). In addition to rapid down-regulation of the cytosolic free receptors caused by the translocation process, inhibition of GR mRNA transcription by activated nuclear drug-receptor complex further reduces the free cytosolic GR.
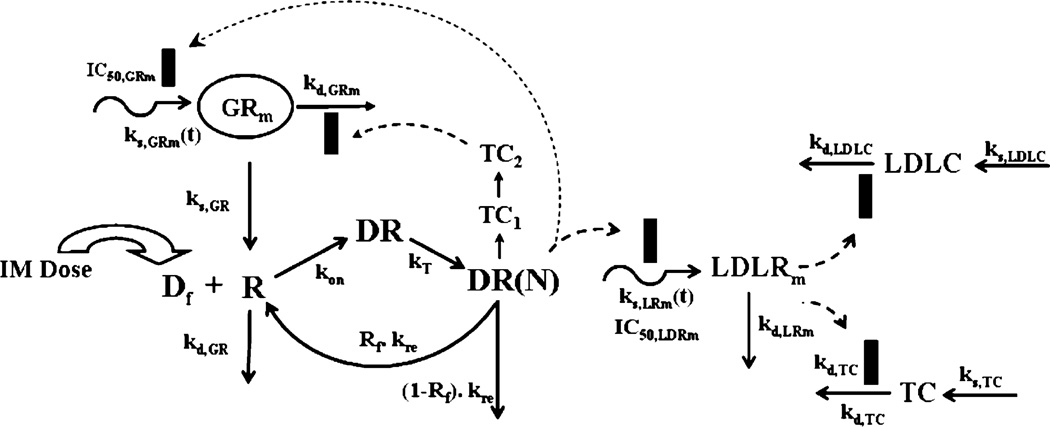
An integrated pharmacokinetic/pharmacodynamic (PK/PD) model of CS receptor/gene-mediated effects on hepatic LDL-receptors and plasma total and LDL-cholesterol concentrations in normal rats is shown in Fig. 1. Since the pattern of cytosolic receptor density was identical to that in ADX rats (12), the general structure of the fifth-generation model of receptor dynamics was followed. However, features required to describe complex regulation of GR mRNA in homeostasis and post-treatment conditions in normal rats were incorporated.
Fig. 1.
Receptor/gene-mediated model for methylprednisolone effects on hepatic LDL-receptor mRNA and plasma cholesterol dynamics in normal rats. The model is described in the text by Eqs. 3–18. Solid rectangles represent inhibition of either production or loss rate of a turnover process.
Since the free cytosolic receptors in the control rats and from our previous circadian rhythm study (16) did not show any circadian variation, it was assumed that the down-regulation of receptors is mediated by MPL only and not by endogenous CST. In the absence of MPL the receptors are produced by their GR mRNA by a first-order rate constant, kS,GR, and degraded by a first-order rate constant kd,GR. Free cytosolic receptors interact with free MPL (Df=0.23 Cp/Vp) to form drug-receptor complex in the cytosol (DR), which rapidly translocates into the nucleus with a first-order rate constant kT (25), forming DR(N). Part of DR(N) may either recycle back (Rf) to the cytosol or may degrade with a rate constant of (1–Rf) kre. The equations describing this chain of events are:
| (5) |
| (6) |
| (7) |
The receptor density was determined in two groups of control animals sacrificed at 12 and 24 h, and the initial condition for Eq. 5 was fixed to the mean values from those two groups (476 fmol/g). The initial conditions for Eqs. 6–7 were set to zero. The free fraction of MPL was fixed to 0.23 (26).
The regulation of GR mRNA was more complex in normal rats than ADX rats. An obvious circadian rhythm was observed in hepatic GR mRNA from our circadian rhythm study (16). This variation was described by an indirect response model with time-dependent production rate (independent of endogenous corticosterone circadian rhythm), ks,GRm, and first-order loss rate constant, kd,GRm:
| (8) |
The time-dependent production rate, ks,GRm(t), of GR mRNA in control rats was described by two harmonic functions as:
| (9) |
where a0,GR, a1,GR, a2,GR, b1,GR, and b2,GR are Fourier coefficients obtained by fitting the GR mRNA circadian rhythm data from control animals using FOURPHARM (27).
The down-regulation followed by rebound in GR mRNA caused by MPL was described by DR(N) mediated inhibition of ks,GRm(t) and subsequent inhibition of kd,GRm by a transduction signal generated from DR(N):
| (10) |
| (11) |
| (12) |
where TC1 and TC2 are two transit compartments, τTc is the mean transit time for signal transduction from DR(N), IC50,GRm is the concentration of DR(N) at which the synthesis rate of GR mRNA is reduced to 50% of its baseline, and IC50,TC2 is the concentration of TC2 responsible for 50% inhibition of the loss rate for GR mRNA Because stationarity was not assumed for normal rats, the ks,GR parameter was estimated with other parameters. The initial conditions for Eqs. 10–11 were set to zero, whereas the initial condition for Eq. 12 was fixed to the measured average values of GR mRNA from the control rats sacrificed at 24 h (16.34 fmol/g). The GR mRNA and free hepatic cytosolic receptor density from the treated animals were fitted simultaneously, and the fitted parameters were fixed for further analysis of hepatic LDLR and plasma lipid dynamics.
LDL-Receptor mRNA Dynamics
The circadian rhythm of hepatic LDLR mRNA was described by an indirect response model with time-dependent production rate, ks,LRm, and a first-order loss rate constant of LDLR mRNA, kd,LRm,
| (13) |
The ks,LRm(t) was described by two harmonic functions as:
| (14) |
where a0,LDLR, a1,LDLR, a2,LDLR, b1,LDLR, and b2,LDLR are Fourier coefficients obtained by fitting the LDLR mRNA circadian rhythm data from control animals using FOURPHARM (25).
The dynamics of hepatic LDLR mRNA following MPL treatment was described by DR(N) mediated inhibition of ks,LDLRm(t) given as:
| (15) |
where IC50,LDLR is the concentration of DR(N) which causes 50% reduction in the synthesis rate of LDLR mRNA. The initial condition for Eq. 15 was fixed to the measured average values of LDLR mRNA from the control rats sacrificed at 24 h (2.5 or 26.5 h circadian time). The LDL mRNA dynamics from the treated animals was fitted using Eqs. 13–15 and estimated parameters were fixed for further analysis of plasma cholesterol. The Fourier constants obtained from fitting control LDL mRNA data from the circadian rhythm study were used to describe the time-dependent synthesis rate of LDLR mRNA in the treated rats.
Plasma Lipid Dynamics
One of the major pathways of cholesterol removal from the body is via hepatic LDL-receptors. Increased LDLR causes increased removal of systemic cholesterol, causing a decline in its concentrations; on the other hand, reduced expression of LDLR causes an increase in plasma LDLC by reducing its removal (28). Since we only measured mRNA and not the expression or binding activity of LDL receptors, we assumed that any change in LDL mRNA from its circadian baseline will indirectly affect the removal rate of both total and LDL cholesterol. Thus the regulation of both can be given as:
| (16) |
| (17) |
where ks,LDLC and ks,TC are the zero-order synthesis rates; kd,LDLC and kd,TC are the first-order loss rate constants for plasma LDLC and TC; IC50,LDLC and IC50,TC are the difference in LDLR mRNA between the treated and control rats responsible for 50% inhibition of kd,LDLC and kd,TC-Ideally, the natural degradation of LDLC should contribute to the TC degradation, however, for simplicity, these two loss rate constants were assumed to be independently affected by LDL mRNA. The initial conditions for Eqs. 16–17 were estimated as model parameters and the synthesis rate constants for LDLC and TC were expressed in terms of the baseline [cholesterol(0)] and degradation rate constant (kd,chol) as:
| (18) |
Data Analysis
The animals in the treatment group were dosed with MPL between 1.5 and 3.5 h after “lights on”. For simplicity, we assumed the treatment time to be at 2.5 h circadian time in order to compare the data from our circadian rhythm study, which served as an additional set of controls for this experiment. All figures with temporal profiles of pharmacodynamic measurements in normal rats (GR mRNA, GR, LDLR mRNA, plasma LDLC, TC, HDLC and TG) have been plotted with respect to circadian time where dosing occurred at 2.5 h. However, all times specified refer to post-dosing time unless mentioned otherwise.
Data from multiple animals were pooled and ADAPT II with maximum likelihood method was applied for all fittings. The variance models in Eqs. 19–20 were used for estimating receptor binding parameters (Eqs. 1–2), MPL PK and various PD endpoints,
| (19) |
| (20) |
where Y represents the predicted PK or PD measures; σ1 and σ2 are the variance parameters which were fitted, and θ represents the structural parameters. The goodness of fit was assessed by model convergence, visual inspection of the fitted curves, Akaike Information Criterion (AIC), Schwarz Criterion (SC), estimator criterion value, examination of residuals, and CV% of the estimated parameters.
RESULTS
Pharmacokinetics
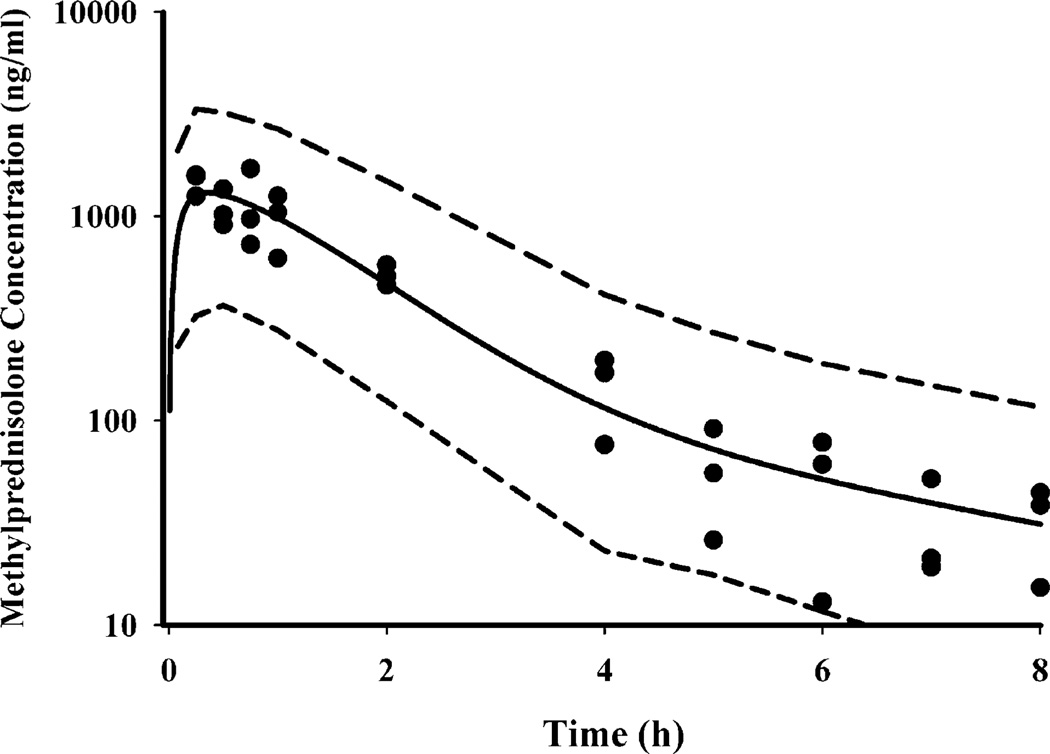
The time course of plasma MPL concentrations after 50 mg/kg IM administration is shown in Fig. 2. Comparison with IV MPL kinetics in ADX rats (12), as well as preliminary experiments after IV and IM administration conducted in normal rats (18) indicated a longer half-life after IM dosing than with IV. MPL was quantifiable in all rats up to 8 h in the IM group compared to only 4 h in the IV group indicating absorption rate-limited elimination (flip-flop kinetics). Simultaneous fittings of both IV and IM data, at a dose of 50 mg/kg, allowed resolution of all kinetic parameters with reasonable precision (Table II). Two first-order absorption processes, one with a faster rate (1.255 h−1, 23.2% CV) than the other (0.219 h−1, 53.6% CV), were optimal to describe the release of MPL from the injection site. The value of Fr indicates that about 72.5% of the drug in the muscle site can be released in the circulation via the faster absorption pathway whereas the remaining fraction is released more slowly. The overall bioavailability of IM MPL, 0.214 (16.4% CV) in rats is lower compared to that in humans (29). It is also lower than another CS, dexamethasone, following IM dosing in rats (30). The clearance (4.0 1/h/kg, calculated from kel.Vc) and Vc (0.719 1/kg, 39.5% CV) values were similar to previously reported values (CL 3.48 1/h/kg and Vc 0.73 1/kg) in ADX rats after single doses of MPL (31).
Fig. 2.
Plasma pharmacokinetic profile of methylprednisolone after 50 mg/kg IM dosing. The circles depict individual data from rats and the solid line represents the model (Eqs. 3–4 and Table II) fitted lines. The dashed lines depict 95% confidence interval of model predictions.
Table II.
Pharmacokinetic Parameters of Methylprednisolone
| Parameters | Definition | Value (CV%) |
|---|---|---|
| kel (h−1) | Elimination rate constant | 5.57 (28.6) |
| Vc (1/kg) | Central volume | 0.719 (39.5) |
| CL (1 h−1 kg−1) | Clearance | 4.0 (15.9) |
| k21 (h−1) | Distribution rate constant | 3.61 (50.8) |
| k21 (h−1) | Distribution rate constant | 2.84 (21.3) |
| ka1 (h−1) | Absorption rate constant | 1.255 (23.2) |
| ka2 (h−1) | Absorption rate constant | 0.219 (53.6) |
| F | Bioavailability | 0.214 (16.4) |
| Fr | Fraction absorbed by ka1 | 0.725 (11.3) |
GR Dynamics
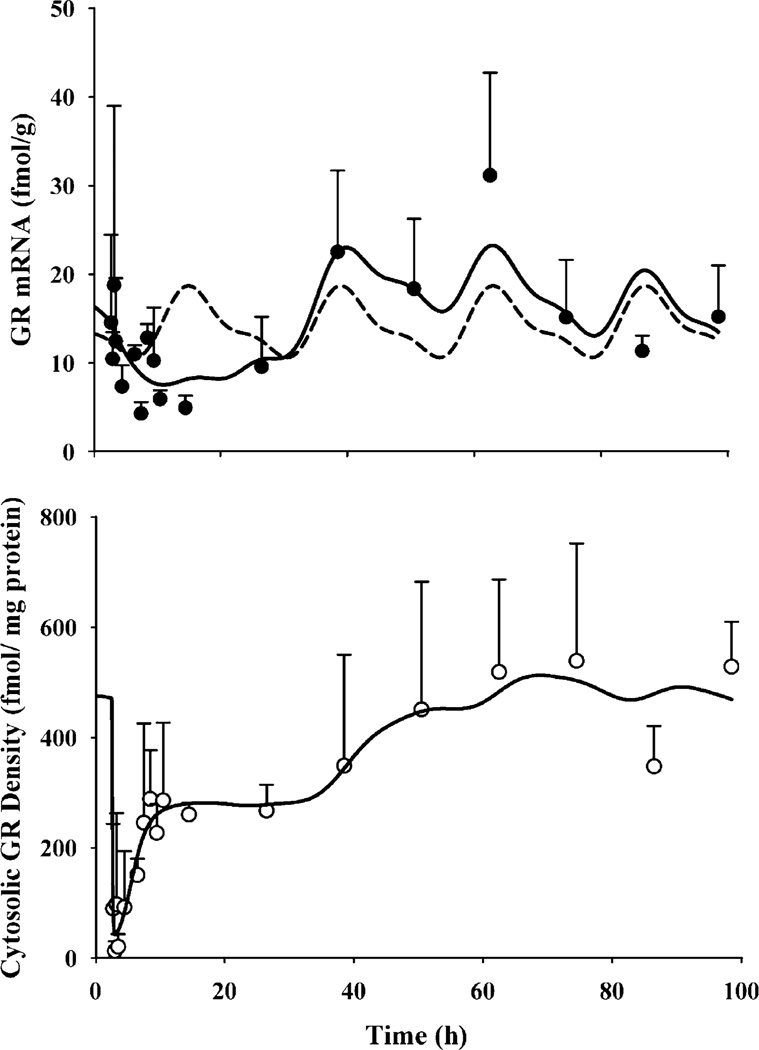
The dynamics of hepatic GR mRNA after MPL treatment, along with the model fittings and simulations based on the parameters obtained from fitting GR mRNA levels from our circadian rhythm study, are shown in Fig. 3 (top panel). The parameters describing the circadian rhythm of GR mRNA are given in Table IV. MPL causes significant perturbation in GR mRNA which, unlike CST, does not return to its regular daily rhythm within the time frame of our study. GR mRNA declined to 25–30% of the baseline followed by a rebound phase with mRNA systematically rising higher than baseline (approximately 30–40% above the baseline at 48 and 60 h). The time course of free hepatic cytosolic receptor density in normal rats along with the model fittings, are given in Fig. 3 (bottom panel). The estimated receptor dynamic parameters are listed in Table III. Free GR readily disappeared from the cytosol (within 15 min) after MPL dosing, followed by a biphasic return similar to that reported in ADX rats after various doses of IV MPL (32). Almost 50% of GR (constituting the first return phase) was recovered within 5 h post-treatment. The estimated recycling factor (Rf) of 0.925 (3% CV) indicating almost 93% recovery of receptors from the nuclear to the cytosolic compartment and the higher value of kre (1.31 h−1, 45.7% CV) compared to the ADX rats (Rf 0.49 and kre 0.57 h−1) accounted for the faster initial return phase in normal IM MPL-treated rats. The second return phase closely followed the return and rebound phase of GR mRNA. It took almost 60 h for complete recovery of GR density.
Fig. 3.
Hepatic GR mRNA (top panel) and free cytosolic GR density (bottom panel) in normal rats after 50 mg/kg IM MPL. The symbols depict the mean±SD and the solid lines depict model fitted lines. The dashed line in the top panel shows the simulated circadian rhythm of GR mRNA based on results obtained from our “circadian rhythm study” (parameters are given in Tables III and IV).
Table IV.
Circadian Rhythm Parameters for Hepatic GR and LDLR mRNA
| Parameters | Definitions | GR mRNA | LDLR mRNA |
|---|---|---|---|
| T(h) | Biorhythmic period | 24 | 24 |
| a0 | Fourier coefficients | 14.273 | 34.27 |
| a1 | −1.528 | −7.536 | |
| a2 | 0.554 | 0.034 | |
| b1 | −3.036 | −7.58 | |
| b2 | 1.188 | 1.608 |
Table III.
Dynamic Parameters for Hepatic Glucocorticoid Receptors
| Parameters | Definitions | Value (CV%) |
|---|---|---|
| kd,GRm (h−1) | Loss rate for GR mRNA | 0.12 (20.4) |
| IC50,MPL (nM) | Half-maximal inhibition kin | 15.2 (129.7) |
| IC50, TC2 (nM) | Half-maximal inhibition of kd | 60.5 (75.6) |
| τTC (h) | Transduction delay | 15.6 (68.4) |
| ks,GR (nM h−1 (fmol/g)−1 | Synthesis rate for GR | 1.4 (74.6) |
| kd,GR (h−1) | Loss rate for GR | 0.05 (80.8) |
| kon (nM−1 h−1) | Association constant | 0.016 (32.9) |
| kre (h−1) | Loss rate for DR(N) | 1.31 (45.7) |
| Rf | Recycling factor | 0.93 (3.0) |
| GRm(0) (fmol/g) | Initial value for GR mRNA | 16.34 (fixed) |
| R(o) (fmol/mg protein) | Initial value for GR density | 476.0 (fixed) |
LDLR mRNA
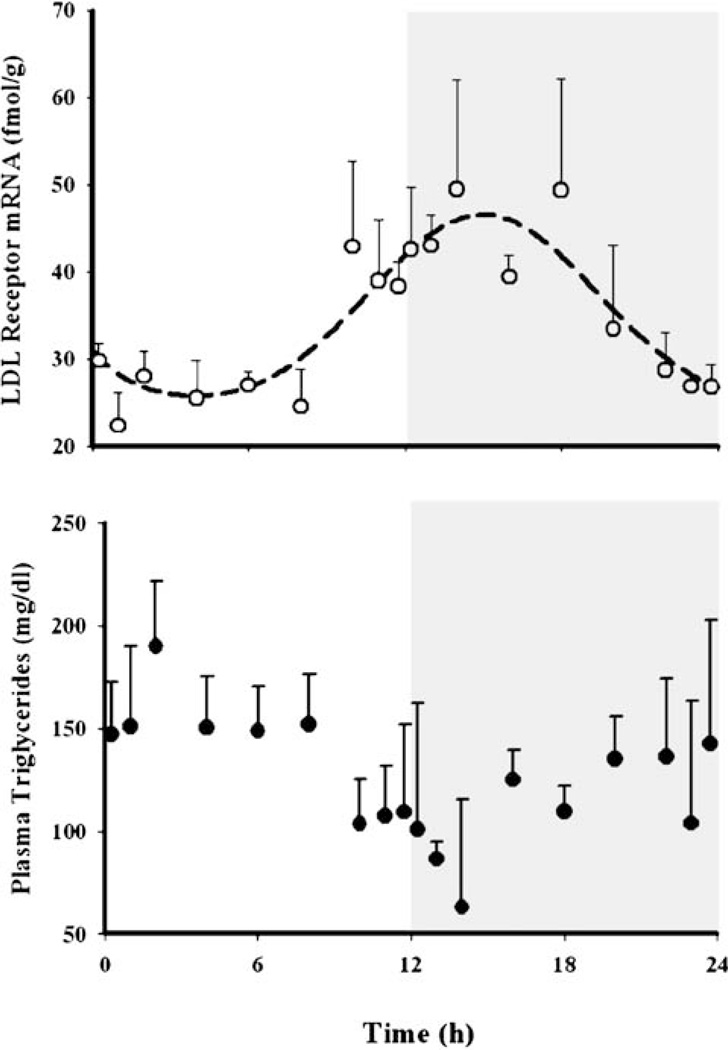
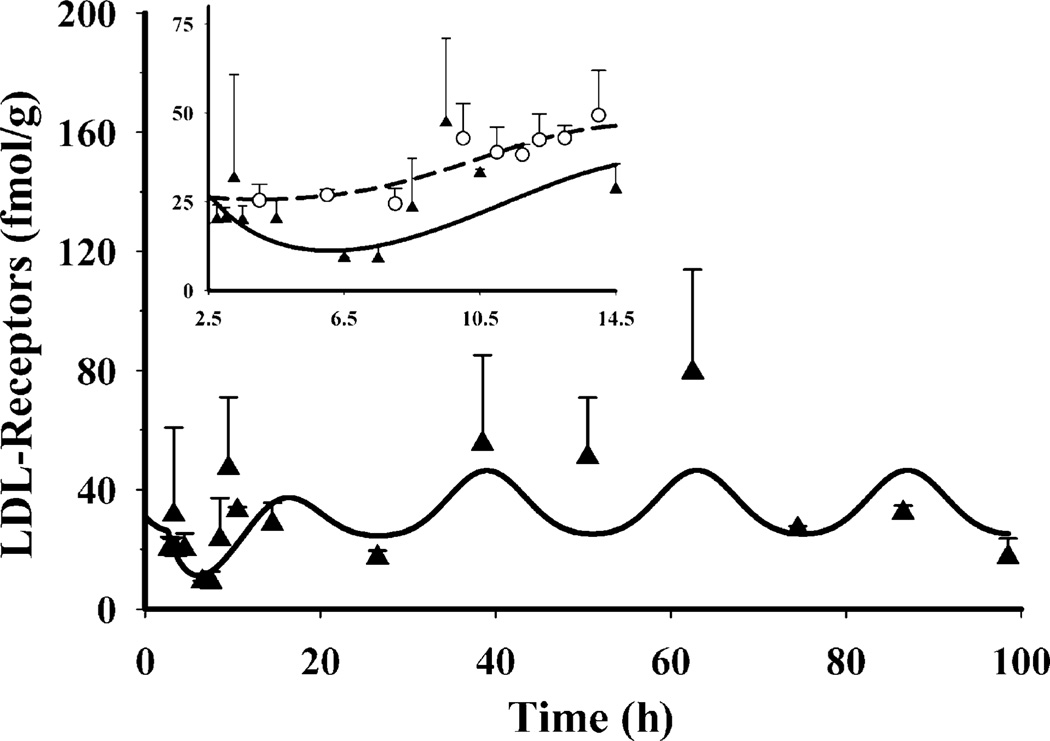
Concentrations of hepatic LDLR mRNA showed circadian variation (Fig. 4, top panel) reaching a peak (~49 fmol/g) at the early dark cycle (circa 14–18 h) and nadir (~25 fmol/g) at the early light cycle (4–6 h). Similar to GR mRNA, this pattern was assumed to be independent of the endogenous CST rhythm since exogenous CS shows opposite regulation. A time-dependent synthesis rate of the message with two harmonics described the data well (Table III). MPL caused a transient decrease in LDLR mRNA from its baseline (Fig. 5), reaching 9 fmol/g (~30% baseline) at 4–5 h (circa 6.5–7.5 h) and return to baseline within 6–7 h. A rebound phase followed by a peak at 60 h (~79 fmol/g). A structural model, similar to one used to describe GR mRNA dynamics, with transduction signals from the DR(N) inhibiting the loss rate of the message, was unable to capture the rebound phase of LDLR mRNA and resulted in poor precision of the estimated parameters. Therefore, an indirect response model where DR(N) inhibits the time-dependent synthesis rate of LDL mRNA was used instead to describe the dynamics of LDLR mRNA. Although our model was not able to capture the data well, especially the abrupt return of the message after 6.5 h circadian time, significant down-regulation of the message was apparent when compared with the controls from the circadian rhythm study (inset of Fig. 5). The temporal profile of LDL mRNA along with the model predictions are shown in Fig. 5. The estimated parameters describing LDLR mRNA dynamics in the MPL dosed rats are given in Table V.
Fig. 4.
Circadian rhythm profiles for hepatic LDLR mRNA and plasma total triglyceride profiles in normal male Wistar rats (data obtained from the circadian rhythm study). Symbols depict the mean observed data±SD and the dashed line in the top panel represents model fittings to Eq. 14.
Fig. 5.
Dynamics of hepatic LDLR mRNA in normal rats after 50 mg/kg IM MPL dosing. The symbols depict the mean observed data±SD and the solid lines represent model (Fig. 1) fittings. The inset compares the dynamics of LDLR mRNA after IM MPL (triangles) to its circadian baseline (circles).
Table V.
Dynamic Parameters for MPL Effects on LDLR mRNA
| Parameters | Definition | Value (CV%) |
|---|---|---|
| kd,LDLR (hr−1) | Loss rate for LDLR | 0.571 (39.0) |
| IC50,LDLRm (nM) | Half-maximal inhibition | 148.7 (49.0) |
| LDLRm(0) | Initial value | 31 fmol/g (fixed) |
Plasma Lipid Dynamics
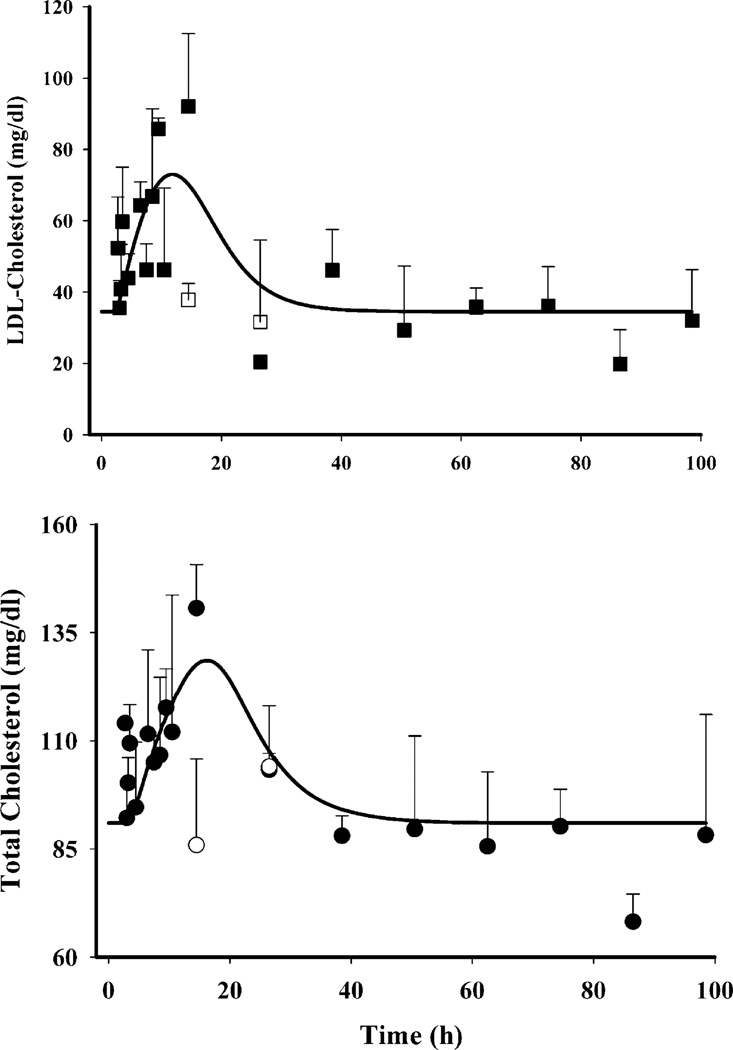
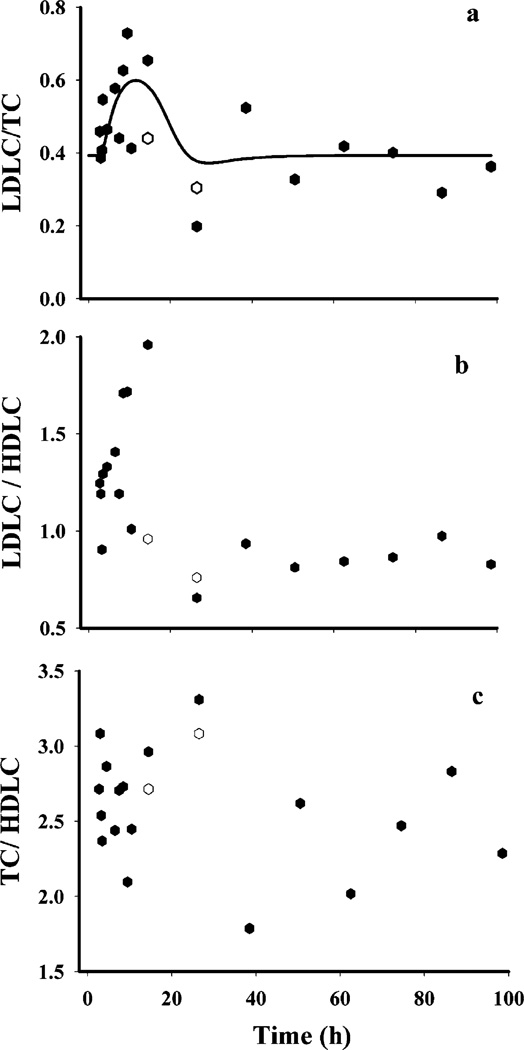
Plasma TC or LDLC did not show any circadian variation; however, MPL caused a significant increase in both as shown in Fig. 6. Plasma TC (bottom panel, Fig. 6) in the MPL dosed rats showed a systematic increase within 2–4 h, reaching a peak of 140.7±10.1 mg/dl at 12 h. This value was significantly higher than their controls, 85.9±19.9 mg/dl (p<0.05). The concentrations returned to the baseline within 24 h. Plasma LDLC (top panel, Fig. 6) followed a similar pattern, with a peak of 92.0±20.5 mg/dl at 12 h which was significantly higher than the control of 37.8±4.7 mg/dl (p<0.05). LDLC also returned to baseline by 24 h. Our model, based upon the assumption that any decrease in hepatic LDLR mRNA from its baseline (Δ change in baseline) will decrease removal of plasma cholesterol thereby causing an increase in concentrations, captured both LDLC as well as TC dynamics well. The coefficient of variation of the estimated parameters for plasma cholesterol dynamics, given in Table VI, were high perhaps due to lack of sampling points during 12–24 h when the return of cholesterol to baseline occurs. Significant inter-animal variability was also observed in MPL-mediated initial increases in both LDLC and TC. Figure 9a shows the temporal profile of the observed mean ratio of plasma LDLC to TC as well model predictions, which may further shed light on the relative regulation of cholesterol by LDR mRNA. The increase in this ratio indicates that MPL treatment, besides causing an increase in plasma TC, also causes an increase in the LDL fraction.
Fig. 6.
Dynamics of plasma LDL-cholesterol (closed squares) and total cholesterol (closed circles) after IM MPL along with their controls (open squares LDLC, open circles TC). The symbols depict the mean observed data±SD and the solid lines represent model fittings.
Table VI.
Dynamic Parameters for Plasma LDL-Cholesterol and Total Cholesterol
| Parameters | Definition | LDLC (CV%) |
TC (CV%) |
|---|---|---|---|
| ks,chol (mg dl−1 h−1) | Cholesterol synthesis rate | 18.2 | 14.5 |
| kd,chol (h−1) | Cholesterol loss rate constant | 0.51 (80.1) | 0.16 (42.3) |
| IC50,chol (fmol/g) | Half-maximal inhibition of kd,chol | 12.2 (55.3) | 23.2 (44.6) |
| LDLC0 or TC0 | Initial values | 35.8 (9.2) | 91.0 (3.4) |
Fig. 9.
Various atherogenic indices used to assess risks for atherosclerosis, the higher values of which indicate increased risks for atherosclerosis; (a) plasma LDLC to TC ratio; (b) plasma LDLC to HDLC ratio; and (c) plasma TC to HDLC ratio. The closed symbols represent the MPL treated group and the open symbols represent the control group.
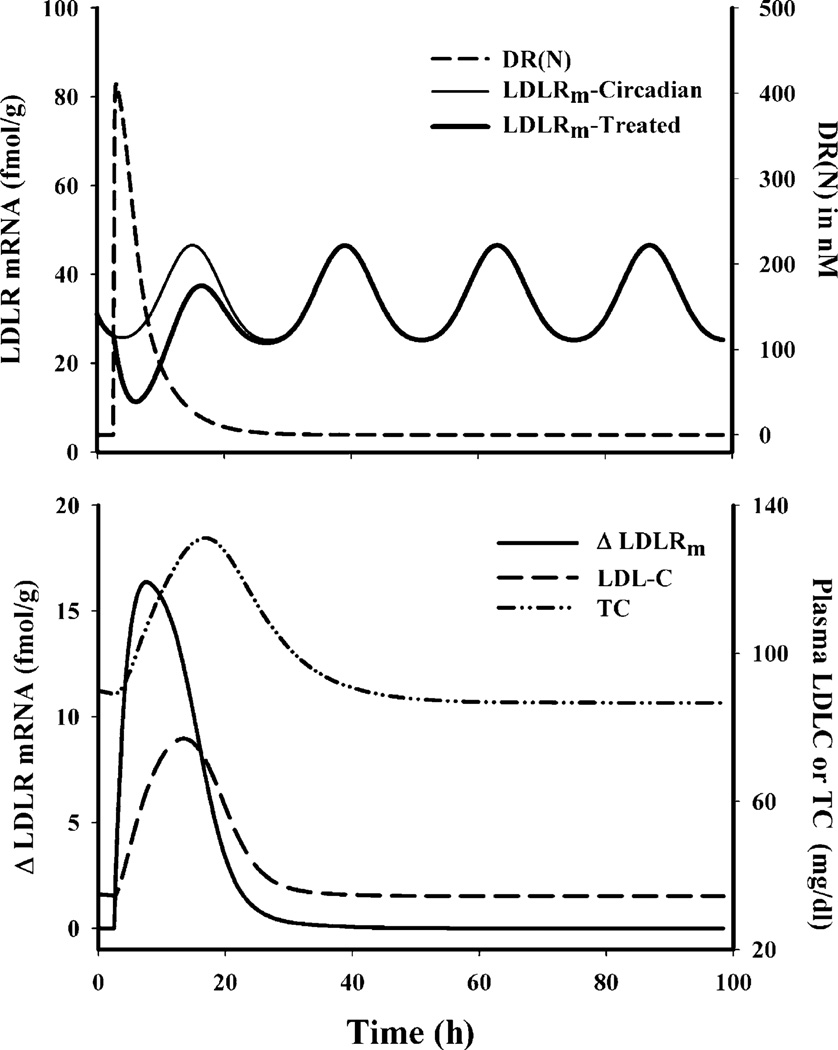
To aid in the understanding of CS regulation of LDR mRNA and its subsequent effect on plasma, we simulated the temporal profiles for various driving forces as well as the regulated dynamic markers using Eqs. 3–17 and the parameters given in Table II, III, IV, V and VI. Figure 7 (top panel) shows DR(N)-mediated transient down-regulation of LDLR mRNA from its circadian baseline, whereas Fig. 7 (bottom panel) depicts the driving force behind up-regulation of plasma cholesterol. These simulations provide quantitative understanding of why we did not observe a daily rhythm in plasma cholesterol even though steroids caused visible changes in LDLR mRNA.
Fig. 7.
Simulated profiles for various driving forces for regulation of various dynamic biomarkers. Top panel represents the regulation of LDLR mRNA by DR(N) and the bottom panel represents the regulation of plasma TC and LDLC by hepatic LDLR mRNA.
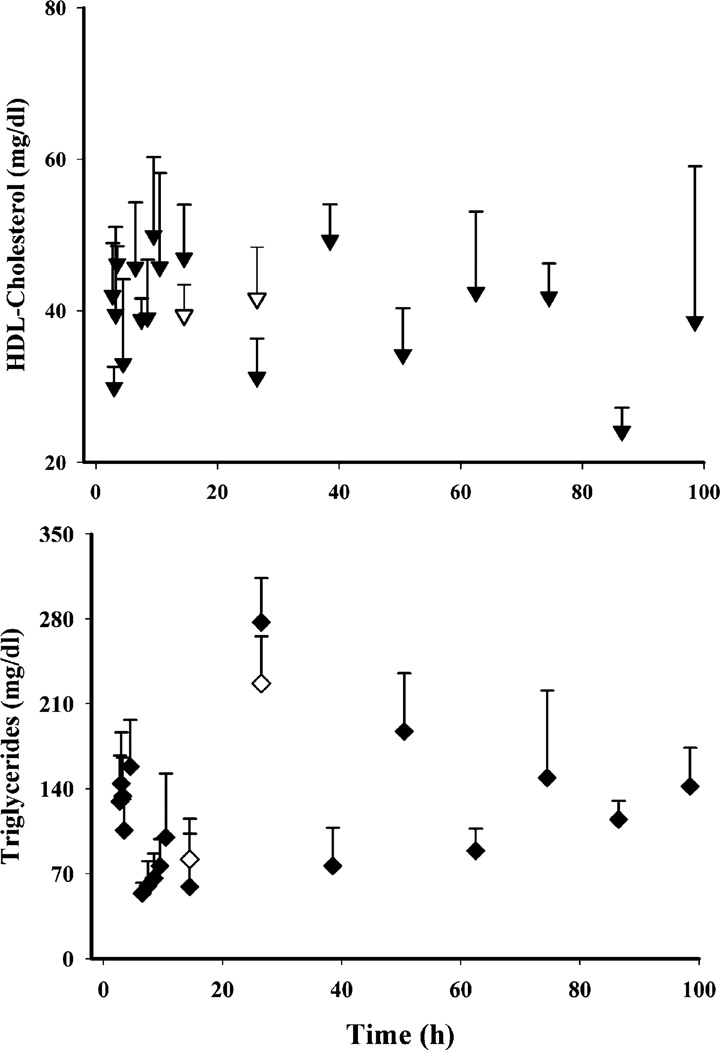
Of the four lipids monitored, only TG showed circadian variation (Fig. 4, bottom panel) with a peak at the early light cycle (190.2±31.8 mg/dl at 2 h circadian time) and a nadir during the dark cycle (63.0±52.4 mg/dl at 14 h circadian time). We observed apparently higher TG concentrations (Fig. 8, bottom panel) at 24 h in the MPL group (277.2±36.4 mg/dl at 2.5 h circadian time) when compared to the controls from the circadian rhythm study (190.2±31.8 mg/dl at 2 h circadian time). However, the difference was not statistically significant when the values from the MPL group were compared with the 24 h controls (226.7±38.9 mg/dl at 2.5 circadian time) from the present study. Plasma HDL (Fig. 8, top panel) showed neither circadian variation nor any effects of MPL. Besides the frequently used plasma atherogenic index given in Fig. 9c (33) calculated by the ratio of plasma TC to HDLC, we also examined the dynamics of plasma LDLC to HDLC (“bad” to “good” cholesterol) to obtain an understanding of CS-mediated adverse effects on plasma lipid profiles. A significantly higher LDLC/HDLC ratio was found in the treatment group at 12 h, but TC/HDLC ratios did not differ.
Fig. 8.
Dynamics of plasma total triglycerides (closed inverted triangles MPL treated; open inverted triangles controls) and HDLC (closed diamonds treated; open diamonds controls) concentrations.
DISCUSSION
Steroid-induced diabetes, hypertension, dyslipidemia, and atherosclerosis are complex phenomena involving altered expression of multiple genes in various tissues, and which are often inseparable from their beneficial effects. Although much effort has been devoted to understand the effects of steroids on these complex physiological and biochemical pathways, much is still unknown. In this report we employed PK/PD modeling to gain some quantitative understanding of CS receptor/gene-mediated effects on rat plasma lipids, especially those associated with increased risks for atherosclerosis.
Despite the fact that HDL (known as “good cholesterol”) is the major cholesterol carrying lipoprotein in rats whereas LDL (“bad cholesterol”) plays this role in humans (34), rats are a highly used animal model for lipoprotein metabolism. In studying CS effects, adrenalectomized rats are commonly used. Due to the absence of endogenous CST, such rats facilitate assessment of various pharmacodynamic/toxicodynamic factors affected by exogenous CS without confounding factors such as non-stationary baselines of biomarkers. Although the practical advantages in using this model are substantial, adrenalectomy may lead to undesirable physiological changes (35,36) especially when evaluating the inter-relationships between carbohydrate, protein, and lipid metabolism.
Hepatic LDL receptors play a pivotal role in maintaining cholesterol homeostasis in various species, and defects in the LDLR gene has been identified as one of the major causes of familial hypercholesterolemia (9). Although several in vitro systems using dexamethasone or hydrocortisone showed concentration-dependent inhibition of LDLR by CS at both mRNA and protein levels (8,10), little is known about in vivo effects of CS on these receptors. Due to technical challenges we were not able to measure either binding activity or proteins of LDLR in rat liver. However, development of a real-time QRT-PCR assay allowed us to quantify the message.
Hepatic LDLR mRNA showed an apparent circadian rhythm, the pattern of which closely resembled previously reported daily rhythm of LDLR activity (37). Contrary to reported inhibitory effects of exogenous steroids on LDLR, the peak of the plasma CST rhythm coincided with the LDLR mRNA peak. Therefore, similar to GR mRNA, CST was not considered as the major regulator of the homeostasis of LDLR mRNA. Despite this rhythm in LDLR mRNA, we did not observe any daily variation in either total or LDL cholesterol in plasma. One of the reasons could be the high inter-animal variability observed in the plasma cholesterol from the circadian study (data not shown) which may simply disguise any rhythm present. However, it is also possible that the turnover rates of these cholesterols may not be sensitive to the daily rhythm of LDLR. MPL caused a transient but significant down-regulation of LDLR mRNA. Our previous microarray study as well as our preliminary studies with ADX rats where animals were given 50 mg/kg MPL IV or IM (data not shown) showed much more prominent and prolonged down-regulation of LDLR mRNA, the exact mechanism of which remains unclear. However, it emphasizes our rationale for using normal rats, which may more closely mimic the true physiological situation. Our choice of CS-mediated inhibition of LDLR mRNA synthesis rate was empirical since we did not find any evidence of existence of a GRE in the LDLR gene. The similarity between GR and LDLR mRNA dynamics in terms of their regulation by MPL was noticeable. Both these genes were down-regulated by MPL and, more interestingly, they did not return to their regular rhythm within the course of the study. This was contrary to the dynamic regulation of the tyrosine aminotransferase gene (which contains a positive GRE in its promoter region). The expression of TAT mRNA was up-regulated by MPL but resumed its daily rhythm within 36 h (unpublished data) indicating the possibility of different molecular mechanism in CS-mediated stimulatory and inhibitory effects as reported previously (23).
Although an empirical attempt was made to capture the rebound phenomenon of GR mRNA dynamics (Fig. 3) using Eqs. 10–12, the mRNA values at 60 h could not be captured by any of the used models. An indirect response model was also used where TC2 mediated increase in elimination of GRm was omitted, however, this model was inferior to the current model used. Similarly, the down-regulation of LDLR mRNA was apparent, however, this down-regulation was quite transient (unlike GR mRNA) and therefore the return of the response could not be captured very well when the parameters of an indirect response model were allowed to be estimated. Although, simulations with higher kd,LDLR values than estimated were able to capture this transient down-regulation better, it was not able to capture the extent of this down-regulation. Models with similar components as used to describe GR mRNA were used to describe the subtle rebound phase in the LDLR mRNA dynamics, however, they performed inferior to the current model based on visual inspection and various model fitting criteria.
We observed a significant increase in plasma TC and LDLC in the MPL rats compared to their controls. The changes in LDLC were more than proportional to changes in TC, which was reflected by the increase in the LDLC/TC ratio (Fig. 9a) indicating other possible pathways of cholesterol removal. The HDLC, which constitutes a major part of total plasma cholesterol, is removed by a different pathway (hepatic scavenger receptors) than LDL receptors (38), which may partially contribute to this difference. We used CS-mediated changes in LDLR mRNA as the driving force for inhibition of plasma TC and LDLC removal. One of the major assumptions of our model was that the changes in LDLR mRNA would change LDLR protein expression, which is perhaps the key player in regulation of plasma LDLC removal. However, due to the lack of real protein data we used LDLR mRNA to drive the lipid dynamics. The calculated half-life (calculated from kd,TC) for plasma TC (4.35 h, 42.3 CV%) closely resembled reported values (4.58 h) for plasma cholesterol-ester in rats (39). The estimated loss rate constant for plasma LDLC (0.508, 80.1% CV) was higher when compared with combined in vitro fractional catabolism rate (FCR) for plasma LDL through receptor-dependent and independent pathways (40).
Evidence for the regulation of HDLC by CS is contradictory, with reports showing both up-regulation and down-regulation (6). Since HDLC is known as “good cholesterol” due to its protective effects on the development of atherosclerosis, increased concentrations of this lipid are thought to be beneficial (41). The concentrations of TG in naïve, untreated animals showed an obvious circadian rhythm, the exact regulation of which is unclear. One of the rate limiting enzymes for hepatic biosynthesis of TG is phosphatidate phosphohydrolase (PAP 2), which shows a circadian rhythm quite similar to TAT activity and is also known to be regulated by CS treatment (42). Besides possible regulation by PAP 2, these rats were fed ad libitum and therefore these circadian changes in TG may have been a result of their food intake. It has been reported that the CS effects on plasma TG could be ligand specific in that dexamethasone caused time-dependent increases in TG whereas equivalent doses of triamcinolone showed no such effects (6). In our MPL group the plasma TG at 24 h was significantly higher than in the control rats from the circadian study. However, due to lack of sampling points between 12 and 24 h, we were not able to determine whether this increase in TG was an effect of MPL.
In general, many parameters were associated with poor precision (>50% CV), which may raise the question of identifiability in estimating the model parameters. Although our model was based on CS mechanisms of action, identification of the model parameters based on information from one dose is challenging. To partially circumvent this issue, a piecewise fitting approach was taken. A model describing the PK of MPL was determined first, the parameters of which were subsequently fixed to determine receptor dynamics. Finally, the latter were fixed for fitting of the LDLR mRNA and lipid dynamics. Despite this approach, the imprecision around the estimated parameters could not be improved. This study was our first attempt to quantitatively understand and describe CS-mediated changes in adverse lipid profiles in rats and its potential link to reduced LDLR mRNA. Determination of these dynamics at more than one dose level and during multiple-dosing has the potential to improve certainty of model parameters. Although the PK/PD model proposed here is undoubtedly an over-simplification of an extremely complicated physiological/biochemical pathway and needs reinforcement for future application, this may be considered as the starting point for future investigation of CS regulation of these complex pathways.
Supplementary Material
ACKNOWLEDGEMENT
This study was supported by Grant no. GM 24211 from the National Institutes of Health.
ABBREVIATIONS
- ADX
adrenalectomized
- CS
corticosteroids
- CST
corticosterone
- DR
drug-receptor complex
- DR(N)
nuclear drug-receptor complex
- GR
glucocorticoid receptor
- HDLC
high-density lipoprotein cholesterol
- LDLC
low-density lipoprotein cholesterol
- LDLR
low-density lipoprotein receptors
- MPL
methylprednisolone
- PD
pharmacodynamics
- PK
pharmacokinetics
- RT-PCR
reverse transcription polymerase chain reaction
- TC
total cholesterol
- TG
triglycerides
REFERENCES
- 1.Schacke H, Docke WD, Asadullah K. Mechanisms involved in the side effects of glucocorticoids. Pharmacol. Ther. 2002;96:23–43. doi: 10.1016/s0163-7258(02)00297-8. [DOI] [PubMed] [Google Scholar]
- 2.Adlersberg D, Schaefer L, Drachman SR. Development of hypercholesteremia during cortisone and ACTH therapy. JAMA. 1950;144:909–914. doi: 10.1001/jama.1950.02920110021006. [DOI] [PubMed] [Google Scholar]
- 3.Blum RL. Computer-assisted design of studies using routine clinical data. Analyzing the association of prednisone and cholesterol. Ann Int Med. 1986;104:858–868. doi: 10.7326/0003-4819-104-6-858. [DOI] [PubMed] [Google Scholar]
- 4.Bagdade JD, Yee E, Albers J, Pykalisto OJ. Glucocorticoids and triglyceride transport: effects on triglyceride secretion rates, lipoprotein lipase, and plasma lipoproteins in the rat. Metab. Clin. Exp. 1976;25:533–542. doi: 10.1016/0026-0495(76)90007-x. [DOI] [PubMed] [Google Scholar]
- 5.Becker DM, Markakis M, Sension M, Vitalis S, Baughman K, Swank R, Kwiterovich PO, Pearson TA, Achuff SC, Baumgartner WA. Prevalence of hyperlipidemia in heart transplant recipients. Transplantation. 1987;44:323–325. doi: 10.1097/00007890-198708000-00030. [DOI] [PubMed] [Google Scholar]
- 6.Staels B, Tolvan A, Chan L, Verhoeven G, Auwerx J. Variable effects of different corticosteroids on plasma lipids, apolipoproteins, and hepatic apolipoprotein mRNA levels in rats. Arterioscler. Thromb. 1991;11:760–769. doi: 10.1161/01.atv.11.3.760. [DOI] [PubMed] [Google Scholar]
- 7.Bilheimer DW. Regulation of LDL receptors in vivo. Agents Actions. 1984;16(Suppl):191–203. doi: 10.1007/978-3-0348-7235-5_22. [DOI] [PubMed] [Google Scholar]
- 8.Salter AM, Fisher SC, Brindley DN. Binding of low-density lipoprotein to monolayer cultures of rat hepatocytes is increased by insulin and decreased by dexamethasone. FEBS Lett. 1987;220:159–162. doi: 10.1016/0014-5793(87)80895-5. [DOI] [PubMed] [Google Scholar]
- 9.Brown MS, Goldstein JL. A receptor-mediated pathway for cholesterol homeostasis. Science. 1986;232:34–47. doi: 10.1126/science.3513311. [DOI] [PubMed] [Google Scholar]
- 10.Al Rayyes O, Wallmark A, Floren CH. Additive inhibitory effect of hydrocortisone and cyclosporine on low-density lipoprotein receptor activity in cultured HepG2 cells. Hepatology. 1997;26:967–971. doi: 10.1002/hep.510260425. [DOI] [PubMed] [Google Scholar]
- 11.Almon RR, Chen J, Snyder G, Dubois DC, Jusko WJ, Hoffman EP. In vivo multi-tissue corticosteroid microarray time series available online at Public Expression Profile Resource (PEPR) Pharmacogenomics. 2003;4:791–799. doi: 10.1517/phgs.4.6.791.22816. [DOI] [PubMed] [Google Scholar]
- 12.Sun YN, DuBois DC, Almon RR, Jusko WJ. Fourth-generation model for corticosteroid pharmacodynamics: a model for methylprednisolone effects on receptor/gene-mediated glucocorticoid receptor down-regulation and tyrosine aminotransferase induction in rat liver. J. Pharmacokinet. Biopharm. 1998;26:289–317. doi: 10.1023/a:1023233409550. [DOI] [PubMed] [Google Scholar]
- 13.Sun YN, McKay LI, DuBois DC, Jusko WJ, Almon RR. Pharmacokinetic/pharmacodynamic models for corticosteroid receptor down-regulation and glutamine synthetase induction in rat skeletal muscle by a receptor/gene-mediated mechanism. J. Pharmacol. Exp. Ther. 1999;288:720–728. [PubMed] [Google Scholar]
- 14.Haughey DB, Jusko WJ. Analysis of methylprednisolone, methylprednisone and corticosterone for assessment of methylprednisolone disposition in the rat. J. Chromatogr. 1988;430:241–248. doi: 10.1016/s0378-4347(00)83159-x. [DOI] [PubMed] [Google Scholar]
- 15.DuBois DC, Almon RR, Jusko WJ. Molar quantification of specific messenger ribonucleic acid expression in northern hybridization using cRNA standards. Anal. Biochem. 1993;210:140–144. doi: 10.1006/abio.1993.1164. [DOI] [PubMed] [Google Scholar]
- 16.Hazra A, Jusko WJ, Almon RR, DuBois DC. Pharmacodynamics of circadian rhythm of corticosterone effects on tyrosine aminotransferase in normal rats. AAPS J. 2005;6:T3355. Abstract. [Google Scholar]
- 17.Yao Z, C Dubois D, Almon RR, Jusko WJ. Modeling circadian rhythms of glucocorticoid receptor and glutamine synthetase expression in rat skeletal muscle. Pharm. Res. 2006;23:670–679. doi: 10.1007/s11095-005-9608-3. [DOI] [PMC free article] [PubMed] [Google Scholar]
- 18.Hazra A, Pyszczynski NA, Dubois DC, Almon RR, Jusko WJ. Pharmacokinetics of methylprednisolone after intravenous and intramuscular administration in rats. Biopharm. Drug Dispos. 2007;28:263–273. doi: 10.1002/bdd.551. [DOI] [PMC free article] [PubMed] [Google Scholar]
- 19.Schaaf MJ, Cidlowski JA. Molecular mechanisms of glucocorticoid action and resistance. J. Steroid Biochem. Mol. Biol. 2002;83:37–48. doi: 10.1016/s0960-0760(02)00263-7. [DOI] [PubMed] [Google Scholar]
- 20.Hache RJ, Tse R, Reich T, Savory JG, Lefebvre YA. Nucleocytoplasmic trafficking of steroid-free glucocorticoid receptor. J. Biol. Chem. 1999;274:1432–1439. doi: 10.1074/jbc.274.3.1432. [DOI] [PubMed] [Google Scholar]
- 21.Htun H, Barsony J, Renyi I, Gould DL, Hager GL. Visualization of glucocorticoid receptor translocation and intranuclear organization in living cells with a green fluorescent protein chimera. Proc. Natl. Acad. Sci. U. S. A. 1996;93:4845–4850. doi: 10.1073/pnas.93.10.4845. [DOI] [PMC free article] [PubMed] [Google Scholar]
- 22.Oakley RH, Cidlowski JA. Homologous down regulation of the glucocorticoid receptor: the molecular machinery. Crit. Rev. Eukaryot. Gene Expr. 1993;3:63–88. [PubMed] [Google Scholar]
- 23.Beato M, Chalepakis G, Schauer M, Slater EP. DNA regulatory elements for steroid hormones. J. Steroid Biochem. 1989;32:737–747. doi: 10.1016/0022-4731(89)90521-9. [DOI] [PubMed] [Google Scholar]
- 24.Burnstein KL, Jewell CM, Cidlowski JA. Human glucocorticoid receptor cDNA contains sequences sufficient for receptor down-regulation. J. Biol. Chem. 1990;265:7284–7291. [PubMed] [Google Scholar]
- 25.Hazra A, Dubois DC, Almon RR, Jusko WJ. Assessing the dynamics of nuclear glucocoticoid-receptor complex: Adding flexibility to gene expression modeling. J. Pharmacokinet. Pharmacodyn. 2007;34:333–354. doi: 10.1007/s10928-007-9049-1. [DOI] [PMC free article] [PubMed] [Google Scholar]
- 26.Kong A-N, Jungbluth GL, Pasko MT, Beam TR, Jusko WJ. Pharmacokinetics of methylprednisolone sodium succinate and methylprednisolone in patients undergoing cardiopulmonary bypass. Pharmacotherapy. 1990;10:29–34. [PubMed] [Google Scholar]
- 27.Krzyzanski W, Chakraborty A, Jusko WJ. Algorithm for application of Fourier analysis for biorhythmic baselines of pharmacodynamic indirect response models. Chronobiol. Int. 2000;17:77–93. doi: 10.1081/cbi-100101034. [DOI] [PubMed] [Google Scholar]
- 28.Kovanen PT. Regulation of plasma cholesterol by hepatic low-density lipoprotein receptors. Am. Heart J. 1987;113:464–469. doi: 10.1016/0002-8703(87)90615-6. [DOI] [PubMed] [Google Scholar]
- 29.Antal EJ, Wright CE, 3rd, Gillespie WR, Albert KS. Influence of route of administration on the pharmacokinetics of methylprednisolone. J. Pharmacokinet. Biopharm. 1983;11:561–576. doi: 10.1007/BF01059057. [DOI] [PubMed] [Google Scholar]
- 30.Samtani MN, Jusko WJ. Comparison of dexamethasone pharmacokinetics in female rats after intravenous and intramuscular administration. Biopharm. Drug Dispos. 2005;26:85–91. doi: 10.1002/bdd.435. [DOI] [PMC free article] [PubMed] [Google Scholar]
- 31.Ramakrishnan R, DuBois DC, Almon RR, Pyszczynski NA, Jusko WJ. Fifth-generation model for corticosteroid pharmacodynamics: application to steady-state receptor down-regulation and enzyme induction patterns during seven-day continuous infusion of methylprednisolone in rats. J. Pharmacokinet. Pharmacodyn. 2002;29:1–24. doi: 10.1023/a:1015765201129. [DOI] [PMC free article] [PubMed] [Google Scholar]
- 32.Sun YN, DuBois DC, Almon RR, Pyszczynski NA, Jusko WJ. Dose-dependence and repeated-dose studies for receptor/gene-mediated pharmacodynamics of methylprednisolone on glucocorticoid receptor down-regulation and tyrosine aminotransferase induction in rat liver. J. Pharmacokinet. Biopharm. 1998;26:619–648. doi: 10.1023/a:1020746822634. [DOI] [PubMed] [Google Scholar]
- 33.Dobiasova M. [AIP—atherogenic index of plasma as a significant predictor of cardiovascular risk: from research to practice] Vnitrni Lekarstvi. 2006;52:64–71. [PubMed] [Google Scholar]
- 34.Vaskonen T, Mervaala E, Krogerus L, Karppanen H. Supplementation of plant sterols and minerals benefits obese Zucker rats fed an atherogenic diet. J. Nutr. 2002;132:231–237. doi: 10.1093/jn/132.2.231. [DOI] [PubMed] [Google Scholar]
- 35.Exton JH. Regulation of gluconeogenesis by glucocorticoids. Monogr. Endocrinol. 1979;12:535–546. doi: 10.1007/978-3-642-81265-1_28. [DOI] [PubMed] [Google Scholar]
- 36.Savontaus E, Conwell IM, Wardlaw SL. Effects of adrenalectomy on AGRP, POMC, NPY and CART gene expression in the basal hypothalamus of fed and fasted rats. Brain Res. 2002;958:130–138. doi: 10.1016/s0006-8993(02)03674-0. [DOI] [PubMed] [Google Scholar]
- 37.Balasubramaniam S, Szanto A, Roach PD. Circadian rhythm in hepatic low-density-lipoprotein (LDL)-receptor expression and plasma LDL levels. Biochem. J. 1994;298:39–43. doi: 10.1042/bj2980039. [DOI] [PMC free article] [PubMed] [Google Scholar]
- 38.Galman C, Angelin B, Rudling M. Prolonged stimulation of the adrenals by corticotropin suppresses hepatic low-density lipoprotein and high-density lipoprotein receptors and increases plasma cholesterol. Endocrinology. 2002;143:1809–1816. doi: 10.1210/endo.143.5.8816. [DOI] [PubMed] [Google Scholar]
- 39.Cabot C, Salas A, Ferrer-Lorente R, Savall P, Remesar X, Fernandez-Lopez JA, Esteve M, Alemany M. Short-term oral oleoyl-estrone treatment increases plasma cholesterol turnover in the rat. Int. J. Obes. (Lond) 2005;29:534–539. doi: 10.1038/sj.ijo.0802898. [DOI] [PubMed] [Google Scholar]
- 40.Carew TE, Pittman RC. Tissue sites of degradation of native DSteinberg and, reductively methylated [14C]sucrose-labeled low density lipoprotein in rats. Contribution of receptor-dependent and receptor-independent pathways. J. Biol. Chem. 1982;257:8001–8008. [PubMed] [Google Scholar]
- 41.Barter P, Kastelein J, Nunn A, Hobbs R. Future Forum Editorial Board High density lipoproteins (HDLs) and atherosclerosis; the unanswered questions. Atherosclerosis. 2003;168:195–211. doi: 10.1016/s0021-9150(03)00006-6. [DOI] [PubMed] [Google Scholar]
- 42.Jennings RJ, Lawson N, Fears R, Brindley DN. Stimulation of the activities of phosphatidate phosphohydrolase and tyrosine aminotransferase in rat hepatocytes by glucocorticoids. FEBS Lett. 1981;133:119–122. doi: 10.1016/0014-5793(81)80485-1. [DOI] [PubMed] [Google Scholar]
Associated Data
This section collects any data citations, data availability statements, or supplementary materials included in this article.


