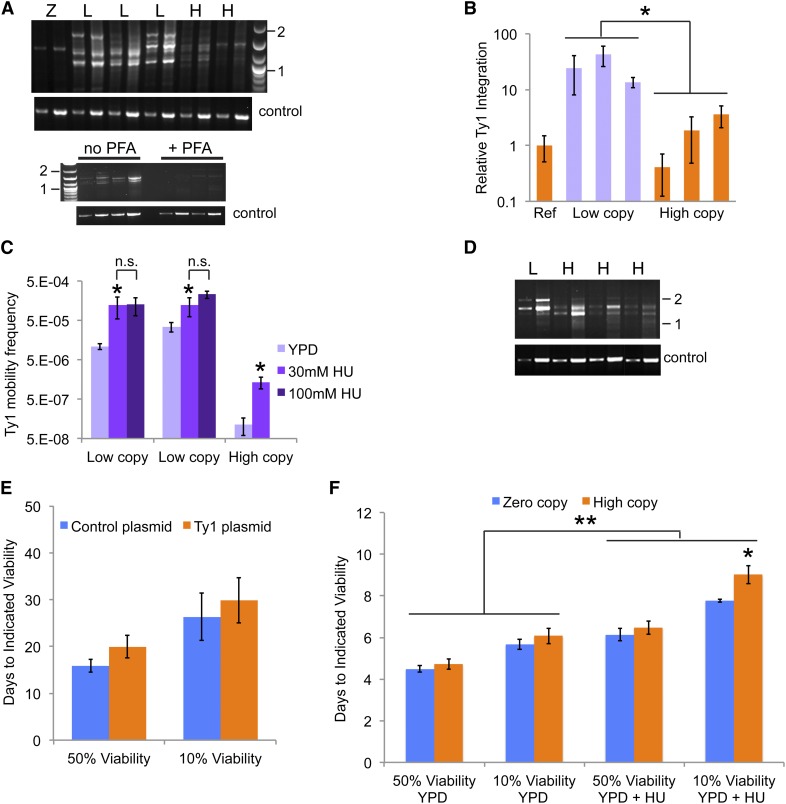
Figure 3.
Ty1 mobility is elevated in low Ty1 copy strains and in the presence of hydroxyurea. (A) Representative pairs of ethidium bromide-stained agarose gel images showing Ty1 integration PCR products (top panel of each pair) obtained after 31 and 34 cycles from the same template or single-copy gene control product obtained after 17 and 19 or 20 and 22 cycles from the same template (top “control” and bottom “control” images, respectively). Results in the upper pair of images are for the zero Ty1 copy parent strain, “Z,” three low Ty1 copy strains, “L,” and two high Ty1 copy strains, “H.” Results in the lower pair of images are for two low Ty1 copy strains grown in the absence, “no PFA,” or presence, “+ PFA,” of 200 µg/ml phosphonoformic acid to inhibit Ty1 reverse transcriptase. The positions of 1 kbp and 2 kbp markers are indicated (“1” and “2”). (B) A comparison of the relative yield of Ty1 integration PCR products from two to three independent trials using a reference high Ty1 copy strain, “Ref,” three low Ty1 copy strains, “low copy,” and three additional high Ty1 copy strains, “high copy.” Columns indicate mean ± SD. *P < 0.05 for the means of low vs. high Ty1 copy strains. (C) Frequencies of forming His+ prototrophs as a measure of Ty1 mobility in two low Ty1 copy, “low copy,” and one high Ty1 copy, “high copy,” strains harboring a chromosomal Ty1his3AI element grown in the absence, “YPD,” or presence of two different concentrations of hydroxyurea, “30 mM HU” and “100 mM HU.” Columns indicate mean ± SD for three trials per strain per condition, *P < 0.05 and n.s., no significant difference. (D) Representative results of Ty1 integration PCR following growth of cells in YPD medium with 30 mM HU, as described for A, and control product was obtained after 20 and 22 cycles of PCR. (E) The median and maximum lifespans for zero-copy Ty1 strains harboring a control plasmid (blue columns) or a Ty1 plasmid (orange columns) grown in YPD + 30 mM hydroxyurea + 200 µg/ml G418 are shown as the mean ± SD of three trials. (F) Median, “50% viability,” and maximum, “10% viability,” lifespans for zero Ty1 copy (blue columns) and high Ty1 copy (orange columns) strains grown at 30° in YPD medium without or with 30 mM hydroxyurea, “YPD” or “YPD + HU,” respectively. Data are mean ± SD from three trials for the zero-copy strain and four trials for the high-copy strains. *P < 0.05 for maximum lifespans of zero compared to high Ty1 copy strains in YPD + HU, and **P < 0.01 for lifespans in YPD compared to those in YPD + HU.

