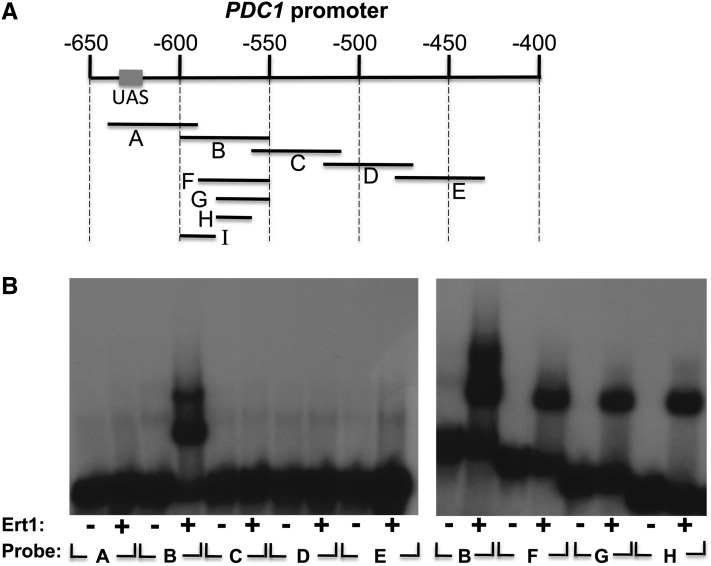
Figure 6.
Ert1 binds to the PDC1 promoter. (A) Schematic view of the PDC1 promoter. Coordinates (in base pairs) are given relative to the ATG (+1 bp). The upstream activating sequence (UAS) (Butler and McConnell 1988) is shown as a rectangle. Probes used for EMSA are shown as black lines. (B) Various probes were incubated (+) or not (−) with the purified DNA binding domain of Ert1 for EMSA analysis. Probe I was tested in Figure 7.

