To the editor:
Cancer is a heterogeneous disease, and molecular profiling of tumors from large cohorts has enabled characterization of new tumor subtypes. This is a prerequisite for improving personalized treatment and ultimately better patient outcomes. Potential tumor subtypes can be identified with methods such as unsupervised clustering1 or network-based stratification2, which assign patients to sets based on high-dimensional molecular profiles. Detailed characterization of identified sets and their interpretation, however, remain a time-consuming exploratory process.
To address these challenges, we combine ‘StratomeX’3, an interactive visualization tool, freely available at http://www.caleydo.org, with exploration tools to efficiently compare multiple patient stratifications, to correlate patient sets with clinical information or genomic alterations, and to view the differences between molecular profiles across patient sets. Although we focus on cancer genomics here, StratomeX can also be applied in other disease cohorts.
Thousands of patient stratifications can be derived from large cancer genomics datasets. This space of patient stratifications—which we call the ‘stratome’—contains stratifications based on, for example, clustering of mRNA, microRNA, or protein expression matrices; the mutation or copy number status of genes; or on clinical variables. Due to the size of the stratome and the heterogeneity of the underlying datasets, integration of computational and visual approaches is indispensable to the analyst in identifying biologically or clinically meaningful stratifications, as well as clinical parameters and pathways that together provide a comprehensive view of each patient set.
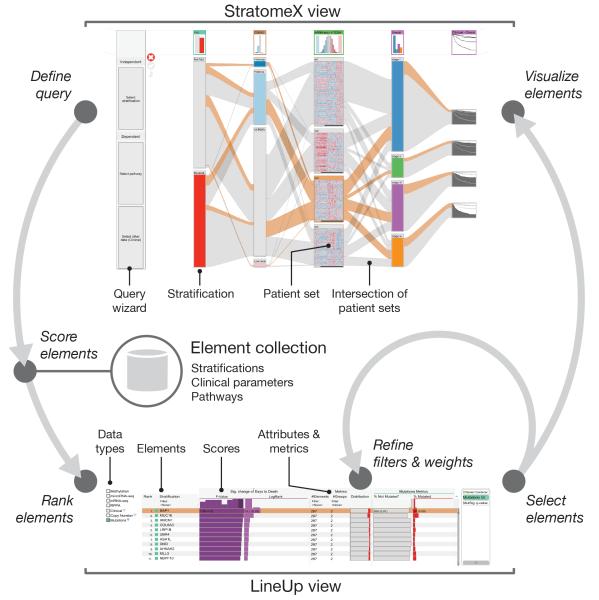
StratomeX complements the network viewers, heat maps, and genome browsers typically used in cancer genomics4 (Supplementary Discussion and Supplementary Table 1). To visualize the relationships between multiple patient stratifications as well as other data (Fig. 1 and Supplementary Fig. 1), stratifications are represented as columns of stacked blocks where each block corresponds to a patient set. Blocks contain visualizations of the data associated with those patients, such as heat maps, pathway maps overlaid with expression data, or survival plots (Supplementary Fig. 2). Bands connecting the blocks show the pairwise overlap of sets in adjacent stratifications, with the width of the bands representing the size of the overlap relative to the size of the patient sets (Supplementary Fig. 3). This visualization is an efficient tool to confirm hypotheses about gene functions or subtypes defined by molecular profiles.
Figure 1. Seamless integration of visual and computational components in the extended StratomeX tool.
In the StratomeX view (top) columns represent different stratifications, each divided into patient sets, and the bands between the columns show the patients that are shared between the subsets. The wider the bands, the higher the correlation between patient subsets. Orange bands indicate selected patients. The results of queries are lists of elements ranked by a score, which are shown in the LineUp view (bottom). Elements selected in the LineUp view are immediately visualized in the StratomeX view, enabling analysts to rapidly explore the results of queries.
StratomeX also integrates a computational framework for query-based guided exploration of the stratome directly into the visualization (Fig. 1), enabling discovery of novel relationships between patient sets and efficient generation and refinement of hypotheses about tumor subtypes. A ‘query wizard’ provides step-by-step instructions (Supplementary Fig. 1 and 4) for defining queries, and a range of computational methods are used to generate rankings (Supplementary Methods). Queries score stratifications, for example, based on their overlap with a particular patient set, or based on their overall similarity to a selected stratification. Furthermore, the analyst can query the collection for stratifications that contain patient sets that exhibit differences in survival or differential regulation of pathways. We use ‘LineUp’5, a multi-attribute ranking technique, to visualize the results of these queries and to show which stratifications or pathways score high (Fig. 1 and Supplementary Fig. 5). The tight integration between the StratomeX and LineUp views, as well as the dynamic computation of scores, is essential for rapid identification of meaningful relationships between stratifications, clinical parameters, and pathways.
We demonstrate the effectiveness of StratomeX in a case study (Supplementary Note, Supplementary Figs. 6-18, Supplementary Tables 2 and 3, and Supplementary Video 1) in which we explored molecular and clinical data to characterize tumor subtypes in a cohort of over 400 clear cell renal cell carcinoma cases reported by The Cancer Genome Atlas consortium6.
Supplementary Material
Acknowledgements
This work was supported by the National Institutes of Health (U24 CA144025, U24 CA143845 and K99 HG007583), the Austrian Science Fund (J 3437-N15, P 22902), and the Air Force Research Laboratory and DARPA grant FA8750-12-C-0300.
Footnotes
Competing Financial Interests: The authors declare no competing financial interests.
References
- 1.Verhaak R, et al. Cancer Cell. 2010;17:98–110. doi: 10.1016/j.ccr.2009.12.020. [DOI] [PMC free article] [PubMed] [Google Scholar]
- 2.Hofree M, Shen JP, Carter H, Gross A, Ideker T. Nat. Methods. 2013;10:1108–1115. doi: 10.1038/nmeth.2651. [DOI] [PMC free article] [PubMed] [Google Scholar]
- 3.Lex A, et al. Computer Graphics Forum. 2012;31:1175–1184. doi: 10.1111/j.1467-8659.2012.03110.x. [DOI] [PMC free article] [PubMed] [Google Scholar]
- 4.Schroeder MP, Gonzalez-Perez A, Lopez-Bigas N. Genome Med. 2013;5:9. doi: 10.1186/gm413. [DOI] [PMC free article] [PubMed] [Google Scholar]
- 5.Gratzl S, Lex A, Gehlenborg N, Pfister HP, Streit M. IEEE Trans. Visualization Computer Graphics. 2013;19:2277–2286. doi: 10.1109/TVCG.2013.173. [DOI] [PMC free article] [PubMed] [Google Scholar]
- 6.The Cancer Genome Atlas Research Network. Nature. 2013;499:43–49. [Google Scholar]
Associated Data
This section collects any data citations, data availability statements, or supplementary materials included in this article.


