

Abstract
Objective
Deficits in cognitive flexibility and response inhibition have been linked to perturbations in cortico-striatal-thalamic circuitry in adult obsessive-compulsive disorder (OCD). Although similar cognitive deficits have been identified in pediatric OCD, few neuroimaging studies have been conducted to examine its neural correlates in the developing brain. In this study, we tested hypotheses regarding group differences in the behavioral and neural correlates of cognitive flexibility in a pediatric OCD and a healthy comparison (HC) sample.
Method
In this functional magnetic resonance imaging (fMRI) study, a pediatric sample of 10- to 17-year-old subjects, 15 with OCD and 20 HC, completed a set-shifting task. The task, requiring an extradimensional shift to identify a target, examines cognitive flexibility. Within each block, the dimension (color or shape) that identified the target either alternated (i.e., mixed) or remained unchanged (i.e., repeated).
Results
Compared with the HC group, the OCD group tended to be slower to respond to trials within mixed blocks. Compared with the HC group, the OCD group exhibited less left inferior frontal gyrus/BA47 activation in the set-shifting contrast (i.e., HC > OCD, mixed versus repeated); only the HC group exhibited significant activation in this region. The correlation between set shifting-induced right caudate activation and shift cost (i.e., reaction time differential in response to mixed versus repeated trials) was significantly different between HC and OCD groups, in that we found a positive correlation in HC and a negative correlation in OCD.
Conclusions
In pediatric OCD, less fronto-striatal activation may explain previously identified deficits in shifting cognitive sets.
Keywords: anxiety, set-shifting, fMRI, inferior frontal gyrus, striatum
According to the DSM-IV, both adult and pediatric obsessive-compulsive disorder (OCD) are characterized by repetitive intrusive thoughts and compulsive behaviors,1 symptoms that may arise from the inability to shift cognitive sets or to inhibit repetitive behaviors. In other words, individuals with OCD may have difficulty abandoning a particular cognitive state or behavioral pattern, causing marked distress and impairment. Numerous studies demonstrate that adults with OCD have deficits in cognitive flexibility and response inhibition. For example, adults with OCD perform significantly worse than healthy controls on the Wisconsin Card Sort (WCST),2-4 reversal learning,5 task-switching,6 set-shifting,3,7-9 and response inhibition tasks.10-12 Although these deficits in cognitive flexibility have been linked to less frontal-striatal activity in adult OCD,5,6,13,14 few behavioral and imaging studies have been conducted in pediatric OCD samples. The few extant reports in pediatric OCD are consistent with findings in studies of adult OCD. In behavioral studies, compared with healthy pediatric controls, children and adolescents with OCD had more perseverative errors on the WCST15 and more response inhibition errors during an antisaccade task.16 In neuroimaging studies, compared with healthy boys, boys with OCD showed less inferior frontal cortex activation during task switching17 as well as less caudate and orbitofrontal cortex (OFC) activation in response to successful inhibition during a stop/signal task.18 The task-switching paradigms involve shifting both cognitive tasks and motor response mappings; therefore, additional neuroimaging studies in pediatric OCD are needed to investigate neural correlates of cognitive flexibility isolating deficits during cognitive from motor shifts.
In this study, we used a set-shifting task19 to test hypotheses regarding group differences in the behavioral and neural correlates of cognitive flexibility. To this end, we examined the ability to shift attention between stimulus dimensions (i.e., color and shape) in healthy and OCD-affected pediatric samples during functional magnetic resonance imaging (fMRI) acquisition. Based on previous literature,6,17,18 we hypothesized that youth with OCD would have impaired performance evidenced by lower accuracy rates or slower reaction times when shifting between cognitive sets and abnormal orbitofrontal/inferior frontal gyrus and striatal activation during this set-shifting task.
Method
Participants
Using advertisements at local outpatient OCD clinics and in the community, individuals 10 to 17 years old were recruited to participate in this neuroimaging experiment as paid volunteers. All participants were English speaking, had normal or corrected-to-normal vision, and denied current or past history of head injury, learning disability, medical illness, and substance abuse/dependence. Before enrollment, written informed consent was obtained from a parent/legal guardian and written informed assent was obtained from the child/adolescent participant. All study procedures were performed in accordance with the Human Research Committees at McLean Hospital and Partners Healthcare System.
The Kiddie Schedule for Affective Disorders and Schizophrenia (KSADS-PL) was administered to all participants and their parents.20 All individuals included in the healthy comparison (HC) group were free of any past or current Axis I psychiatric disorder and psychotropic medications. Individuals included in the OCD group met DSM-IV criteria for this disorder.1 For feasibility and ethical reasons, entry criteria for the OCD group allowed comorbid disorders, as well as use of specified psychotropic medications (e.g., serotonin reuptake inhibitors, antidepressants, mood stabilizers) at the time of scanning; however, neuroleptic (e.g., traditional and atypical antipsychotic) medications were exclusionary. For all participants, symptom severity was measured using the Child Yale-Brown Obsessive Compulsive Scale (CY-BOCS), Child Depression Inventory (CDI), Spielberger State-Trait Inventory-Child Version (STAIC), and the Yale Global Tic Severity Scale (YGTSS).21-25
The final study sample included 15 individuals with OCD and 20 HC subjects, matched for age, gender, and handedness. This final sample was obtained after data from participants were excluded for poor behavioral response (four OCD, one HC) and technical problems (one HC). None of the subjects were excluded for excessive head movement (3-mm translational movement or 1.5° rotation in any direction). The OCD group endorsed the following current symptoms, based on the CYBOCS, within previously identified symptom dimensions: aggression, sexual, religious, somatic obsessions/checking (n = 9), symmetry/ordering/repeating (n = 8), contamination/washing (n = 7), and hoarding (n = 3).26,27 The individual symptom subtype totals exceed the number of subjects in the OCD sample because several individuals endorsed multiple symptoms spanning the different subtypes. The following comorbid illnesses were present in the OCD group: generalized anxiety disorder (n = 2), simple phobia (n = 2), agoraphobia (n = 1), major depression (n = 2), depression-NOS (n = 1), Tourette's disorder (n = 1), and attention-deficit/hyperactivity disorder (n = 2). The primary medications taken by OCD subjects were selective serotonin reuptake inhibitors (n = 12) and tricyclic antidepressants (n = 3). In addition, several individuals were taking secondary medications, including the following: mood stabilizers (n = 3), stimulants (n = 4), desyrel (n = 1), clonidine (n = 1), memantine (n = 1), atomoxetine (n = 1), and lorazepam (n = 1). Group characteristics are outlined in Table 1.
Table 1. Group Characteristics.
| Characteristic | OCD Group | HC Group |
|---|---|---|
| Number | 15 (9 males) | 20 (13 males) |
| Age (years) | 13.5 ± 2.4 | 13.6 ± 2.4 |
| Handedness | 13 R, 2 L | 18 R, 2 L |
| Duration of illness (years) | 4.1 ± 2.0 | NA |
| CYBOCS, total | 15.4 ± 5.7,*; range 7-26 | 0 |
| CYBOCS, obsessions | 6.6 ± 3.9* | 0 |
| CYBOCS, compulsions | 8.8 ± 2.9* | 0 |
| CDI | 8.8 ± 5.5* | 3.1 ± 3.7 |
| STAIC—trait | 36.2 ± 7.5* | 28.9 ± 7.5 |
| STAIC—state | 32.5 ± 4.7* | 28.0 ± 2.9 |
| YGTSS | 1.7 ± 4.8 | 0 |
Note: Data are summarized using mean ± standard deviation. CDI = Child Depression Inventory; CYBOCS = Child Yale-Brown Obsessive Compulsive Scale; HC = healthy comparison; L = left; OCD = obsessive-compulsive sorder R = right; STAIC = Spielberger State-Trait Inventory-Child Version; YGTSS = Yale Global Tic Severity Scale.
Significant group difference, p < .05.
Set-Shifting Task Procedure
During scanning, participants viewed a stimulus display that consisted of three objects presented on a black background.19 One of the three objects differed from the other two objects in either shape (e.g., square or circle) or color (e.g., gray or white) (Figure 1). With their right hand, participants were instructed to press the button mapped to the location of the unique object. The index, middle, and ring fingers were used to signal, via button press, that the left, the middle, or the right object was unique. Participants were not told that either of two attributes (color or shape) could identify the unique object; therefore, the subjects had to learn the two rules to select the unique object.
Figure 1.
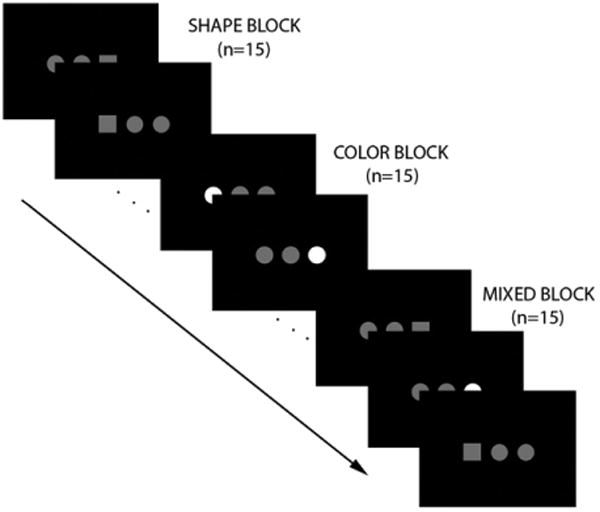
Set-shifting paradigm. Note: On each trial, three objects were presented for 500 ms with a 1500 ms interstimulus interval. One object had a unique attribute, either shape (square or circle) or color (gray or white). Subjects indicated the location of the unique object via button press. Unbeknownst to the subject, trials were presented in a blocked fashion, with 15 trials per block. In shape blocks, shape identified the unique object. In color blocks, color identified the unique object. In mixed blocks, the unique attribute alternated between shape and color.
Two runs of the set-shifting task were completed. Trials were presented in a block design. In mixed (M) blocks, the identifying attribute on successive trials alternated between shape and color. In repeated blocks, the identifying attribute, either shape (S) or color (C), was consistent across the entire block. Each run was flanked by blocks of low-level fixation (+) to serve as baseline. Each of the four block types (fixation, shape, color, and mixed) was presented a total of four times during the experiment. The order of blocks for each run was as follows: Run 1: +SCMMCS+, Run 2: +CSMMSC +. Each 30-s block consisted of 15 trials of 2-s duration. For each trial, the stimulus display was presented for 500 ms, with a 1500 ms interstimulus interval.
Apparatus
Using a Dell Inspiron 6000 laptop computer with Intel Pentium M Processor 750 (1.86 GHz/2MB Cache/533 MHz FSB) and standardized software (E-Prime, Inc, 1.1), stimuli were projected via a Sharp XG-2000V color LCD projector (Osaka, Japan). E-Prime recorded responses from a fiber optic response straight-button box device (Current Designs, Philadelphia, PA).
Magnetic resonance images were collected with an eight-channel gradient head coil and a Siemens Trio 3.0T Syngo MR 2004A whole-body, high-speed imaging device equipped for echo planar imaging (EPI) (Siemens Medical Systems, Iselin, NJ). Mirrors attached to the head coil allowed the subjects to view the rear-projection screen.
fMRI Data Acquisition
An automated scout image of each individual's brain was acquired, and to optimize field homogeneity, localized shimming procedures were performed. For spatial normalization purposes, high resolution 3D MPRAGE sequences (TR/TE/flip angle: 2,530 ms/3.39 ms/7°, 1.3 × 1.0-mm in-plane resolution, and 1.33-mm slice thickness) were collected. To assist in registration of the functional data to the high-resolution anatomical scan, a T1-EPI (TR/TE = 10 s/34 ms) sequence was gathered. Before each functional scan, 3 to 5 s of acquisition were discarded to allow longitudinal magnetization to reach equilibrium. fMRI images were acquired using a gradient echo T2*-weighted sequence (TR/TE/flip angle/field of view: 2 s/30 ms/90°/200 mm; orientation: 25 axial slices angled approximating the AC-PC line; slice thickness: 5 mm with no inter-slice skip; voxel size: 3.125 × 3.125 × 5 mm, interleaved excitation order and anterior-to-posterior phase encoding). Two functional runs were completed, yielding 110 acquisition volumes per run.
Data Analysis
Behavioral Data
Online behavioral data (accuracy and reaction time to correct trials) were analyzed using a 2 (group: OCD, HC) × 3 (condition: mixed, shape, color) repeated-measures analysis of variance in SPSS 16.0 (SPSS Inc., Chicago, IL). In a separate model, learning was assessed using block number as an additional within-subject factor. Statistical significance was determined using an alpha level of 0.05. Post hoc analyses using two-tailed t tests and multiple comparison corrections were performed where indicated.
fMRI Data
In SPM5, preprocessing and image analysis were completed.28 Functional images were realigned to the mean image using six-parameter, rigid-body spatial registration. In addition, an unwarping procedure was performed to remove any EPI motion-related susceptibility. For each individual, the anatomical MPRAGE image was co-registered to the mean functional image. The anatomical image was segmented into gray matter, white matter, and cerebrospinal fluid and was normalized to the SPM5 MNI T1 2×2×2 template. The normalization parameters were applied to the functional images. Finally, the functional images were spatially smoothed with a 6-mm full-width, half-maximum Gaussian filter.
A general linear model was created for each individual. The data were modeled using the onsets of conditions of interest (mixed, shape, color and fixation) convolved with the canonical HRF. A high-pass filter with 128-s cut-off was used to eliminate low-frequency drift, and AR1 correction was used to remove any temporal autocorrelation. To isolate within-brain voxels, the SPM masking threshold was reduced and an explicit mask representing the combined gray and white matter volume was included. A series of estimated betas, one for each regressor, was generated to minimize the error term within the model. Contrasts were generated by comparing the beta weights associated with blood oxygenated level dependent (BOLD) activations in response to mixed relative to the repeated conditions (i.e., set-shifting) across all runs.
A whole-brain, voxel-wise analysis was conducted using random-effects analysis. Contrast images from the individual analyses were entered into a second-level model. Two-sample t tests were conducted to determine significant group × condition interaction effects. Based on previous literature on task-switching, set-shifting, and implicit learning tasks,6,19,29,30 we examined group interaction effects in the frontal cortical (OFC, inferior frontal gyrus), striatal, and hippocampal regions, as a priori regions of interest (ROIs). Statistical significance was based on both a peak threshold and a spatial extent threshold that corrects for multiple comparisons to a level of p < .05. The spatial extent was determined using the AlphaSim program in AFNI, which corrects for multiple comparisons within anatomically defined ROIs using 1,000 Monte Carlo simulations and smoothness of 10 mm.31 We used anatomical ROIs from the Anatomical Automatic Labeling (AAL) within SPM, which were converted to AFNI format. At a peak threshold of p < .001, an eight-voxel cluster size in the inferior frontal gyrus were required, and at a peak threshold of p < .005, a 16-voxel cluster size in the caudate, a 19-voxel cluster size in the putamen, and a 7-voxel cluster size in the anterior hippocampus were needed. For completeness, we examined additional regions connected to the striatum, namely, the dorsolateral prefrontal cortex and anterior cingulate cortex (ACC), using similar thresholds as well as additional regions using a family-wise error (FWE)-corrected threshold of p < .05. Brain regions were identified by visual inspection and cross-referenced with a Talairach atlas.32 MNI coordinates are reported throughout the Results section.
In a secondary analysis, we tested group differences in how brain activation profiles varied with shift cost (i.e., the reaction time differential between mixed and repeated conditions). To do this, we included regressors for group and shift cost for each group and tested the interaction (i.e., group difference in correlations between the shift cost and activation for the mixed versus repeated contrast) using a whole-brain analysis approach.
To decompose the interactions and to determine whether the activation patterns were correlated with shift cost, symptom severity, or age, one-sample t tests and analysis of covariance models in each group were examined using whole-brain analysis with similar thresholds. In addition, MarsBar was used to define each functional ROI and to extract percent signal change values relative to the mean BOLD signal within functional and anatomical ROIs.33 The percent signal change values relative to fixation were calculated to determine the activation, deactivation, and correlation patterns in each contrast.
To investigate whether these group differences in functional activation were a result of structural differences, two structural analyses were conducted. An automated segmentation method generated measures of gray matter, white matter, and CSF.34 Each dependent measure of structure, group, and intracranial volume were included in regression analysis models in SPSS and significant group effects, independent of intracranial volume, were determined using an alpha value of 0.05. A voxel-based morphometry analysis assessed group differences in gray matter density at the whole-brain level in SPM. Segmented gray matter images from each individual were smoothed with an 8-mm full-width, half-maximum filter and included in a second-level group analysis. Intracranial volumes of each individual were included in the model as a regressor of noninterest. Significant differences in gray matter density were determined using an uncorrected threshold of p < .001.
Results
Behavioral Data
The accuracy rates during the color block (OCD: 88.7% ± 9.4%, HC: 89.8% ± 9.6%) were lower than the shape (OCD: 91.8% ± 6.1%, HC: 92.9% ± 7.9%) and mixed blocks (OCD: 93.7% ± 5.3%, HC: 93.9% ± 5.9%) [condition effect: F(2, 66) = 12.1, p < .001]. No group or group × condition interactions were noted (all p > .7). To investigate the condition effect, the accuracy rates for each block within the run were calculated. The accuracy rates for the first block of the shape and color, but not the mixed blocks [block × condition effect: F(6, 198) = 3.0, p < .03] were significantly lower than the accuracy rates for subsequent blocks [block effect: [F(3, 99) = 22.2, p < .001].
No significant main effects or group × condition interactions for reaction time on correct trials were noted (all p > .2). Therefore, the reaction times to the shape and color conditions were collapsed into a repeated condition analysis. The reaction times during repeated trials were similar between the groups (OCD: 622.4 ± 143.6 ms, HC: 622.3 ± 149.0 ms); however, compared with the HC group, the OCD group tended to have slower reaction times during mixed trials (OCD: 638.1 ± 162.1 ms, HC: 616.6 ± 152.0 ms) [condition × group effect: F(1, 33) = 3.6, p < .07], indicating a greater shift cost in the OCD group. Age did not correlate with switch cost in either group (p > .7) or the group as a whole (p > .9).
When CDI depression scores were included as a covariate, the reported results remained significant.
Imaging Data
Between-Group Comparisons
Compared with the HC group, the OCD group exhibited less left inferior frontal gyrus/BA47 [(−38, 32, −4), Z = 4.05, k = 31)] activation in the set-shifting contrast (i.e., HC > OCD, mixed versus repeated); an activation was found in the HC group [(−36, 32, −4), Z = 3.40, k = 8], whereas for the OCD group, at a lower threshold (uncorrected p < .005), a deactivation (i.e., repeated > mixed [−40, 30, −6), Z = 2.96, k = 13]) was noted (Figures 2A, B). This significant group difference remained after covarying out the effects of shift cost, age and CDI depression scores.
Figure 2.
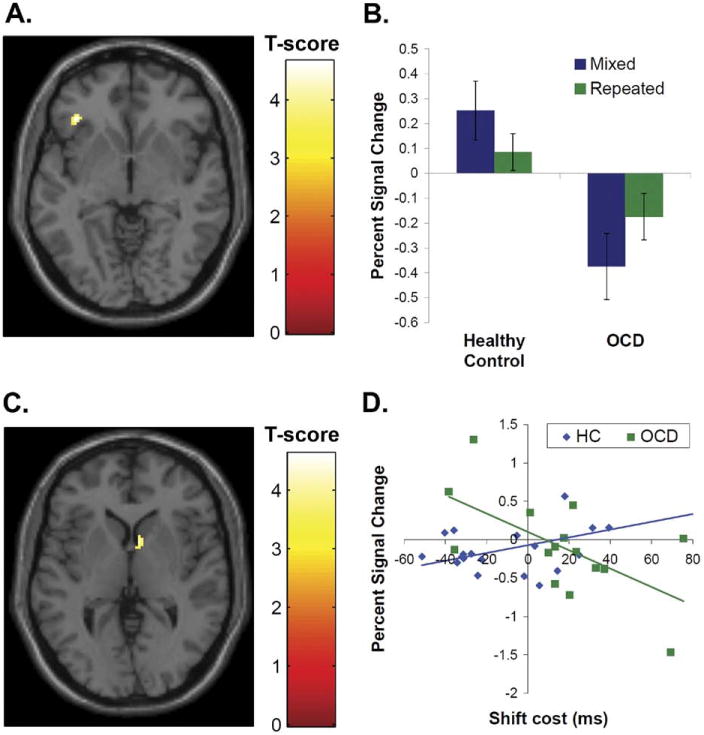
Group differences in frontal activation and correlations between shift cost and caudate activation during set-shifting. Note: (A) The left inferior frontal gyrus activation in response to mixed versus single conditions was lower in the obsessive-compulsive disorder (OCD) group compared with the healthy comparison (HC) group. The group difference in activation [(−38, 32, −4), Z = 4.09, k = 31]is displayed with a peak threshold of p < .001. (B) Percent signal change values were extracted from the group difference in left inferior frontal gyrus activation for the mixed and repeated conditions relative to fixation and plotted. (C) The correlation between activation and the shift cost (i.e., the reaction time differential between mixed versus repeated conditions) showed a group difference in the right caudate [(8, 8, 2), Z = 3.58, k = 46]. The group difference in correlation is displayed with a peak threshold of p < .001. (D) Percent signal change values were extracted from the group difference in correlation found in the right caudate and plotted against shift cost for each group. The HC group showed a positive correlation (Pearson's r = 0.53, p < .02), and the OCD group showed a negative correlation (Pearson's r = −0.61, p < .02) between percent signal change in the caudate and shift cost.
Of note, no significant between-group differences in striatal or hippocampal activation (e.g., mixed versus repeated) were detected using either whole-brain analysis or anatomically defined ROI analysis (p > .6). Group differences were not detected in the dorsolateral prefrontal cortex and ACC at our a priori significance threshold or any additional region at the FWE-corrected threshold.
Neural Correlates of Shift Cost
A significant group difference in correlation between shift cost and activation in response to mixed versus repeated conditions was detected in the right caudate [(8, 8, 2), Z = 3.58, k = 46]. The HC group showed a positive correlation (Pearson's r = 0.53, p < .02) and the OCD group showed a negative correlation (Pearson's r = 0.61, p < .02) between shift cost and percent signal change values in this region. In other words, as the shift cost increased, the right caudate activation increased in the HC group and decreased in the OCD group (Figures 2C, D).
We also examined associations between shift cost and activation in the inferior frontal gyrus, where we had found a between-group difference in activation during the mixed versus repeated contrast. No significant correlations in either group and no significant group differences in correlation between shift cost and activation in either the left or right inferior frontal gyrus were found.
Functional Connectivity
Extracted values of percent signal change in the inferior frontal gyrus and caudate ROIs, identified by the group differences in activation and correlation with shift cost respectively, were positively correlated in the HC group only (HC: Pearson's r = 0.50, p < .03; OCD: p > .28).
Symptom Severity
In the OCD group, the total CY-BOCS score was not significantly correlated with mixed versus repeated activation in the inferior frontal gyrus or caudate, two regions showing between-group differences.
Structural Analysis
After accounting for intracranial volume in regression analyses, no significant group differences in overall gray matter, white matter, or CSF were found (all p > .15). In addition, none of these structural indexes correlated with symptoms in the OCD group.
Compared with the HC group, the OCD group showed greater gray matter density in medial frontal gyrus/BA10 [(−18, 58, −10), Z = 3.68, k = 34], OFC [(−8, 42, −14), Z = 3.34, k = 10], and rACC [(−8, 56, 10), Z = 3.25, k = 10]. Of particular interest, compared with the HC group, the OCD group tended to have greater gray matter density in the inferior frontal gyrus [(−34, 28, −10), Z = 3.00, k = 25] at an uncorrected threshold of p < .005.
Discussion
In summary, we examined group differences in set-shifting between healthy and OCD-affected pediatric samples. The left inferior frontal gyrus/BA47 activation during set-shifting (i.e., mixed versus repeated) was greater in the healthy comparison group compared with the OCD group. In addition, group differences in the correlation between caudate activation during set shifting and shift cost were noted. The OCD group showed behavioral deficits in set-shifting, evidenced by the tendency to have a greater shift cost (i.e., slower reaction time to mixed trials versus repeated trials).
Bilateral inferior frontal gyrus activations have been reported during set-shifting.35-37 In this study, the HC group exhibited activation in the left inferior frontal gyrus during set-shifting, and this activation was greater than that observed in the OCD group. In the OCD group, the left inferior frontal gyrus region tends to be more activated in the reverse contrast (i.e., repeated > mixed). The lack of left inferior frontal activation in the OCD group during mixed blocks, coupled with the patients' tendency toward greater shift costs, suggest that the OCD group may have difficulty shifting cognitive sets because of a failure to activate the left inferior frontal gyrus. This result is consistent with recent evidence of less bilateral ventrolateral prefrontal cortical activation during task-switching in adult OCD6; however, we found significant group differences in activation (i.e., HC > OCD) only in the left inferior frontal gyrus during set-shifting. Structural evidence based on the voxel-based morphometry analysis suggests the opposite pattern of group difference (i.e., OCD > HC). This pattern may suggest a higher density of inhibitory interneurons in the inferior frontal gyrus in the OCD group, which might lead to higher voxel-based morphometry values and blunted fMRI response.
Finding a group difference only in left inferior frontal gyrus in this set-shifting task may reflect a Type II error or, alternatively, may highlight the lateralization of different functions of the inferior frontal gyrus.38 Generally, the left inferior frontal gyrus may be recruited to successfully shift cognitive sets. The left inferior frontal gyrus may maintain the cognitive sets,38-41 mediate the cognitive shift,42,43 and resolve interference from previous trials in working memory tasks.44 On the other hand, the right inferior frontal gyrus may facilitate successful response inhibition. The right inferior frontal gyrus has been implicated in tasks that require responses inhibition (e.g., during go/no go tasks) or taskswitching when stimulus–response mappings change.38 During successful motor inhibition, healthy comparison subjects activated the right inferior frontal gyrus more than OCD subjects.13,18 In the current set-shifting task, and unlike other task-switching or motor inhibition tasks, every trial required a response and the stimulus-response mappings were held constant.
Group differences in striatal activation were not detected in either whole-brain or anatomical ROI analyses; however, group differences in correlation between caudate activation and shift cost were noted. Although we investigated group differences in the striatum using whole-brain as well as anatomical ROI analysis and found no significant differences in either method, a Type II error could explain the absence of group difference in striatal activation. In addition, several task elements may explain the lack of striatal activation during set-shifting. Unlike previous task-switching and set-shifting paradigms, the set shifts in the current study are not dependent on the subject's performance. In other words, the block order is fixed, and this predictability could reduce striatal activation, as the striatum is particularly responsive to novelty.29 Moreover, no feedback is provided to the subject during the task that would elicit a striatal response to change behavior.36 Alternatively, developmental effects may explain the lack of striatal group differences. As the attentional system matures, the early reliance on the frontal-parietal system may shift to a frontal-striatal system,45 and the OCD group may lag behind in this developmental shift. There were no significant group differences in the striatum activation during set-shifting (i.e., mixed > repeated). Yet, upon further investigation, the HC group, compared with the OCD group, showed greater putamen activation in both mixed versus fixation and repeated versus fixation contrasts. Specifically, the HC group activated both the putamen and caudate in these contrasts, but the OCD group did not activate these regions in either contrast. Group differences between HC and OCD groups in set-shifting may emerge at a later time point along the brain's developmental trajectory; however, this study does not have sufficient power to examine activation in different age groups.
Although no group differences were noted in caudate activation in response to mixed versus repeated conditions, a positive correlation between caudate activation and shift cost was found in the HC group, whereas a negative correlation between caudate activation and shift cost was observed in the OCD group. As the shift cost (i.e., the reaction time differential between mixed and repeated trials) increased, the caudate activation increased in the HC group. Caudate activation seems to increase with increased difficulty to shift cognitive sets. These current results are consistent with a study that combined healthy adults and children and found a negative correlation between caudate activation during mixed trials and reaction time to mixed trials.19 In the OCD group, the relationship between shift cost and caudate activation is reversed. The individuals with OCD who had a lower shift cost (i.e., higher shift benefit) showed greater caudate activation. This negative correlation between caudate activation and shift cost in the OCD group could be explained by failure to activate the caudate with higher difficulty (i.e., greater shift cost). The lack of caudate and/or inferior frontal gyrus activation or the connectivity between these regions in the OCD group, may reflect increased difficulty in shifting between cognitive sets. In fact, the functional connectivity analysis using extracted values indicate that the inferior frontal gyrus and caudate regions are positively correlated in the HC group only. This finding is consistent with resting state data showing the HC group has greater connectivity between the inferior frontal gyrus and striatal regions (i.e., the putamen).46 The group difference in correlation also may be explained by the multiple discrete cell types in the striatum that cannot be readily discriminated using fMRI imaging methods. Contemporary neurocircuitry models of OCD emphasize a potential imbalance between the mutually antagonistic direct and indirect cortico-striatal-thalamic pathways.47 The group difference in correlation may be explained by the activation of different neuronal populations within the caudate.
In a first attempt to examine group differences in the neural correlates of set-shifting in pediatric OCD, we opted to use a block design paradigm. Indeed, using this paradigm, a group difference was detected in the inferior frontal gyrus in set-shifting ability. Compared with event-related designs, block designs have increased statistical power to detect differences. In addition, this block design was used to establish two distinct cognitive sets (i.e., shape and color), so that activity between a repeated and mixed set could be compared. Some might criticize the use of block designs because it is unclear whether the activation difference is due to performance differences between groups. In the current study, accuracy rates in both groups were quite high, and most errors occurred within the first trials of the block; therefore, it is unlikely that the activation differences were a result of behavioral differences. Future studies using event-related designs to examine set-shifting or task-switching ability in pediatric OCD populations would be beneficial to potentially extend and complement these results.
No relationships between activation and symptom severity scores measured by the CY-BOCS were noted in the OCD group, possibly indicating that the findings in the inferior frontal gyrus represent stable trait effects of OCD rather than symptom-driven effects. Previous research in adult OCD has shown that set-shifting deficits on the WCST remain unchanged even after symptom remission.4 Extradimensional shift deficits may represent a possible endophenotype, as first-degree relatives of females with OCD who have contamination symptoms have demonstrated similar deficits.7 In addition, gray matter abnormalities associated with the orbitofrontal cortex and reductions in right inferior frontal gyrus activation in response inhibition tasks and reversal learning tasks have also been detected in unaffected relatives.48,49 Future studies are needed to integrate functional and structural brain indices with genetic vulnerability markers to refine these potential endophenotypes.
Several limitations of this study should be noted. Our pediatric OCD sample consisted mostly of medicated individuals. Some studies have suggested that medication may not influence cognitive function or group differences in activation.6,50 In particular, Gu et al. reported less inferior frontal gyrus activation during task-switching in adults with OCD and show that this effect is independent of medication status.6 However, other studies suggest that medication effects from SSRIs may reduce frontal and striatal activation during OCD symptom provocation.51 In addition, there is some evidence that antidepressants enhance right inferior prefrontal activation during inhibitory tasks.52 Given these medication effects on brain activation, it would be more difficult to detect significant group differences in the inferior prefrontal cortex, and it is expected that the group differences found in this study with a medicated OCD sample would be more pronounced in drug-naive patients. Several studies have suggested the importance of examining the different OCD symptom profiles separately3,30; however, in this study, analyses were conducted on a heterogeneous sample with symptoms representative of most OCD symptom factors, as previously defined.26,27 With an increased sample size, further symptom subtype analyses could be conducted. Some studies have reported that the neuropsychological deficits in executive functioning are attributable to comorbid depressive symptoms.53 The present OCD group did have higher depression scores than the HC group, as measured by the CDI; however, our significant group × condition interaction in left inferior frontal gyrus survived analysis that statistically accounted for depressive symptoms. This finding is consistent with prior results indicating that depressive symptoms were not correlated with WCST performance in OCD patients.3 In addition, the depressive symptoms may have greater effects on affective switching (i.e., reversal learning) tasks54 than the cognitive set-shifting tasks, such as the one used in this study. Finally, our sample did contain individuals with comorbid diagnoses of Tourette's disorder and attention-deficit/hyperactivity disorder (ADHD). Fronto-striatal circuitry hyperactivity has been detected in Tourette's disorder patients,55,56 which is contrary to our finding; however, work in ADHD has found reductions in frontal regions during response inhibition tasks.57 Future studies will be required to disentangle the potential effects of comorbid diagnoses in this sample. As IQ measures were not obtained from this sample, we cannot address whether IQ differences affected the group differences in functional activation. Finally, the functional activation patterns may be dependent on developmental stage. The current sample included individuals with ages ranging from 10 to 17 years. Even though including age as a covariate did not alter the results, studies with larger samples within narrow age ranges are needed to fully examine the effects of developmental stage on group differences and the neural correlates in set-shifting.
In summary, results from this study provide new insight into the neural correlates of cognitive flexibility deficits in pediatric OCD. To the authors' knowledge, this study represents the first attempt to study set-shifting in pediatric OCD. Both the behavioral and functional activation group differences are highly relevant to the disorder's symptoms, suggesting that deficits in shifting cognitive sets are linked to less inferior frontal gyrus and striatal activation. Findings also extend results from a recent study of task-switching in adult OCD6 by replicating them in a pediatric sample. Future studies on this topic are warranted to isolate developmental factors contributing to this group difference and to determine whether it represents a possible endophenotype, by examining the behavioral and neural correlates of set-shifting ability in unaffected relatives of probands with OCD.
Acknowledgments
This research was supported by the David Judah Fund (J.C.B., S.E.S.) and in part by the Intramural Research Program of the National Institutes of Health and the National Institute of Mental Health (J.C.B., D.S.P., E.L.).
The authors acknowledge the contributions of Adriane Alpern, Elizabeth Flamm, Sarah Glaser, and Elizabeth Sadock from Massachusetts General Hospital for their assistance in conducting assessments. The authors also acknowledge the MRI technologists from the Brain Imaging Center at the McLean Hospital for their assistance with scanning.
Dr. Rauch has received funds for research through Massachusetts General Hospital (MGH) from Medtronics, Cyberonics, and Cephalon. He has received honoraria from Novartis, Neurogen, Sepracor, Primedia, and Medtronics, Inc. Dr. Rauch is a trustee at McLean Hospital and serves on the Board at the Massachusetts Society for Medical Research (MSMR) as well as on the National Foundation of Mental Health (NFMH) Board. Dr. Killgore works as a part-time contract researcher at the Department of Defense Contractor, GovSource, Inc., and does contract work for the Brain Institute, University of Utah. He has a U.S. Army Medical Research and Material Command grant and a patent pending: The Sleep History and Readiness Predictor (SHARP), a computer program developed for predicting cognitive performance from sleep and circadian rhythms. Dr. Killgore is affiliated with the U.S. Army Reserve. Dr. Pauls has obtained funds from the following sources: National Institutes of Health (National Institute of Neurological Disorders and Stroke, and National Institute of Mental Health), Autism Consortium, Ellison Foundation, Anonymous Donor, and has received an honorarium from the Mayo Clinic for giving course lectures.
Footnotes
This article was reviewed under and accepted by Ad Hoc Editor David R. Rosenberg, M.D.
A previous version of this work was presented at the American Academy of Child and Adolescent Psychiatry in October 2009.
Disclosure: Drs. Britton, Rosso, Ragan, Chosak, Pine, Leibenluft, Jenike, and Stewart, and Ms. Price, and Ms. Hezel report no biomedical financial interests or potential conflicts of interest.
References
- 1.American Psychiatric Association. Diagnostic and statistical manual of mental disorders - Fourth Edition. Washington, DC: American Psychiatric Association; 1994. [Google Scholar]
- 2.Kuelz AK, Hohagen F, Voderholzer U. Neuropsychological performance in obsessive-compulsive disorder: a critical review. Biol Psychol. 2004;65:185–236. doi: 10.1016/j.biopsycho.2003.07.007. [DOI] [PubMed] [Google Scholar]
- 3.Lawrence NS, Wooderson S, Mataix-Cols D, David R, Speckens A, Phillips ML. Decision making and set shifting impairments are associated with distinct symptom dimensions in obsessive-compulsive disorder. Neuropsychology. 2006;20:409–419. doi: 10.1037/0894-4105.20.4.409. [DOI] [PubMed] [Google Scholar]
- 4.Bannon S, Gonsalvez CJ, Croft RJ, Boyce PM. Executive functions in obsessive-compulsive disorder: state or trait deficits? Aust N Z J Psychiatry. 2006;40:1031–1038. doi: 10.1080/j.1440-1614.2006.01928.x. [DOI] [PubMed] [Google Scholar]
- 5.Remijnse PL, Nielen MM, van Balkom AJ, et al. Reduced orbito-frontal-striatal activity on a reversal learning task in obsessive-compulsive disorder. Arch Gen Psychiatry. 2006;63:1225–1236. doi: 10.1001/archpsyc.63.11.1225. [DOI] [PubMed] [Google Scholar]
- 6.Gu BM, Park JY, Kang DH, et al. Neural correlates of cognitive inflexibility during task-switching in obsessive-compulsive disorder. Brain. 2008;131:155–164. doi: 10.1093/brain/awm277. [DOI] [PubMed] [Google Scholar]
- 7.Chamberlain SR, Fineberg NA, Blackwell AD, Robbins TW, Saha-kian BJ. Motor inhibition and cognitive flexibility in obsessive-compulsive disorder and trichotillomania. Am J Psychiatry. 2006;163:1282–1284. doi: 10.1176/ajp.2006.163.7.1282. [DOI] [PubMed] [Google Scholar]
- 8.Watkins LH, Sahakian BJ, Robertson MM, et al. Executive function in Tourette's syndrome and obsessive-compulsive disorder. Psychol Med. 2005;35:571–582. doi: 10.1017/s0033291704003691. [DOI] [PubMed] [Google Scholar]
- 9.Veale DM, Sahakian BJ, Owen AM, Marks IM. Specific cognitive deficits in tests sensitive to frontal lobe dysfunction in obsessive-compulsive disorder. Psychol Med. 1996;26:1261–1269. doi: 10.1017/s0033291700035984. [DOI] [PubMed] [Google Scholar]
- 10.Penades R, Catalan R, Rubia K, Andres S, Salamero M, Gasto C. Impaired response inhibition in obsessive compulsive disorder. Eur Psychiatry. 2007;22:404–410. doi: 10.1016/j.eurpsy.2006.05.001. [DOI] [PubMed] [Google Scholar]
- 11.Bannon S, Gonsalvez CJ, Croft RJ, Boyce PM. Response inhibition deficits in obsessive-compulsive disorder. Psychiatry Res. 2002;110:165–174. doi: 10.1016/s0165-1781(02)00104-x. [DOI] [PubMed] [Google Scholar]
- 12.Rosenberg DR, Dick EL, O'Hearn KM, Sweeney JA. Response-inhibition deficits in obsessive-compulsive disorder: an indicator of dysfunction in frontostriatal circuits. J Psychiatry Neurosci. 1997;22:29–38. [PMC free article] [PubMed] [Google Scholar]
- 13.Roth RM, Saykin AJ, Flashman LA, Pixley HS, West JD, Mamourian AC. Event-related functional magnetic resonance imaging of response inhibition in obsessive-compulsive disorder. Biol Psychiatry. 2007;62:901–909. doi: 10.1016/j.biopsych.2006.12.007. [DOI] [PubMed] [Google Scholar]
- 14.Page LA, Rubia K, Deeley Q, et al. A functional magnetic resonance imaging study of inhibitory control in obsessive-compulsive disorder. Psychiatry Res. 2009;174:202–209. doi: 10.1016/j.pscychresns.2009.05.002. [DOI] [PubMed] [Google Scholar]
- 15.Shin MS, Choi H, Kim H, Hwang JW, Kim BN, Cho SC. A study of neuropsychological deficit in children with obsessive-compulsive disorder. Eur Psychiatry. 2008;23:512–520. doi: 10.1016/j.eurpsy.2008.03.010. [DOI] [PubMed] [Google Scholar]
- 16.Rosenberg DR, Averbach DH, O'Hearn KM, Seymour AB, Birmaher B, Sweeney JA. Oculomotor response inhibition abnormalities in pediatric obsessive-compulsive disorder. Arch Gen Psychiatry. 1997;54:831–838. doi: 10.1001/archpsyc.1997.01830210075008. [DOI] [PubMed] [Google Scholar]
- 17.Rubia K, Cubillo A, Smith AB, Woolley J, Heyman I, Brammer MJ. Disorder-specific dysfunction in right inferior prefrontal cortex during two inhibition tasks in boys with attention-deficit hyperactivity disorder compared to boys with obsessive-compulsive disorder. Hum Brain Mapp. 2010;31:287–299. doi: 10.1002/hbm.20864. [DOI] [PMC free article] [PubMed] [Google Scholar]
- 18.Woolley J, Heyman I, Brammer M, Frampton I, McGuire PK, Rubia K. Brain activation in paediatric obsessive compulsive disorder during tasks of inhibitory control. Br J Psychiatry. 2008;192:25–31. doi: 10.1192/bjp.bp.107.036558. [DOI] [PubMed] [Google Scholar]
- 19.Casey BJ, Davidson MC, Hara Y, et al. Early development of subcortical regions involved in non-cued attention switching. Dev Sci. 2004;7:534–542. doi: 10.1111/j.1467-7687.2004.00377.x. [DOI] [PubMed] [Google Scholar]
- 20.Kaufman J, Birmaher B, Brent D, et al. Schedule for Affective Disorders and Schizophrenia for School-Age Children-Present and Lifetime Version (K-SADS-PL): initial reliability and validity data. J Am Acad Child Adolesc Psychiatry. 1997;36:980–988. doi: 10.1097/00004583-199707000-00021. [DOI] [PubMed] [Google Scholar]
- 21.Goodman WK, Price LH, Rasmussen SA, et al. The Yale-Brown Obsessive Compulsive Scale. II. Validity. Arch Gen Psychiatry. 1989;46:1012–1016. doi: 10.1001/archpsyc.1989.01810110054008. [DOI] [PubMed] [Google Scholar]
- 22.Goodman WK, Price LH, Rasmussen SA, et al. The Yale-Brown Obsessive Compulsive Scale. I. Development, use, and reliability. Arch Gen Psychiatry. 1989;46:1006–1011. doi: 10.1001/archpsyc.1989.01810110048007. [DOI] [PubMed] [Google Scholar]
- 23.Kovacs M. Child Depression Inventory. 1992. [Accessed February 18, 2010];2009 Available at: http://www.pearsonassessments.com/HAIWEB/Cultures/en-us/Productdetail.htm?Pid=015-8044-762&Mode=summary.
- 24.Leckman JF, Riddle MA, Hardin MT, et al. The Yale Global Tic Severity Scale: initial testing of a clinician-rated scale of tic severity. J Am Acad Child Adolesc Psychiatry. 1989;28:566–573. doi: 10.1097/00004583-198907000-00015. [DOI] [PubMed] [Google Scholar]
- 25.Spielberger CD, Edwards CD, Montuori J, Lushene R. STAI-C. [Accessed February 18, 2010];2009 Available at: http://www.mindgarden.com/products/staisch.htm#about.
- 26.Leckman JF, Grice DE, Boardman J, et al. Symptoms of obsessive-compulsive disorder. Am J Psychiatry. 1997;154:911–917. doi: 10.1176/ajp.154.7.911. [DOI] [PubMed] [Google Scholar]
- 27.Stewart SE, Rosario MC, Baer L, et al. Four-factor structure of obsessive-compulsive disorder symptoms in children, adolescents, and adults. J Am Acad Child Adolesc Psychiatry. 2008;47:763–772. doi: 10.1097/CHI.0b013e318172ef1e. [DOI] [PubMed] [Google Scholar]
- 28.Friston K. Statistical Parametric Mapping. [Accessed February 18, 2010]; Available at: http://www.fil.ion.ucl.ac.uk/spm.
- 29.Rauch SL, Savage CR, Alpert NM, et al. Probing striatal function in obsessive-compulsive disorder: a PET study of implicit sequence learning. J Neuropsychiatry Clin Neurosci. 1997;9:568–573. doi: 10.1176/jnp.9.4.568. [DOI] [PubMed] [Google Scholar]
- 30.Rauch SL, Wedig MM, Wright CI, et al. Functional magnetic resonance imaging study of regional brain activation during implicit sequence learning in obsessive-compulsive disorder. Biol Psychiatry. 2007;61:330–336. doi: 10.1016/j.biopsych.2005.12.012. [DOI] [PubMed] [Google Scholar]
- 31.Ward BD. AlphaSim. 2000. [Accessed February 18, 2010];2010 Available at: http://afni.nimh.nih.gov/afni/doc/manual/AlphaSim.
- 32.Talairach J, Tournoux P. Co-Planar Stereotactic Atlas of the Human Brain. Stuttgart: Thieme; 1988. [Google Scholar]
- 33.Brett M, Anton JL, Valabregue R, Poline JB. Region of interest analysis using an SPM toolbox. Paper presented at: 8th International Conference on Functional Mapping of the Human Brain; Sendai, Japan. 2002. [Google Scholar]
- 34.Dale AM, Fischl B, Sereno MI. Cortical surface-based analysis. I. Segmentation and surface reconstruction. Neuroimage. 1999;9:179–194. doi: 10.1006/nimg.1998.0395. [DOI] [PubMed] [Google Scholar]
- 35.Dove A, Pollmann S, Schubert T, Wiggins CJ, von Cramon DY. Prefrontal cortex activation in task switching: an event-related fMRI study. Brain Res Cogn Brain Res. 2000;9:103–109. doi: 10.1016/s0926-6410(99)00029-4. [DOI] [PubMed] [Google Scholar]
- 36.Monchi O, Petrides M, Petre V, Worsley K, Dagher A. Wisconsin Card Sorting revisited: distinct neural circuits participating in different stages of the task identified by event-related functional magnetic resonance imaging. J Neurosci. 2001;21:7733–7741. doi: 10.1523/JNEUROSCI.21-19-07733.2001. [DOI] [PMC free article] [PubMed] [Google Scholar]
- 37.Nakahara K, Hayashi T, Konishi S, Miyashita Y. Functional MRI of macaque monkeys performing a cognitive set-shifting task. Science. 2002;295:1532–1536. doi: 10.1126/science.1067653. [DOI] [PubMed] [Google Scholar]
- 38.Aron AR, Monsell S, Sahakian BJ, Robbins TW. A componential analysis of task-switching deficits associated with lesions of left and right frontal cortex. Brain. 2004;127:1561–1573. doi: 10.1093/brain/awh169. [DOI] [PubMed] [Google Scholar]
- 39.Aron AR, Robbins TW, Poldrack RA. Inhibition and the right inferior frontal cortex. Trends Cogn Sci. 2004;8:170–177. doi: 10.1016/j.tics.2004.02.010. [DOI] [PubMed] [Google Scholar]
- 40.Garavan H, Ross TJ, Murphy K, Roche RA, Stein EA. Dissociable executive functions in the dynamic control of behavior: inhibition, error detection, and correction. Neuroimage. 2002;17:1820–1829. doi: 10.1006/nimg.2002.1326. [DOI] [PubMed] [Google Scholar]
- 41.MacDonald AW, 3rd, Cohen JD, Stenger VA, Carter CS. Dissociating the role of the dorsolateral prefrontal and anterior cingulate cortex in cognitive control. Science. 2000;288:1835–1838. doi: 10.1126/science.288.5472.1835. [DOI] [PubMed] [Google Scholar]
- 42.Derrfuss J, Brass M, Neumann J, von Cramon DY. Involvement of the inferior frontal junction in cognitive control: meta-analyses of switching and Stroop studies. Hum Brain Mapp. 2005;25:22–34. doi: 10.1002/hbm.20127. [DOI] [PMC free article] [PubMed] [Google Scholar]
- 43.Konishi S, Hayashi T, Uchida I, Kikyo H, Takahashi E, Miyashita Y. Hemispheric asymmetry in human lateral prefrontal cortex during cognitive set shifting. Proc Natl Acad Sci U S A. 2002;99:7803–7808. doi: 10.1073/pnas.122644899. [DOI] [PMC free article] [PubMed] [Google Scholar]
- 44.D'Esposito M, Postle BR, Jonides J, Smith EE. The neural substrate and temporal dynamics of interference effects in working memory as revealed by event-related functional MRI. Proc Natl Acad Sci U S A. 1999;96:7514–7519. doi: 10.1073/pnas.96.13.7514. [DOI] [PMC free article] [PubMed] [Google Scholar]
- 45.Sohn MH, Ursu S, Anderson JR, Stenger VA, Carter CS. Inaugural article: the role of prefrontal cortex and posterior parietal cortex in task switching. Proc Natl Acad Sci U S A. 2000;97:13448–13453. doi: 10.1073/pnas.240460497. [DOI] [PMC free article] [PubMed] [Google Scholar]
- 46.Harrison BJ, Soriano-Mas C, Pujol J, et al. Altered corticostriatal functional connectivity in obsessive-compulsive disorder. Arch Gen Psychiatry. 2009;66:1189–1200. doi: 10.1001/archgenpsychiatry.2009.152. [DOI] [PubMed] [Google Scholar]
- 47.Saxena S, Brody AL, Schwartz JM, Baxter LR. Neuroimaging and frontal-subcortical circuitry in obsessive-compulsive disorder. Br J Psychiatry Suppl. 1998:26–37. [PubMed] [Google Scholar]
- 48.Menzies L, Achard S, Chamberlain SR, et al. Neurocognitive endophenotypes of obsessive-compulsive disorder. Brain. 2007;130:3223–3236. doi: 10.1093/brain/awm205. [DOI] [PubMed] [Google Scholar]
- 49.Chamberlain SR, Menzies L, Hampshire A, et al. Orbitofrontal dysfunction in patients with obsessive-compulsive disorder and their unaffected relatives. Science. 2008;321:421–422. doi: 10.1126/science.1154433. [DOI] [PubMed] [Google Scholar]
- 50.Mataix-Cols D, Alonso P, Pifarre J, Menchon JM, Vallejo J. Neuropsychological performance in medicated versus unmedicated patients with obsessive-compulsive disorder. Psychiatry Res. 2002;109:255–264. doi: 10.1016/s0165-1781(02)00024-0. [DOI] [PubMed] [Google Scholar]
- 51.Nakao T, Nakagawa A, Yoshiura T, et al. Brain activation of patients with obsessive-compulsive disorder during neuropsychological and symptom provocation tasks before and after symptom improvement: a functional magnetic resonance imaging study. Biol Psychiatry. 2005;57:901–910. doi: 10.1016/j.biopsych.2004.12.039. [DOI] [PubMed] [Google Scholar]
- 52.Vollm B, Richardson P, McKie S, Elliott R, Deakin JF, Anderson IM. Serotonergic modulation of neuronal responses to behavioural inhibition and reinforcing stimuli: an fMRI study in healthy volunteers. Eur J Neurosci. 2006;23:552–560. doi: 10.1111/j.1460-9568.2005.04571.x. [DOI] [PubMed] [Google Scholar]
- 53.Purcell R, Maruff P, Kyrios M, Pantelis C. Neuropsychological deficits in obsessive-compulsive disorder: a comparison with unipolar depression, panic disorder, and normal controls. Arch Gen Psychiatry. 1998;55:415–423. doi: 10.1001/archpsyc.55.5.415. [DOI] [PubMed] [Google Scholar]
- 54.Remijnse PL, Nielen MM, van Balkom AJ, et al. Differential frontal-striatal and paralimbic activity during reversal learning in major depressive disorder and obsessive-compulsive disorder. Psychol Med. 2009;39:1503–1518. doi: 10.1017/S0033291708005072. [DOI] [PubMed] [Google Scholar]
- 55.Baym CL, Corbett BA, Wright SB, Bunge SA. Neural correlates of tic severity and cognitive control in children with Tourette syndrome. Brain. 2008;131:165–179. doi: 10.1093/brain/awm278. [DOI] [PubMed] [Google Scholar]
- 56.Marsh R, Zhu H, Wang Z, Skudlarski P, Peterson BS. A developmental fMRI study of self-regulatory control in Tourette's syndrome. Am J Psychiatry. 2007;164:955–966. doi: 10.1176/appi.ajp.164.6.955. [DOI] [PMC free article] [PubMed] [Google Scholar]
- 57.Smith AB, Taylor E, Brammer M, Toone B, Rubia K. Task-specific hypoactivation in prefrontal and temporoparietal brain regions during motor inhibition and task switching in medication-naive children and adolescents with attention deficit hyperactivity disorder. Am J Psychiatry. 2006;163:1044–1051. doi: 10.1176/ajp.2006.163.6.1044. [DOI] [PubMed] [Google Scholar]