

Abstract
The mechanistic/mammalian target of rapamycin (mTOR) is inhibited clinically to suppress T cell function and prevent allograft rejection. mTOR is the kinase subunit of two mTOR-containing complexes, mTOR complex (mTORC) 1 and 2. Although mTORC1 is inhibited by the macrolide immunosuppressant rapamycin (RAPA), its efficacy may be limited by its inability to block mTORC1 completely and its limited effect on mTORC2. Adenosine triphosphate (ATP)-competitive mTOR inhibitors are an emerging class of mTOR inhibitors that compete with ATP at the mTOR active site and inhibit any mTOR-containing complex. Since this class of compounds has not been investigated for their immunosuppressive potential, our goal was to determine the influence of a prototypic ATP-competitive mTOR inhibitor on allograft survival. AZD8055 proved to be a potent suppressor of T cell proliferation. Moreover, a short, 10-day course of the agent successfully prolonged murine MHC-mismatched, vascularized heart transplant survival. This therapeutic effect was associated with increased graft-infiltrating regulatory T cells and reduced CD4+ and CD8+ T cell IFN-γ production. These studies establish for the first time, that ATP-competitive mTOR inhibition can prolong organ allograft survival and warrant further investigation of this next generation mTOR inhibitors.
Introduction
The mechanistic/mammalian target of rapamycin (mTOR) is a ubiquitously expressed serine/threonine kinase of the phosphatidylinositol 3-kinase (P13K)-like kinase superfamily. It plays an important role in immune regulation (1, 2) and is targeted clinically by rapamycin (RAPA) and its analogues to suppress rejection following organ transplantation (3). Two signaling complexes, mTOR complex (mTORC) 1 and mTORC2, utilize mTOR as their catalytic subunit. Both complexes contain the protein subunits mammalian lethal with SEC13 protein 8 (mLST8) and DEP domain-containing mTOR-interacting protein (DEPTOR), while mTORC1 is distinct in incorporating regulatory-associated protein of mTOR (raptor) and proline rich AKT substrate of 40 kDa (PRAS40). Alternatively, mTORC2 uniquely includes the RAPA-insensitive companion of mTOR (rictor), mammalian stress-activated protein kinase-interacting protein 1 (mSIN1) and protein observed with rictor (Protor) (1, 4). RAPA is an allosteric, incomplete inhibitor of mTORC1 (5, 6) that does not affect mTORC2 directly, except in a small number of cell lines after prolonged exposure (7, 8). The immune function of mTORC2 and the impact of its inhibition in transplantation are unknown.
Recently-described adenosine triphosphate (ATP)-competitive mTOR inhibitors block the catalytic function of mTOR, resulting in inhibition of both mTOR-containing complexes (5, 9, 10). These inhibitors have facilitated investigation of the function of RAPA-resistant mTOR in non-immune cells. This has revealed, surprisingly, that in addition to mTORC2, there are RAPA-resistant functions of mTORC1, such as cell proliferation and cap-dependent protein translation, that are not inhibited completely by RAPA (5, 9). We have demonstrated recently that RAPA-resistant mTORC1 regulates dendritic cell (DC) B7 homologue-1 (B7-H1=programmed death-1 ligand 1; CD274) expression, and that RAPA-resistant mTOR negatively regulates DC expression of IL-10, resulting in B7-H1-mediated enhanced ability to induce regulatory T cells (Treg) (11). However, others have shown that knockdown of rictor, a required component of mTORC2, results in DC with enhanced pro-inflammatory cytokine secretion following lipopolysaccharide stimulation (12). Conditional genetic ablation of rictor in T cells impairs their ability to differentiate into T helper type-1 (Th1) and Th2 (13) or Th2 cells (14). These findings demonstrate that RAPA-resistant mTORC1 and mTORC2 are critical in the regulation of immune cell function.
Despite the emerging role of RAPA-resistant mTOR in innate and adaptive immune cell function, neither the influence of ATP-competitive mTOR inhibitors on T cells nor the immunosuppressive (IS) potential of these agents has been investigated. Thus, we investigated the efficacy of these inhibitors in a mouse model of cardiac transplantation. AZD8055 (Figure 1) is a prototypic, orally-available, ATP-competitive mTOR kinase inhibitor, that suppresses phosphorylation of the mTORC1 substrates p70S6K and eukaryotic initiation factor 4E-binding protein 1 (4E-BP1), as well as phosphorylation of the mTORC2 substrate AKT (S473). Herein, we demonstrate that ATP-competitive mTOR inhibition with AZD8055 is more efficacious than mTORC1 inhibition by RAPA in blocking T cell proliferation in vitro. While in vivo, AZD8055 exhibited a shorter half-life than RAPA, it significantly prolonged mouse vascularized cardiac allograft survival, which correlated with increased graft-infiltrating Treg and reduced type-1 cytokine production by splenic CD4+ and CD8+ T cells. These findings establish that ATP-competitive mTOR inhibitors are viable IS agents in experimental organ transplantation. Further studies regarding their immunomodulatory properties, efficacy in preventing graft rejection and pharmacokinetics are warranted.
Figure 1. Structure of AZD8055.
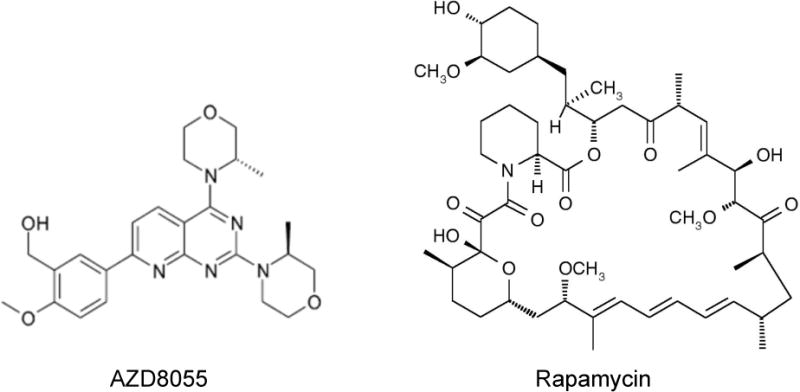
The chemical structure of the ATP-competitive mTOR kinase inhibitor (5-{2,4-Bis[(3S)-3-methylmorpholin-4-yl]pyrido[2,3-d]pyrimidin-7-yl}-2-methoxyphenyl) methanol (AZD8055), compared with that of rapamycin.
Materials and Methods
Animals
8–12 week old male C57BL/6 (B6; H2Kb) or BALB/c (H2Kd) mice were purchased from The Jackson Laboratory. Experiments were performed under an institutional animal care and use committee-approved protocol and in accordance with the NIH guide for the Care and Use of Laboratory Animals.
AZD8055 and rapamycin
AZD8055 (5-{2,4-Bis[(3S)-3-methylmorpholin-4-yl]pyrido[2,3-d]pyrimidin-7-yl}-2-methoxy-phenyl) methanol (Figure 1) was prepared for in vitro studies as a 10 mM stock solution in dimethyl sulphoxide (DMSO) and added at the concentration indicated for the duration of cell cultures. For in vivo administration, the AZD8055 solution was diluted in PBS with 0.02% Tween 80 and 0.26% polyethylene glycol as a carrier. Rapamycin (LC Laboratories) was dissolved in ethanol and further diluted in the above carrier. The final concentration of DMSO or ethanol did not exceed 0.05%.
T cell isolation and anti-CD3/CD28 bead stimulation
CD3+ T cells were isolated by negative selection and labeled with carboxyfluorescein succinimidyl ester (CFSE; Invitrogen). T cells (1×10⁵) were stimulated with CD3/CD28 T-Activator Dynabeads (2.5×10⁴; Gibco) for 5 days.
Histology
Heart allografts were fixed in 10% v/v neutral buffered formalin, paraffin-embedded, sectioned, and stained with hematoxylin and eosin. Additionally, sections were assessed by standard immunohistochemical staining for forkhead box P3 (Foxp3; eBioscience, Clone FJK-16s). Whole slide images of stained specimens were generated by scanning with a Mirax MIDI (3D Histech, Budapest, Hungary). Digital images were captured using Panoramic Viewer (Version 1.14; 3D Histech). 10× images were captured using an AxioStar Plus microscope (Zeiss) with a digital camera (AxioCam INC, Zeiss). Foxp3+ cells were quantified by counting positive cells within 2–3 fields per heart.
Flow cytometry
Cell surface and intracellular staining was performed as described (11, 15). A LSR II or LSR Fortessa flow cytometer (BD Bioscience) was used to acquire samples. Data were analyzed using FlowJo 8.8.6 (Tree Star).
Semi-quantitative PCR
Total RNA was isolated, reverse transcribed and amplified as described (16). Foxp3 forward primer: CACCTATGCCACCCTTATCC; Foxp3 reverse primer: CGAACATGCGAGTAAACCAA; β-actin forward primer: AGAGGGAAATCGTGCGTGAC; β-actin reverse primer: CAATAGTGATGACCTGGCCGT.
Splenocyte restimulation
Following red blood cell lysis, splenocytes were stimulated with phorbol-12-myristate-13-acetate (PMA; 1 mg/ml) and ionomycin (1 mg/ml) for 3.5h at 37°C. GolgiPlug (1 μl/ml; BD Bioscience) was added for the final 3h of culture before staining for flow cytometry.
Vascularized heart transplantation
BALB/c to B6 heterotopic heart transplants were performed as described (17). Recipients were treated with a 10-day course of either RAPA (2 mg/kg loading dose and 1 mg/kg/d intraperitoneally [i.p.] maintenance dose) or AZD8055 (10 mg/kg twice daily i.p.). Graft survival was monitored by abdominal palpation; rejection was determined by complete cessation of cardiac contraction and confirmed histologically. Alternatively, recipients were euthanized on day 10–11, 20 or 80 post-transplant for immune monitoring and graft histology.
Pharmacokinetic analyses
Plasma levels of AZD8055 and whole blood levels of RAPA were determined by high-performance liquid chromatography/mass spectrometry, after minor modifications of published procedures (10, 18).
Statistics
Results are expressed as means ± 1 standard deviation (SD). Unpaired, two-tailed Student’s ‘t’ tests were used to determine the significance of differences between means. Log-rank tests were used to establish the significance of differences between survival curves (GraphPad Prism).
Results
AZD8055 reveals RAPA-resistant inhibition of CD4+ and CD8+ T cell proliferation
Previous studies have demonstrated that mouse embryonic fibroblast proliferation is inhibited to a greater degree by ATP-competitive dual mTOR inhibitors than by RAPA (5, 9). We sought to determine if the ATP-competitive mTOR inhibitor, AZD8055, could similarly suppress T cell proliferation more potently than RAPA. Although RAPA was a more potent inhibitor of CD4+ and CD8+ T cell proliferation at concentrations less than (approximately) 30 nM, AZD8055 surpassed the ability of RAPA to inhibit T cell proliferation at concentrations ≥ 200 nM (Figure 2). While AZD8055 exerted a dose-related inhibitory effect, RAPA caused similar degrees of inhibition of T cell proliferation at all concentrations tested between 1.95 nM and 1000 nM (Figure 2). These concentrations are relevant to in vivo levels after AZD8055 administration (10 mg/kg) both orally, where free plasma drug concentrations reached 500 nM (10), and intraperitoneally, where we found total plasma drug levels of ≥ 200 nM (Figure 3).
Figure 2. ATP-competitive mTOR inhibition suppresses T cell proliferation at physiologic levels to a greater degree than that of RAPA.
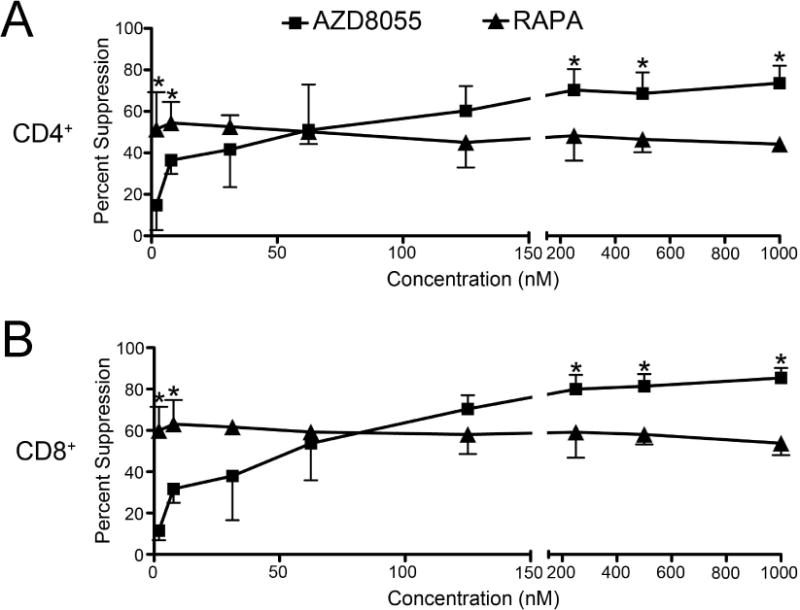
B6 CD3+ T cells were stimulated with CD3/CD28 T-Activator Dynabeads for 5 days in the presence of increasing concentrations of RAPA or AZD8055 added at the start of culture. (A) CD4+ or (B) CD8+ T cell proliferation was determined by CFSE dilution and calculated as percent suppression by the indicated mTOR inhibitor compared to T cells stimulated in the absence of inhibitor. * p<0.05 versus the same concentration of RAPA or AZD8055 for n=3–4 experiments per data point.
Figure 3. Pharmacokinetics of AZD8055 and rapamycin (RAPA).
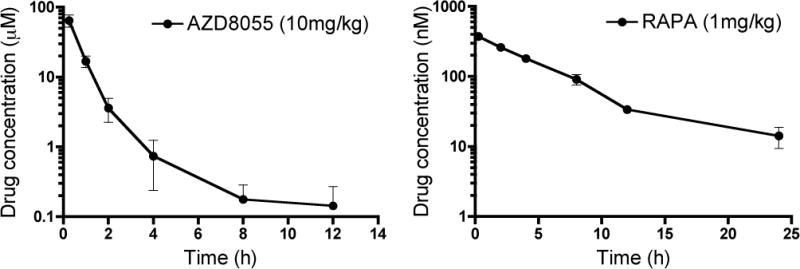
Plasma total drug concentrations of AZD8055 and whole blood concentrations of RAPA after i.p. administration of 10 mg/kg and 1 mg/kg, respectively. Plasma was collected from 15 min after drug administration. Concentrations are plotted against time after drug administration. Data are means ± 1SD obtained from 3 mice at each time point.
Pharmacokinetics of AZD8055 and RAPA
AZD8055 has been reported to have a short half-life of approximately 2h in mice following its oral administration (10), whereas a half-life of 6.4h has been reported for RAPA after i.v. administration in B6 mice (19). Based on this information, AZD8055 was administered twice daily and RAPA was administered once a day. We determined the total plasma drug concentrations of AZD8055 and whole blood concentrations of RAPA at various times after i.p. administration of 10 mg/kg AZD8055 or 1 mg/kg RAPA, respectively. Concentrations of each drug over time are shown in Figure 3. A pronounced distribution phase was evident in the AZD8055 plasma concentration time profile. Both drugs were absorbed fairly rapidly, reaching peak concentrations in about 0.25h. Various pharmacokinetic parameters are shown in Table 1. The plasma concentration of total AZD8055 fell to 200 nM 8h after its i.p. administration, a concentration at which AZD8055 was superior to RAPA in inhibiting T cell proliferation in vitro (Figure 2). In spite of the fact that RAPA was administered once a day, its blood concentrations remained above 10 nM at 24 h after a single dose (Figure 3), which corresponds to its therapeutic concentrations in solid organ transplant patients.
Table 1.
Pharmacokinetic parameters of AZD8055 and Rapamycin
| Parameter | AZD8055 | Rapamycin |
|---|---|---|
| Disposition rate constant | 0.205 h−1 | 0.141 h−1 |
| Half life (T1/2) | 3.4 h | 4.9 h |
| AUC 0-infinity | 26.2μg/ml/h | 1.93μg/ml/h |
| Apparent Clearance (CL/F*) | 7.6 ml/h | 8.64 ml/h |
| Apparent volume of distribution | 37 ml | 74 ml |
F, fraction that is bioavailable
ATP-competitive mTOR inhibition prolongs fully MHC-mismatched mouse cardiac allograft survival
Having observed that ATP-competitive mTOR inhibition suppressed T cell proliferation (Figure 2), we next sought to determine whether AZD8055 could inhibit organ allograft rejection. The regimen selected for administering AZD8055 or RAPA i.p. (Figure 4A) was designed to achieve a similar duration of treatment around the peak of acute allograft rejection in the BALB/c to B6 cardiac allograft model, while maintaining a 10 day treatment regimen for both inhibitors. Using this regimen, both AZD8055 and RAPA prolonged allograft survival significantly (p<0.001; median graft survival times: AZD8055 28 days, RAPA 68 days [Figure 4B]). There was no significant difference between the graft survival times of the AZD8055 and RAPA groups (p=0.26). Twenty and fifty percent of the recipients receiving AZD8055 and RAPA, respectively, demonstrated long-term graft survival (>80 days). Histologic analysis of grafts from mice that did not receive IS revealed severe cellular rejection and myocardial destruction by days 10–11, whereas transplants from mice given AZD8055 or RAPA euthanized at this time showed a comparatively mild mononuclear cell infiltrate (Figure 4C). Grafts that survived > 80 days showed leukocytic infiltration by plasmacytic and mononuclear cells, thickening of the vascular intima and lumen reduction, indicating chronic rejection. Allografts from RAPA-treated mice showed more abundant areas with normal myocardial fibers than those from mice given AZD8055. These results were in agreement with better graft-beating quality detected in RAPA- versus AZD8055-treated mice (data not shown). Graft-infiltrating Foxp3+ Treg were enhanced 7–10 fold by AZD8055 or RAPA (Figure 4D–E), and increased Foxp3 mRNA expression was detected in allografts of mice treated with AZD8055 or RAPA, with RAPA being superior to AZD8055 (Figure 4F). No adverse effects of AZD8055 on renal function were observed after 10 days of treatment (serum creatinine levels: 0.2 mg/dl; n=4), in agreement with safety and tolerability reports for AZD8055 in cancer patients (20, 21). In addition, no differences were found in wound healing between the three groups of transplanted mice.
Figure 4. AZD8055 prolongs allograft survival and enhances graft-infiltrating Treg.
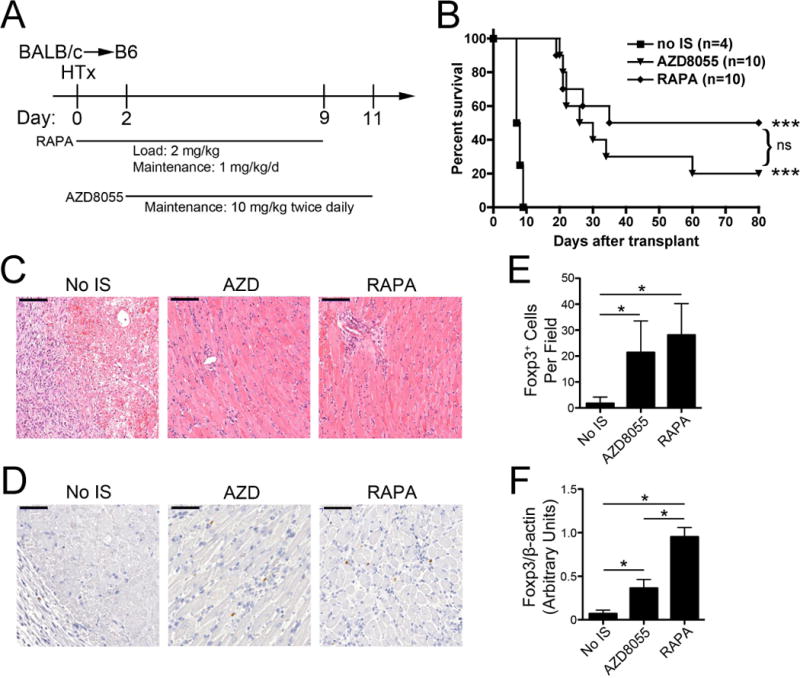
(A) The protocol for AZD8055 or RAPA administration following heart transplantation is depicted graphically. (B) B6 recipients of BALB/c heterotopic heart grafts were treated with AZD8055 (10 mg/kg twice daily i.p. from day 2-day 11) or RAPA (2 mg/kg loading dose on day 0 followed by 1 mg/kg/day i.p. from day 1–9) and allograft survival determined. The numbers of mice per group are shown in parentheses. (C) H&E staining of cardiac allografts was performed on day 10–11 following transplantation; bar indicates 200 μm. n=3 mice per group. (D) Foxp3+ cells in the allograft were identified by immunoperoxidase staining; bar indicates 100 μm and (E) quantified. (F) Foxp3 message in the allografts was determined by PCR. ns = not significant; * p<0.05; *** p<0.001 compared with the control group (no immunosuppression [IS]).
AZD8055 transiently reduces effector T cell differentiation following cardiac transplantation
We next determined the influence of AZD8055 on T cell polarization and cytokine production following transplantation. Splenocytes were restimulated ex vivo with PMA and ionomycin, 10–11 days after transplantation, to determine their cytokine-producing ability by flow cytometry (Figure 5). Transplant recipients that did not receive IS showed enhanced (approximately 2-fold) CD8+ T cell interferon (IFN)γ production compared with normal, non-transplanted controls that was inhibited completely by AZD8055 or RAPA treatment (Figure 5A–B). Enhanced IFNγ production by CD4+ T cells was inhibited by AZD8055, reaching the same levels as in naïve mice, however RAPA showed more effective inhibition (Figure 5C–D). We further investigated this difference between RAPA and AZD8055, repeating and extending cytokine measurements in mice with surviving grafts at days 20 and 80 post-transplant. Mice treated with AZD8055 showed a higher percentage of IFN-producing CD4+ and CD8+ T cells compared with animals given RAPA, and also comparatively higher incidences of IL-17+, IL-10+ and Foxp3+ CD4+ T cells at day 20 post-transplant (Figure 5E). These differences were not sustained 80 days post-transplant (Figure 5E). Together, the findings suggest that AZD8055 is able to reduce T cell IFNγ production in heart graft recipients, although at the drug doses selected, this inhibition of effector T cell cytokine production is not as long-lasting as in RAPA-treated hosts.
Figure 5. AZD8055 inhibits T cell IFNγ production at day 10 post-transplant.
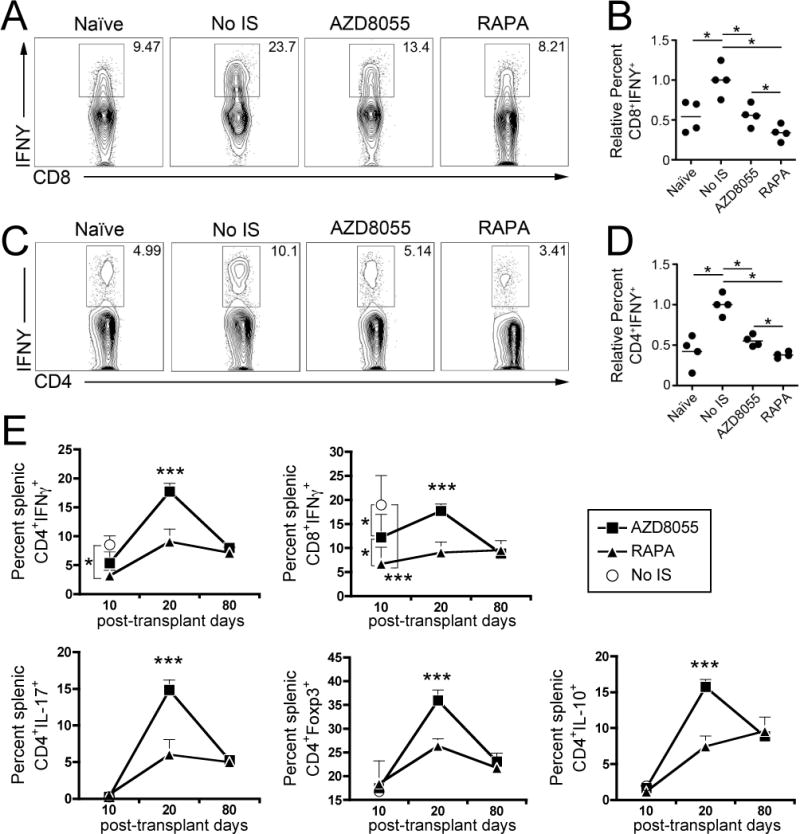
Splenocytes were restimulated with PMA and ionomycin on day 10–11 post-transplant and intracellular cytokine production assessed by flow cytometry. (A, B) CD8+ and (C, D) CD4+ T cell production of IFNγ is depicted and quantified. (E) IFNγ production by CD4+ and CD8+ T cells, and IL-17+, Foxp3+ and IL-10+ CD4+ T cells were quantified on days 10, 20 and 80 post-transplant. * p<0.05; *** p<0.001. n=4 mice per group. IS=immunosuppression.
Discussion
We demonstrate that the prototypic ATP-competitive dual mTOR inhibitor AZD8055 suppresses mouse CD4+ and CD8+ T cell proliferation in vitro to a greater extent than the mTORC1 inhibitor RAPA at concentrations equal to or exceeding approximately 200 nM. These data extend previous findings in non-immune cells showing that RAPA inhibits mTORC1-mediated cell proliferation (5, 9) incompletely. Our findings suggest that ATP-competitive mTOR inhibitors have potential to suppress alloreactive T cell responses in vivo, in transplantation and other immune-mediated inflammatory disorders, more potently than RAPA and its analogues at physiologic levels. Notably, small organic molecules can engage multiple important cell receptors and systems, including aryl hydrocarbon receptors, heme oxygenase-1 and multiple drug resistance protein, and possibly Toll-like and NOD-like receptors. It is, however, beyond the scope of this brief report to assay and control for these functions.
The total plasma concentrations of AZD8055 observed in this study are higher than those reported for free concentrations of AZD8055 following its oral administration (10). This can partially be explained by the fact that approximately 95% of AZD8055 in plasma is bound to plasma protein (Dr. A.D. McCormick, Astrazeneca, UK, personal communication). In addition, differences in the bioavailability of AZD8055 after i.p. administration (this study) and oral administration (10), can also account for the differences in the concentrations observed.
We tested the ability of AZD8055 to inhibit graft rejection in a fully MHC-mismatched mouse cardiac transplant model. To our knowledge, this is the first report that an ATP-competitive mTOR inhibitor can suppress allograft rejection. Despite its short half-life ((10) and Figure 3), a 10-day course of AZD8055 prolonged graft survival significantly and promoted long-term (>80 day) graft survival in 20% of recipients. Although this duration of survival was achieved with a larger dose (10 mg/kg/12h) compared to that required for a similar effect of RAPA (1 mg/kg/day), these data indicate that ATP-competitive mTOR inhibitors are a novel class of mTOR-inhibiting IS agents. No adverse effects of AZD055 on either renal function or wound healing were observed. AZD8055 demonstrated similar immunomodulatory effects to RAPA by increasing graft-infiltrating and splenic Foxp3+ Treg and inhibiting T cell cytokine (IFNγ) production, although Th1 and Th17 effector T cell cytokine production was higher with AZD8055 on post-transplant day 20. This difference may be related to the shorter half-life of AZD8055 compared with RAPA, combined with the lower concentration of RAPA required to inhibit T cell proliferation. The significance of higher IL-10-producing CD4+ T cells in the AZD8055-treated group compared with the RAPA group on day 20 is unclear.
The field of transplantation may benefit from the current intense research interest in ATP-competitive mTOR inhibitors in cancer pharmacology. AZD8055 has entered Phase I clinical trials for advanced solid malignancies or lymphomas, where its half-life in humans following oral dosing has been reported as approximately 2h (20, 21). Due to the rapid metabolism of AZD8055 by human hepatocytes (22) (and presumably by mouse hepatocytes), AZD8055 has been modified to improve its pharmacokinetics, resulting in the candidate compound AZD2014 (22, 23), which has now entered Phase I trials in clinical oncology. Thus, it is likely that improved pharmacokinetics and pharmacodynamics of these next generation ATP-competitive mTOR inhibitors may also enhance their utility in transplantation.
In summary, we demonstrate that the ATP-competitive mTOR inhibitor AZD8055 prolongs organ allograft survival (proof of concept), promotes Treg infiltration of the graft and inhibits T cell proinflammatory cytokine production (IFNγ) following transplantation. We expect that future generations of ATP-competitive mTOR inhibitors with improved pharmacokinetics will demonstrate increased potency in transplantation. Moreover, it will be important to determine whether ATP-competitive mTOR inhibitors have distinct immunomodulatory properties compared to RAPA in vivo, as has been seen using conditional mTORC1 or mTORC2 knockout mice and ATP-competitive mTOR inhibitors in vitro. In this regard, it is of interest that abrogation of chronic rejection in a rat heart allograft model involves modulation of both mTORC1 and mTORC2 pathways (24). Further studies evaluating this novel class of mTOR inhibitor in transplantation are clearly warranted.
Acknowledgments
BRR was supported by a National Institutes of Health (NIH) T32 pre-doctoral fellowship (T32AI07449 to AWT) and a non-concurrent American Heart Association pre-doctoral fellowship (11PRE7070020). DRR was supported by a Starzl Transplantation Institute postdoctoral fellowship. The work was also supported by NIH grants R01AI67541 (AWT) and R00HL097155 (HRT). We thank the Drug Metabolism and Pharmacokinetics Group within Innovative Medicines (Oncology), AstraZeneca, Alderley Park, Macclesfield, Cheshire, UK for measurement of AZD8055 plasma levels. We thank Mr. William Shufesky and Drs. Adrian Morelli and Adriana Larregina for assistance with graft histology.
Abbreviations
- ATP
adenosine triphosphate
- B6
C57BL/6
- CFSE
carboxyfluorescein succinimidyl ester
- DC
dendritic cell
- Foxp3
forkhead box P3
- IS
immunosuppressive
- mTOR
mechanistic/mammalian target of rapamycin
- mTORC
mTOR complex
- PMA
phorbol-12-myristate-13-acetate
- RAPA
rapamycin
- Th
T helper cell
- Treg
regulatory T cell
Footnotes
Disclosure
The authors of this manuscript have no conflicts of interest to disclose as described by the American Journal of Transplantation.
References
- 1.Thomson AW, Turnquist HR, Raimondi G. Immunoregulatory functions of mTOR inhibition. Nat Rev Immunol. 2009;9(5):324–337. doi: 10.1038/nri2546. [DOI] [PMC free article] [PubMed] [Google Scholar]
- 2.Powell JD, Pollizzi KN, Heikamp EB, Horton MR. Regulation of immune responses by mTOR. Annu Rev Immunol. 2012;30:39–68. doi: 10.1146/annurev-immunol-020711-075024. [DOI] [PMC free article] [PubMed] [Google Scholar]
- 3.Webster AC, Lee VW, Chapman JR, Craig JC. Target of rapamycin inhibitors (sirolimus and everolimus) for primary immunosuppression of kidney transplant recipients: a systematic review and meta-analysis of randomized trials. Transplantation. 2006;81(9):1234–1248. doi: 10.1097/01.tp.0000219703.39149.85. [DOI] [PubMed] [Google Scholar]
- 4.Guertin DA, Sabatini DM. The pharmacology of mTOR inhibition. Science signaling. 2009;2(67):pe24. doi: 10.1126/scisignal.267pe24. [DOI] [PubMed] [Google Scholar]
- 5.Thoreen CC, Kang SA, Chang JW, Liu Q, Zhang J, Gao Y, et al. An ATP-competitive mammalian target of rapamycin inhibitor reveals rapamycin-resistant functions of mTORC1. J Biol Chem. 2009;284(12):8023–8032. doi: 10.1074/jbc.M900301200. [DOI] [PMC free article] [PubMed] [Google Scholar]
- 6.Sarbassov DD, Ali SM, Kim D-H, Guertin DA, Latek RR, Erdjument-Bromage H, et al. Rictor, a novel binding partner of mTOR, defines a rapamycin-insensitive and raptor-independent pathway that regulates the cytoskeleton. Curr Biol. 2004;14(14):1296–1302. doi: 10.1016/j.cub.2004.06.054. [DOI] [PubMed] [Google Scholar]
- 7.Jacinto E, Loewith R, Schmidt A, Lin S, Rüegg MA, Hall A, et al. Mammalian TOR complex 2 controls the actin cytoskeleton and is rapamycin insensitive. Nat Cell Biol. 2004;6(11):1122–1128. doi: 10.1038/ncb1183. [DOI] [PubMed] [Google Scholar]
- 8.Sarbassov DD, Ali SM, Sengupta S, Sheen JH, Hsu PP, Bagley AF, et al. Prolonged rapamycin treatment inhibits mTORC2 assembly and Akt/PKB. Mol Cell. 2006;22(2):159–168. doi: 10.1016/j.molcel.2006.03.029. [DOI] [PubMed] [Google Scholar]
- 9.Feldman ME, Apsel B, Uotila A, Loewith R, Knight ZA, Ruggero D, et al. Active-site inhibitors of mTOR target rapamycin-resistant outputs of mTORC1 and mTORC2. PLoS Biol. 2009;7(2):e38. doi: 10.1371/journal.pbio.1000038. [DOI] [PMC free article] [PubMed] [Google Scholar]
- 10.Chresta CM, Davies BR, Hickson I, Harding T, Cosulich S, Critchlow SE, et al. AZD8055 is a potent, selective, and orally bioavailable ATP-competitive mammalian target of rapamycin kinase inhibitor with in vitro and in vivo antitumor activity. Cancer Res. 2010;70(1):288–298. doi: 10.1158/0008-5472.CAN-09-1751. [DOI] [PubMed] [Google Scholar]
- 11.Rosborough BR, Raich-Regue D, Matta BM, Lee K, Gan B, DePinho RA, et al. Murine dendritic cell rapamycin-resistant and rictor-independent mTOR controls IL-10, B7-H1, and regulatory T-cell induction. Blood. 2013;121(18):3619–3630. doi: 10.1182/blood-2012-08-448290. [DOI] [PMC free article] [PubMed] [Google Scholar]
- 12.Brown J, Wang H, Suttles J, Graves DT, Martin M. Mammalian target of rapamycin complex 2 (mTORC2) negatively regulates Toll-like receptor 4-mediated inflammatory response via FoxO1. J Biol Chem. 2011;286(52):44295–44305. doi: 10.1074/jbc.M111.258053. [DOI] [PMC free article] [PubMed] [Google Scholar]
- 13.Lee K, Gudapati P, Dragovic S, Spencer C, Joyce S, Killeen N, et al. Mammalian target of rapamycin protein complex 2 regulates differentiation of Th1 and Th2 cell subsets via distinct signaling pathways. Immunity. 2010;32(6):743–753. doi: 10.1016/j.immuni.2010.06.002. [DOI] [PMC free article] [PubMed] [Google Scholar]
- 14.Delgoffe GM, Pollizzi KN, Waickman AT, Heikamp E, Meyers DJ, Horton MR, et al. The kinase mTOR regulates the differentiation of helper T cells through the selective activation of signaling by mTORC1 and mTORC2. Nat Immunol. 2011;12(4):295–303. doi: 10.1038/ni.2005. [DOI] [PMC free article] [PubMed] [Google Scholar]
- 15.Turnquist HR, Cardinal J, Macedo C, Rosborough BR, Sumpter TL, Geller DA, et al. mTOR and GSK-3 shape the CD4+ T-cell stimulatory and differentiation capacity of myeloid DCs after exposure to LPS. Blood. 2010;115(23):4758–4769. doi: 10.1182/blood-2009-10-251488. [DOI] [PMC free article] [PubMed] [Google Scholar]
- 16.Matta BM, Raimondi G, Rosborough BR, Sumpter TL, Thomson AW. IL-27 production and STAT3-dependent upregulation of B7-H1 mediate immune regulatory functions of liver plasmacytoid dendritic cells. J Immunol. 2012;188(11):5227–5237. doi: 10.4049/jimmunol.1103382. [DOI] [PMC free article] [PubMed] [Google Scholar]
- 17.Turnquist HR, Zhao Z, Rosborough BR, Liu Q, Castellaneta A, Isse K, et al. IL-33 expands suppressive CD11b+ Gr-1(int) and regulatory T cells, including ST2L+ Foxp3+ cells, and mediates regulatory T cell-dependent promotion of cardiac allograft survival. J Immunol. 2011;187(9):4598–4610. doi: 10.4049/jimmunol.1100519. [DOI] [PMC free article] [PubMed] [Google Scholar]
- 18.Holt DW, Lee T, Jones K, Johnston A. Validation of an assay for routine monitoring of sirolimus using HPLC with mass spectrometric detection. Clin Chem. 2000;46(8 Pt 1):1179–1183. [PubMed] [Google Scholar]
- 19.Comas M, Toshkov I, Kuropatwinski KK, Chernova OB, Polinsky A, Blagosklonny MV, et al. New nanoformulation of rapamycin Rapatar extends lifespan in homozygous p53−/− mice by delaying carcinogenesis. Aging (Albany NY) 2012;4(10):715–722. doi: 10.18632/aging.100496. [DOI] [PMC free article] [PubMed] [Google Scholar]
- 20.Naing A, Aghajanian C, Raymond E, Olmos D, Schwartz G, Oelmann E, et al. Safety, tolerability, pharmacokinetics and pharmacodynamics of AZD8055 in advanced solid tumours and lymphoma. Br J Cancer. 2012;107(7):1093–1099. doi: 10.1038/bjc.2012.368. [DOI] [PMC free article] [PubMed] [Google Scholar]
- 21.Asahina H, Nokihara H, Yamamoto N, Yamada Y, Tamura Y, Honda K, et al. Safety and tolerability of AZD8055 in Japanese patients with advanced solid tumors; a dose-finding phase I study. Invest New Drugs. 2013;31(3):677–684. doi: 10.1007/s10637-012-9860-4. [DOI] [PubMed] [Google Scholar]
- 22.Pike KG, Malagu K, Hummersone MG, Menear KA, Duggan HME, Gomez S, et al. Optimization of potent and selective dual mTORC1 and mTORC2 inhibitors: the discovery of AZD8055 and AZD2014. Bioorg Med Chem Lett. 2013;23(5):1212–1216. doi: 10.1016/j.bmcl.2013.01.019. [DOI] [PubMed] [Google Scholar]
- 23.Huo HZ, Zhou ZY, Wang B, Qin J, Liu WY, Gu Y. Dramatic suppression of colorectal cancer cell growth by the dual mTORC1 and mTORC2 inhibitor AZD-2014. Biochem Biophys Res Commun. 2014;443(2):406–412. doi: 10.1016/j.bbrc.2013.11.099. [DOI] [PubMed] [Google Scholar]
- 24.Zhang L, You J, Sidhu J, Tejpal N, Ganachari M, Skelton TS, et al. Abrogation of chronic rejection in rat model system involves modulation of the mTORC1 and mTORC2 pathways. Transplantation. 2013;96(9):782–790. doi: 10.1097/TP.0b013e3182a2034f. [DOI] [PubMed] [Google Scholar]