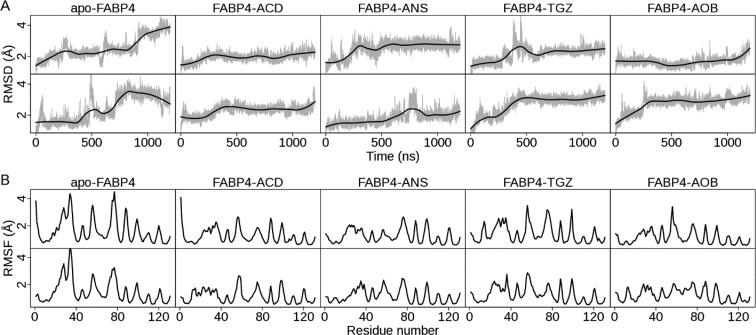
Figure 3.
Dynamic properties of five FABP4 structures in 1.2 μs MD simulations. For each structure, two MD trajectories are presented. The upper row is denoted as trajectory 1, and the lower row is trajectory 2, in accordance with Tables 1 and 2. (A) Time evolution of backbone RMSD with respect to the crystal structure. RMSD values of sampled structures are shown in gray. The smoothed line, computed with LOESS implemented in R v3.0, is shown in black. (B) Backbone RMSF per residue. RMSF values are calculated using PTRAJ implemented in Amber 11. All backbone heavy atoms in a residue are considered.

