Abstract
Aims:
To investigate the feasibility of discrete choice experiments for valuing EQ-5D-5L states using computer-based data collection, the consistency of the estimated regression coefficients produced after modeling the preference data, and to examine the similarity of the values derived across countries.
Methods:
Data were collected in Canada, England, The Netherlands, and the United States (US). Interactive software was developed to standardize the format of the choice tasks across countries, except for face-to-face interviewing in England. The choice task required respondents to choose between 2 suboptimal health states. A Bayesian design was used to generate 200 pairs of states that were randomly grouped into 20 blocks. Each respondent completed 1 block of 10 pairs. A main-effects probit model was used to estimate regression coefficients and to derive values.
Results:
Approximately 400 respondents participated from each country. The mean time to perform 1 choice task was between 29.2 (US) and 45.2 (England) seconds. All regression coefficients were statistically significant, except level 2 for Usual Activities in The Netherlands (P=0.51). Predictions for the complete set of 3125 EQ-5D-5L health states were similar for the 4 countries. Intraclass correlation coefficients between the countries were high: from 0.80 (England vs. US) through 0.98 (Canada vs. US).
Conclusions:
Derivation of value sets from the general population using computer-based choice tasks for the EQ-5D-5L is feasible. Parameter estimates were generally consistent and logical, and health-state values were similar across the 4 countries.
Key Words: EQ-5D-5L, health states, choice model, values, discrete choice experiment
One of the goals of the preference-based approach to quantifying health is to express overall health-related quality of life or health status in a single metric. These health-state values (also known as utilities, preference scores, or weights) are often combined with survival (ie, longevity) data to compute quality-adjusted life years. The latter summary measure is often used to inform economic evaluations of health care interventions.
Several techniques are used to elicit values for health states from individuals, notably the standard gamble, time trade-off (TTO), rating/visual analog scale, magnitude estimation, and person trade-off.1–3 Discrepancies between their outcomes, and a lack of consensus on which technique yields optimal results, continues to stimulate research into approaches to value health. Discrete choice models to quantify values of health states represent a growing area of interest. This approach builds upon an established practice of using ordinal responses to estimate interval or cardinal measures.4–8 Discrimination mechanisms are central to this measurement framework, and belong to the statistical class of probabilistic choice models. In quantifying health, this entails making choices between 2 or more health states or health profiles, depending on the objective.9
Choice models are grounded in modern measurement theory and are consistent with the random utility model in economic theory.9 All of these choice models are based on statistical techniques (eg, logit or probit regression models), and are used to establish the relative merit of 1 phenomenon with respect to others. If the phenomena have specific attributes (eg, health domains or attributes) with certain levels, extended choice models permit the estimation of their relative importance and of overall values for different combinations of attribute levels.10
As an international collaborative research group interested in health valuation, scientists involved in the EuroQol Group have experimented with health-valuation techniques, particularly the TTO, in developing value sets for the EQ-5D-3L.11 Perceived shortcomings of the current TTO protocol prompted experimentation with variants such as lead-time TTO.12 Parallel to this developmental work, the EuroQol Group also investigated a choice-based modeling approach to the valuation of health. This research was instigated by the development of a 5-level EQ-5D (the EQ-5D-5L), which expanded the number of levels from 3 to 5, each of which is labeled.13 The increase in the number of possible health states from 243 (in the 3L) to 3125 (in the EQ-5D-5L) prompted an interest in exploring the potential of discrete choice approaches.
This study had a 3-fold objective: (1) to examine the feasibility of choice experiments for EQ-5D-5L states using computer-based data collection; (2) to investigate the consistency of parameter estimates modeled from choice data; and (3) to explore the similarity of derived health-state values across different countries.
METHODS
Overview
A study design was developed and implemented in Canada, England, The Netherlands, and the United States (US) between September 2010 and August 2011. Values for EQ-5D-5L health states were elicited by means of TTO (not presented), visual analog scales (not presented), and a choice model based on paired comparisons. The responses were obtained through computer-based interviews (EuroQol Valuation Technology). This study was part of a larger pilot project that tested the performance of the software and IT infrastructure for running multinational online surveys.
EuroQol-5D-5L
The EQ-5D-5L descriptive system comprises the same 5 dimensions as the EQ-5D with 3 levels, that is, Mobility (MO), Self-Care (SC), Usual Activities (UA), Pain/Discomfort (PD), Anxiety/Depression (AD). However, in the EQ-5D-5L the level structure is expanded. In the EQ-5D-5L, each dimension has 5 levels: no problems, slight problems, moderate problems, severe problems, and extreme problems/unable to.13 On the basis of responses to the EQ-5D health-state classifier, a preference-based scoring function can be applied that generates a single value for health. The current study investigates the feasibility of an alternative method for a scoring function that could be used to derive values. However, the values reported are not endorsed by the EuroQol Group or intended to replace existing value sets.
Respondents
In each of the 4 countries, at least 400 persons participated in the study. Representative samples were recruited from the general population (stratified by age, education, and sex), with a minimum age of 18 years. For the US cohort participants were recruited from the Chicago area, a populous, ethnically diverse urban area. In the England study, the sample was recruited by approaching through email or telephone members of a panel of individuals (belonging to the agency responsible for the fieldwork) who had previously indicated a willingness to participate in research studies. In Canada, participants were recruited by random cold phone call in 2 multiethnic cities: Hamilton and Montreal. English was used as the survey language in Hamilton, whereas French was used in Montreal. In The Netherlands respondents were invited by telephone in the Amersfoort area by an agency. In Canada, The Netherlands, and the US, participants self-completed the tasks in groups with limited interviewer assistance (in particular intended for the TTO task). For these computer-based assessments, about 3 trained interviewers oversaw groups of approximately 15 respondents in 6–8 sessions per day. In England, identical software was used; however, a team of 8 home-based interviewers conducted the assessments in face-to-face interviews.14 Respondents were paid a small sum for completing the survey; the exact amount differed by country, ranging from $20 to $60.
Experimental Design
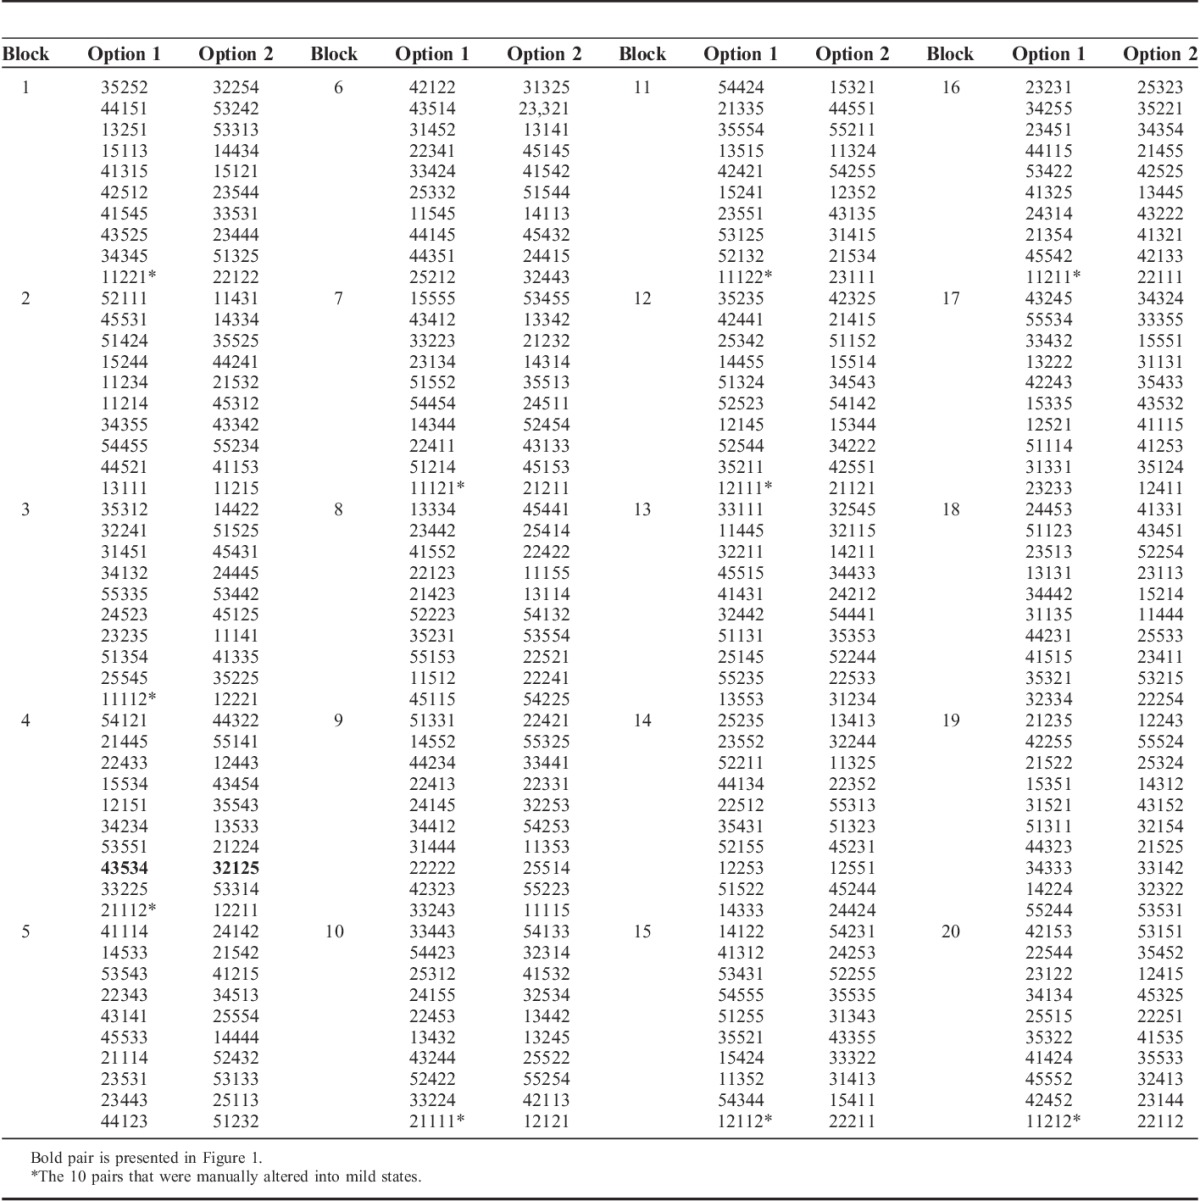
A Bayesian algorithm was used to generate an efficient design consisting of 200 paired comparisons (ie, 400 health states) for which priors were adapted based on an earlier study.15 Constraints were applied to get a “roughly” level-balanced design. The number of very mild states for the EQ-5D-5L generated by the algorithm was low, and some frequently observed health states were not included. Because this could lead to less precise estimates of the lower levels of the domains, 10 pairs were constructed manually and included in the design (ie, 1 or 2 domains at level 2, whereas the other levels are at level 1). The 200 paired comparisons were subdivided into 20 blocks so that each respondent would make 10 paired comparisons (Appendix). The order of the pairs and order within each pair were fully randomized within a digital setting by using a computer-assisted personal interview mode of administration: the EuroQol Valuation Technology.12 We were also able to examine the efficiency of the design by comparing the predicted health-state values of all pairs.
Data Collection
All respondents completed the exercises in the same sequence. First, the respondent was asked to complete the EQ-5D-5L measure for their own health as a warm-up exercise. Next, they were given the most simple response task in the framework of choice modeling: a paired comparison between 2 different EQ-5D health states (Fig. 1). They performed the 10 forced choice paired comparison tasks. These paired comparison tasks did not include “dead” or duration statements (see the Discussion section). No “status quo” or “opt-out” choices were offered.
FIGURE 1.
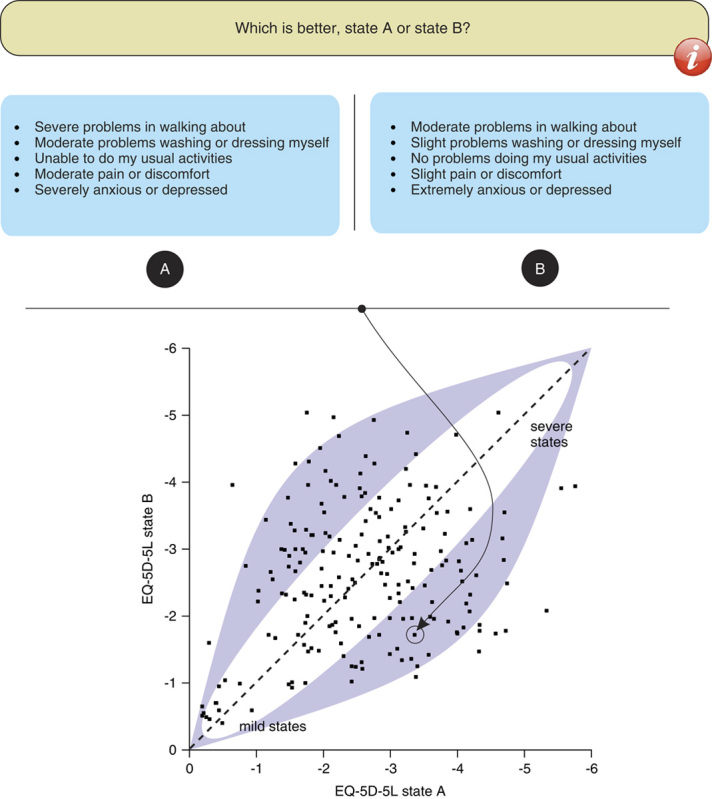
Example of the paired comparison task for the EQ-5D-5L (top) and the localization (based on logistic regression resulting in predictions for all 3125 EQ-5D-5L health states) of this pair (EQ-5D-5L states 43534 vs. 32125) in relation to the other 199 pairs (dashed 45-degree line indicates equal values for state A and B; x-axis and y-axis sorted on predicted values for all 3125 states); dark area roughly represents the combinations of the most informative pairs of health states (approximately 70% vs. 30% preferred by respondents), around diagonal (50% vs. 50%) and in the 2 corners (approximately 90% preference for one of the 2 health states) the noninformative pairs.
Analysis
The data were analyzed with a multinomial probit regression model (asmprobit, Stata) yielding parameter estimates (regression coefficients) and estimated values for each health state (applying these coefficients). The parameter estimates were relevant to evaluate the consistency of the discrete choice model and the similarity across countries, whereas the estimated values were only studied to examine similarity across countries. The main-effects model included 20 dummy variables representing level 2, 3, 4, and 5 for each of the 5 domains: MO, SC, UA, PD, and AD. It also included an alternative-specific constant, capturing a tendency to always choose the first option, which can be considered as an indicator of feasibility. Expressed in a formula, the model predicts latent values or utilities v of individuals choosing health state s; γ represents a single vector of unknown regression coefficients; and zrs indicates a vector of alternative-specific explanatory variables (eg, dummies) for individual r.
 |
Models were run separately by country to assess the degree of variability across settings. A model was also run on the pooled dataset, including all 4 countries with the same 20 dummies.
Logical ordering of parameter estimates in all countries was used as criterion to assess the consistency of the models. Differences in parameter estimates between countries were tested with independent t tests (pooled variance), where P<0.01 was considered statistically significant, to correct for multiple testing. Pearson correlations were estimated for the predicted 3125 EQ-5D-5L health-state values to express the similarity between the countries, as well as intraclass correlations (ICCs; 2-way mixed-effects, individual ratings, absolute agreement). In addition, graphs for the pooled data of the 4 countries combined with the data of the individual countries and their regression functions were made in SigmaPlot (version 11.0; Systat Software Inc., San Jose, CA) to investigate differences in constant and slope. Respondents were asked to rate the ease and clarity of the exercise using a 5-point Likert scale (1=agree, 5=disagree) and drop-out rates were computed.
RESULTS
Completion
The number of individuals who entered the survey was 547 for Canada, 404 for England, 407 for The Netherlands, and 417 for the US. A total of 1775 respondents completed all 17,750 paired comparisons. The number of judgments for each separate health state in the 4 countries ranged from 15 to 42 (median, 22.5; SD 2.68). In the Dutch study, 1 block of states (block 11) was not assessed due to a programming error.
Demographics
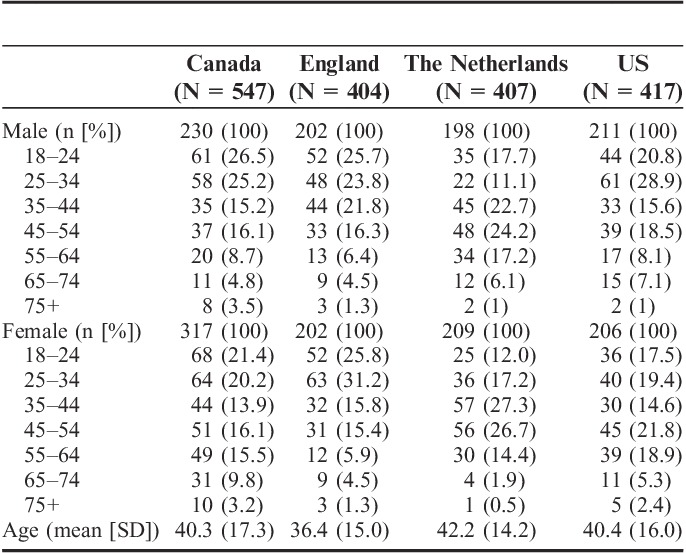
Age distribution was similar in the 4 countries, although The Netherlands had a smaller proportion of younger participants and a larger proportion of middle-aged ones (Table 1). The mean age in the entire dataset was 40 (SD 16) years, with a range of 18–100. Regarding sex, the differences between countries were modest. The samples closely matched the populations on these key characteristics. Additional demographic information was collected only for England and the US. The England sample included a larger proportion of degree-educated and employed individuals compared with the general population in England, but the sample was broadly representative of the general population in terms of other background characteristics, such as ethnicity.16 Among US respondents, 70.8% reported that they received education beyond high school; 65.8% were non-Hispanic white (n=273), 17.6% were African American (n=73), and 16.6% were all other ethnicities.
TABLE 1.
Characteristics of the 4 Samples
Feasibility
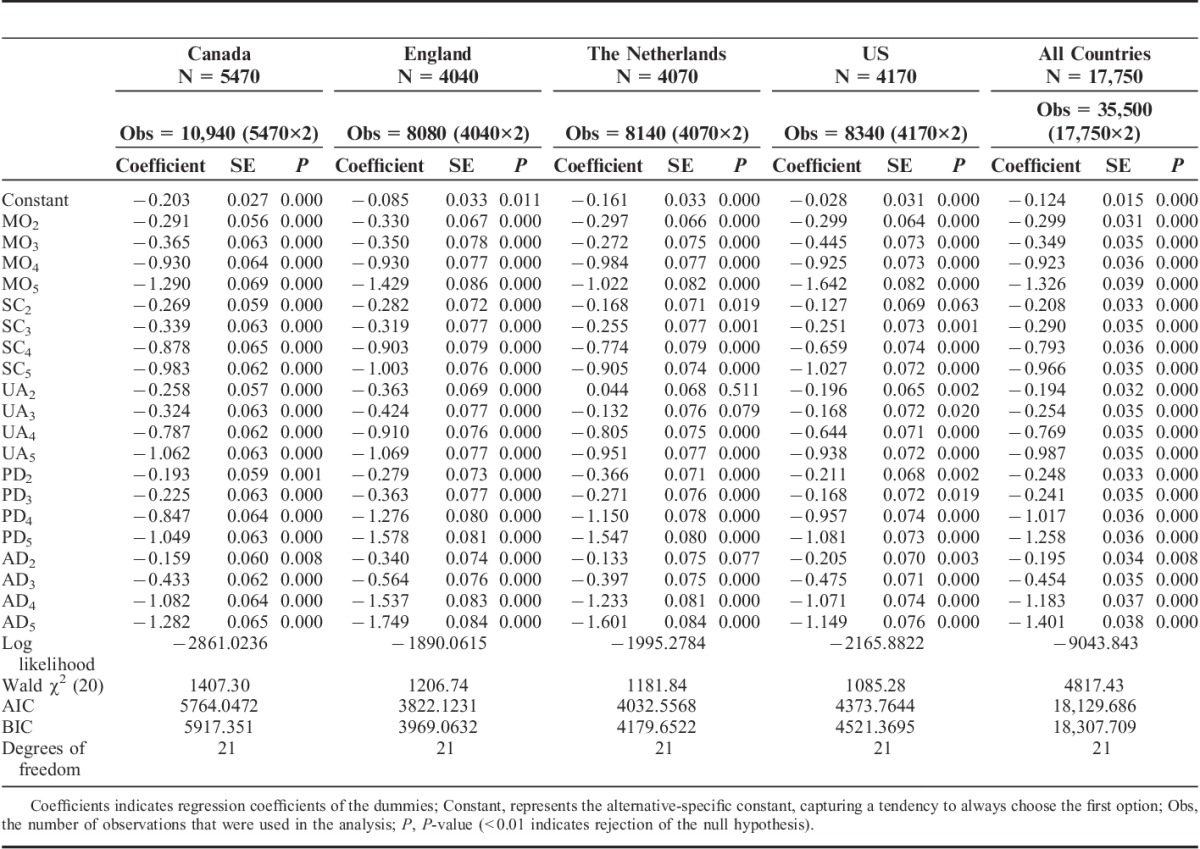
The drop-out (not completing all of the valuation tasks) was low in all countries (England 4, The Netherlands 14). For The Netherlands and England, the average duration (s) per task was 32.5 and 45.2, respectively. For Canada it was 35.85 (SD 39.50; minimum, 0.81; maximum, 494.1), and for the US it was 29.16 (SD 37.07; minimum, 0.91; maximum 332.88). Mean responses for Canada, England, The Netherlands, and US on the 4 feasibility questions were as follows: “The instructions that were given on the computer made it clear what I needed to do” 2.34, 2.27, 2.31, 2.31; “It was easy to understand the questions I was asked” 3.19, 3.60, 3.32, 3.09; “I found it difficult to decide” 3.87, 3.44, 3.60, 3.86; “I found it easy to tell the difference between the health states I was asked to think about” 2.63, 2.47, 2.60, 2.53. The alternative-specific constant parameter of the regression model (Table 2) showed a significant tendency among a subgroup of respondents in each country to choose the first health state.
TABLE 2.
Parameter Estimates (Probit Regression) for the 4 Countries Separately and the 4 Countries Together
Parameters of Choice Models
Four regression coefficients with illogical ordering were observed in the national datasets (The Netherlands: level 3 MO and PD were considered less severe than level 2; US: level 3 UA and PD was considered less severe than level 2) and one in the pooled data (levels 2 and 3 PD were reversed). The spread of parameter estimates within each domain of health consistently followed the same patterns across domains and across countries: levels 2 and 3 lowered the values slightly and levels 4 and 5 even more so. All 20 parameters were statistically significant in all countries, with the exception of level 2 for UA in The Netherlands (P=0.51) (Table 2).
In comparing the relative value weights assigned to each dimension, SC and UA were generally assigned less weight than the other 3 domains, although there were differences between countries. Dutch respondents were more concerned about severe and extreme PD and AD than about problems in the other domains. In the US, MO was the most important domain. Canada showed the least difference in impact per domain. Significant differences in coefficients were noted for PD level 4 (Canada vs. England: P<0.001) and level 5 (Canada vs. England, Canada vs. The Netherlands, England vs. US, and The Netherlands vs. US: P<0.001); AD level 4 (Canada vs. England, England vs. US: P<0.001) and level 5 (Canada vs. England, England vs. US, The Netherlands vs. US: P<0.001); MO level 5 (England vs. The Netherlands, The Netherlands vs. US (P<0.001), and Canada vs. US (P=0.001); and UA level 2 (Canada vs. The Netherlands, England vs. The Netherlands: P<0.001).
Likelihood ratio tests suggested that a pooled model offered a significantly worse fit to the data than a model with all parameters estimated separately for each country. Inclusion of interaction terms for all combinations of the 20 dummies with country (reference: England) revealed that 9 interactions were statistically significant (results not presented in Table 2). Seven of these involved the domains PD and AD on levels 4 and 5 for England and The Netherlands.
Separate analyses were performed for the 3 countries (Canada, England, US) in which the pairs of states from block 11 were excluded. Comparison with the Dutch sample showed that omitting those states led to somewhat higher P-values for the regression coefficients, particularly for levels 2 and 3. After the analyses without block 11, however, comparable differences remained between the 3 countries.
Similarity of Health-State Values
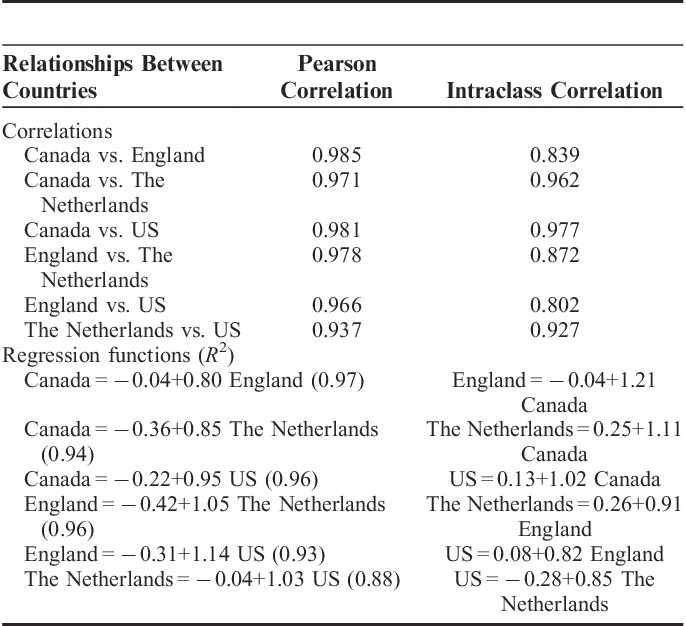
The cross-country comparison of predictions for the complete set of 3125 EQ-5D-5L states demonstrated strong agreement across the 4 countries (ICC=0.89) (Fig. 2). Point estimates for agreement between any 2 countries were strong (ICC>0.5), ranging from 0.80 for England versus US to 0.98 for Canada versus US. However, wider confidence intervals were observed among the countries with lower ICCs. Pearson correlation coefficients reflected strength of agreement among 4 countries compared with the ICC results (Table 3).
FIGURE 2.
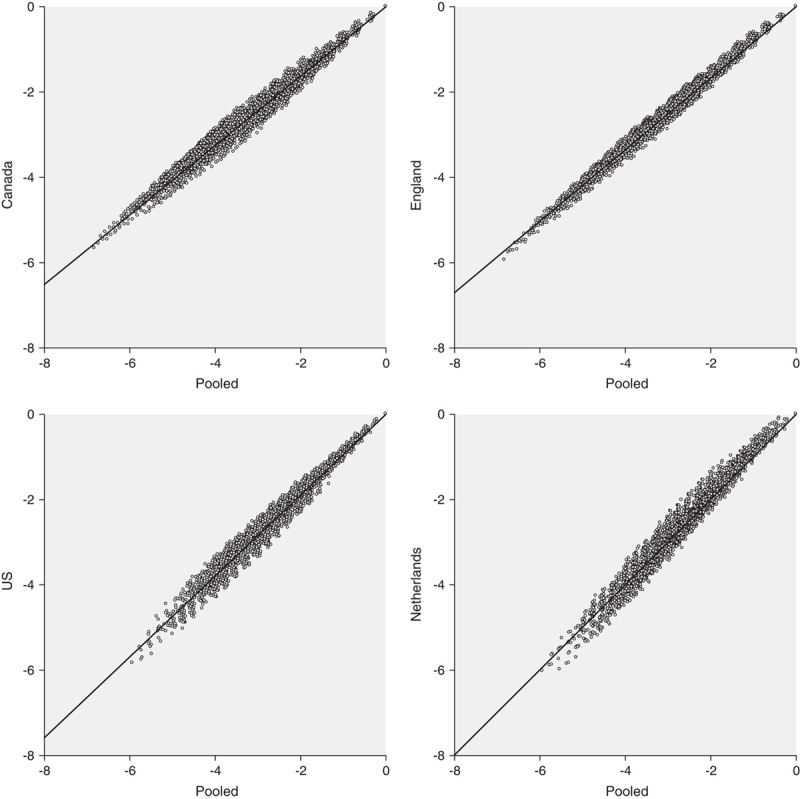
Relationships between the 3125 estimated (choice model, asmprobit) EQ-5D-5L values (0=best health state) for the 4 countries compared with the pooled results of the 4 countries (x-axis).
TABLE 3.
Correlations, Intraclass Correlations, and Regression Functions Between the 4 Countries Based on the 3125 Estimated EQ-5D-5L Health States
Design Efficiency
The predicted values of the health states suggested that the assumptions underlying the efficient design (plus the manual changes that were made to it) were reasonable. The pooled predictions for the 400 states that were part of the 200 paired comparison tasks showed that many separate health states of the paired comparison tasks fulfilled efficient design assumptions (approximately 70% vs. 30% preference). However, many paired comparison tasks also consisted of health states that were relatively close to each other in attributed value (Fig. 1).
DISCUSSION
We found that it was feasible to implement a standardized protocol for computer-based assessment of a choice-based selection of health states for the EQ-5D-5L across countries. Models generated parameter estimates that logically supported the structure of the descriptive system and values for EQ-5D-5L health states strongly agreed across countries, with only minor differences across the 4 countries.
Feedback from respondents indicated that they understood the tasks and interviewers did not report any concerns about the acceptability of the choice-based tasks. Most respondents completed the paired comparisons, and few complained about the difficulty of the information they had to retain and compare. The number of complete responses was also high. Nevertheless, the feasibility questions revealed that choosing between the 2 options was not considered an easy task. In addition, the constant in the model indicates that a proportion of the respondents were not performing the tasks carefully. Further research is needed to better understand the thought processes of respondents.
We expected logical ordering of coefficients in all countries, but observed a few inconsistencies. These were all related to illogical ordering from level 2 to level 3 and may be a result of our modest sample size in each country or other unidentified reasons. Examining the parameter estimates across countries revealed high levels of agreement in the value (overall impact) of the various dimensions. However, differences between countries were observed, and likelihood ratio tests supported separate models by country rather than a single pooled model. Large confidence intervals in agreement based on ICCs between England and the other 3 countries suggest a structural difference between data from England and the other countries.
After raising the number of levels in the EQ-5D from 3 to 5, the differences between EQ-5D-5L states proved to be more subtle. Five-level states are much harder to think about than 3-level states, and a paired comparison of EQ-5D-5L states that differ only subtly is more difficult than the task using the previous version (EQ-5D-3L). In addition, the Bayesian approach to determine the set of paired comparisons was programmed in such a way that choice between states for these pairs would produce a high level of information but also make it harder to choose.
Choice modeling is a promising avenue for health-state valuation. There is a revival of interest in these methods due to the relative simplicity of eliciting ordinal responses and a widening range of analytic tools to accommodate them.7,17–21 One previous study suggested that choice models have a practical advantage: when conducting choice experiments, health states may be evaluated in a self-completion format using online panels.22 This study confirmed that result. In the English arm of this study, data were obtained through face-to-face interviews. In the other 3 countries, data were collected largely in a self-completion format. Nonetheless, we observed no appreciable differences between England and the other countries in data quality (ie, number of complete responses, duration). This means that valuation studies based on discrete choices appear to have an important advantage over TTO techniques because the latter require face-to-face interviews to produce data of reasonable credibility.14
One of the most serious limitations of choice-based models is that they produce relative values. Although differences between the values are meaningful, the positions of the top and bottom values are not interpretable. That is, they are on an undefined scale (without meaningful anchors such as 0=dead and 1=full health). Several attempts have been made to resolve this issue.15,17,23,24
A limitation of our study may be that interaction terms were not included in the modeling, yet they may be found in the available data. We refrained from this analysis because the design was generated for main effects only. Other studies have shown that interactions may be present. This effect seems moderate; however, and to capture it would require a more elaborate study.17 Another limitation is the disability to generalize to older individuals and to those with low education, as these were less represented in our study samples.
The paired comparisons offered to respondents in this study did not specify the duration of the states. It is possible that the respondents imposed their own ideas about the duration of the states when making the paired comparisons. Such concealed ideas about time are probably diverse among the population, theoretically increasing systematic errors and may be biasing the obtained health-state values. However, as the 2 states in each of pairs were similar in the present study, a duration statement may have minimal impact on the responses. From a measurement perspective, it may be better to describe the subject of interest (eg, health states) as uniformly and distinctively as possible.25(p4)
Interest in cross-country variation in health-state valuations is growing. There is some evidence that the results from one country cannot be transferred to other countries.26–29 These studies suggest that differences exist in the values given to the same states. However, it is hard to say whether any differences in these values are due to cultural notions, methodological differences, or to translational issues (eg, Dutch wording may make levels 2 and 3 seem closer together than in other language versions). In this study, the 5 levels in the Dutch and French (Canada) language EQ-5D-5L may not exactly match the 5 levels in the English language EQ-5D-5L because of language differences.14 Interestingly, a recent study to measure disability weights for a wide array of health outcomes across a diverse range of populations showed that, based on the same measurement framework that we used in our study, the differences between countries were modest.30
To conclude, parameter estimates modeled from a choice-based approach were generally consistent and logical, although some deviations were observed. The estimated values were similar between the countries, and the differences may be attributed to the administration of the valuation exercise in different countries, and also due to cultural differences. Overall, results indicated that it is feasible to collect valid paired comparison data with limited interviewer assistance, supporting the possibility of data collection by means of online panels.
ACKNOWLEDGMENT
This work is partially based on inspiring discussions and reflections during several meetings of the EuroQol Valuation Task Force. Therefore, the authors wish to express their thanks to Frank de Charro in particular.
APPENDIX A
TABLE A1.
Final Set of 200 Pairs of EQ-5D-5L Health States for the Choice Experiment
Footnotes
This research was made possible by a grant from the EuroQol Group. Data collection in England was funded by Department of Health Policy Research Programme Grant PRP 070-0065.
Part of this work was presented during a workshop at the ISPOR 14th European Congress, Madrid, Spain, November 6, 2011.
The authors declare no conflict of interest.
REFERENCES
- 1.Froberg DG, Kane RL. Methodology for measuring health-state preferences—II: scaling methods. J Clin Epidemiol. 1989;42:459–471 [DOI] [PubMed] [Google Scholar]
- 2.Torrance GW, Feeny DH, Furlong WJ. Visual analog scales: do they have a role in the measurement of preferences for health states? Med Decis Making. 2001;21:329–334 [DOI] [PubMed] [Google Scholar]
- 3.Ryan M, Scott DA, Reeves C, et al. Eliciting public preferences for healthcare: a systematic review of techniques. Health Technol Assess. 2001;5:1–186 [DOI] [PubMed] [Google Scholar]
- 4.Thurstone LL. A law of comparative judgments. Psychol Rev. 1927;34:273–286 [Google Scholar]
- 5.Kind P. A comparison of two models for scaling health indicators. Int J Epidemiol. 1982;11:271–275 [DOI] [PubMed] [Google Scholar]
- 6.Salomon JA. Reconsidering the use of rankings in the valuation of health states: a model for estimating cardinal values from ordinal data. Popul Health Metr. 2003;1:12. [DOI] [PMC free article] [PubMed] [Google Scholar]
- 7.Kind P.Kind P, Brooks R, Rabin R. Applying paired comparisons models to EQ-5D valuations—deriving TTO utilities from ordinal preference data. EQ-5D Concepts and Methods: A Developmental History. 2005Dordrecht: Springer;201–220 [Google Scholar]
- 8.Krabbe PFM. Thurstone scaling as a measurement method to quantify subjective health outcomes. Med Care. 2008;46:357–365 [DOI] [PubMed] [Google Scholar]
- 9.Arons AMM, Krabbe PFM. Probabilistic choice models in health-state valuation research: background, theory, assumptions and relationships. Expert Rev of Pharmacoecon Outcomes Res. 2013;13:93–108 [DOI] [PubMed] [Google Scholar]
- 10.McFadden D.Zarembka P. Conditional logit analysis of qualitative choice behavior. Frontiers in Econometrics. 1974New York: Academic Press;105–142 [Google Scholar]
- 11.Dolan P. Modeling valuations for EuroQol health states. Med Care. 1997;35:1095–1108 [DOI] [PubMed] [Google Scholar]
- 12.Oppe M, Devlin N, van Hout B, et al. A programme of methodological research to arrive at the new international EQ-5D-5L valuation protocol. Value Health. 2014;17:445–453 [DOI] [PubMed] [Google Scholar]
- 13.Herdman M, Gudex C, Lloyd A, et al. Development and preliminary testing of the new five-level version of EQ-5D (EQ-5D-5L). Qual Life Res. 2011;20:1727–1736 [DOI] [PMC free article] [PubMed] [Google Scholar]
- 14.Shah KK, Lloyd A, Oppe M, et al. One-to-one versus group setting for conducting computer-assisted TTO studies: findings from pilot studies in England and the Netherlands. Eur J Health Econ. 2013;14supplS65–S73 [DOI] [PMC free article] [PubMed] [Google Scholar]
- 15.Stolk EA, Oppe M, Scalone L, et al. Discrete choice modeling for the quantification of health states: the case of the EQ-5D. Value Health. 2010;13:1005–1013 [DOI] [PubMed] [Google Scholar]
- 16. Census: standard area statistics (England and Wales). Office for National Statistics, 2001. Available at: http://www.neighbourhood.statistics.gov.uk/dissemination. Accessed July 18, 2014.
- 17.Bansback N, Brazier J, Tsuchiya A, et al. Using a discrete choice experiment to estimate health state utility values. J Health Econ. 2012;31:306–318 [DOI] [PubMed] [Google Scholar]
- 18.Ratcliffe J, Brazier J, Tsuchiya A, et al. Using DCE and ranking data to estimate cardinal values for health states for deriving a preference-based single index from the sexual quality of life questionnaire. Health Econ. 2009;18:1261–1276 [DOI] [PubMed] [Google Scholar]
- 19.McKenzie L, Cairns J, Osman L. Symptom-based outcome measures for asthma: the use of discrete choice methods to assess patient preferences. Health Policy. 2001;57:193–204 [DOI] [PubMed] [Google Scholar]
- 20.McCabe C, Brazier J, Gilks P, et al. Using rank data to estimate health state utility models. J Health Econ. 2006;25:418–431 [DOI] [PubMed] [Google Scholar]
- 21.Krabbe PFM. A generalized measurement model to quantity health: the multi-attribute preference response model. PLoS One. 2013;8:e79494. [DOI] [PMC free article] [PubMed] [Google Scholar]
- 22.Mulhern B, Longworth L, Brazier J, et al. Binary choice health state valuation and mode of administration: head-to-head comparison of online and CAPI. Value Health. 2013;16:104–113 [DOI] [PMC free article] [PubMed] [Google Scholar]
- 23.Stalmeier PFM, Lamers LM, Busschbach van JJ, et al. On the assessment of preferences for health and duration: maximal endurable time and better than dead preferences. Med Care. 2007;45:835–841 [DOI] [PubMed] [Google Scholar]
- 24.Arons AMM, Krabbe PFM. Quantification of health by scaling similarity judgments. PLoS One. 2014;9:e89091. [DOI] [PMC free article] [PubMed] [Google Scholar]
- 25.Nunnally JC, Bernstein IH. Psychometric Theory. 1994New York: McGraw-Hill [Google Scholar]
- 26.Greiner W, Weijnen T, Nieuwenhuizen M, et al. A single European currency for EQ-5D health states: results from a six-country study. Eur J Health Econ. 2003;4:222–231 [DOI] [PubMed] [Google Scholar]
- 27.König HH, Bernert S, Angermeyer MC, et al. Comparison of population health status in six European countries: results of a representative survey using the EQ-5D questionnaire. Med Care. 2009;47:255–261 [DOI] [PubMed] [Google Scholar]
- 28.Knies S, Evers SM, Candel MJ, et al. Utilities of the EQ-5D: transferable or not? Pharmacoeconomics. 2009;27:767–779 [DOI] [PubMed] [Google Scholar]
- 29.Luo N, Li M, Chevalier J, et al. A comparison of the scaling properties of the English, Spanish, French, and Chinese EQ-5D descriptive systems. Qual Life Res. 2013;22:2237–2243 [DOI] [PubMed] [Google Scholar]
- 30.Salomon JA, Vos T, Hogan DR, et al. Common values in assessing health outcomes from disease and injury: disability weights measurement study for the Global Burden of Disease Study 2010. Lancet. 2012;380:2129–2143 [DOI] [PMC free article] [PubMed] [Google Scholar]


