

On exocytosis, membrane fusion starts with the formation of a narrow fusion pore that must expand to allow the release of secretory compounds. The GTPase Cdc42 promotes fusion pore dilation in neuroendocrine cells by controlling membrane tension.
Abstract
Membrane fusion underlies multiple processes, including exocytosis of hormones and neurotransmitters. Membrane fusion starts with the formation of a narrow fusion pore. Radial expansion of this pore completes the process and allows fast release of secretory compounds, but this step remains poorly understood. Here we show that inhibiting the expression of the small GTPase Cdc42 or preventing its activation with a dominant negative Cdc42 construct in human neuroendocrine cells impaired the release process by compromising fusion pore enlargement. Consequently the mode of vesicle exocytosis was shifted from full-collapse fusion to kiss-and-run. Remarkably, Cdc42-knockdown cells showed reduced membrane tension, and the artificial increase of membrane tension restored fusion pore enlargement. Moreover, inhibiting the motor protein myosin II by blebbistatin decreased membrane tension, as well as fusion pore dilation. We conclude that membrane tension is the driving force for fusion pore dilation and that Cdc42 is a key regulator of this force.
INTRODUCTION
Water-soluble hormones and neurotransmitters are stored in secretory vesicles. To be exocytosed, secretory vesicles must be transported to the cell periphery, dock to the plasma membrane, and undergo a priming reaction that enables them to fuse upon calcium elevation (Sorensen, 2009). Exocytosis—fusion of the secretory vesicle membrane with the plasma membrane—begins with the opening of an aqueous fusion pore that connects the vesicle lumen with the extracellular space. Nascent fusion pores flicker, indicating that the transition between hemifusion and fusion does not require a great deal of energy and that fusion pore dilation is not spontaneous. Instead, a higher energy barrier must be overcome before the fusion pore can enlarge (Chernomordik and Kozlov, 2008).
According to the extent of fusion pore dilation, two modes of fusion have been described: 1) full-collapse fusion, during which the pore fully dilates and the vesicle membrane collapses into the plasma membrane, and 2) kiss-and-run or partial release, in which the fusion pore remains narrow and may be resealed (Fulop et al., 2005; Harata et al., 2006; Balaji and Ryan, 2007; Vardjan et al., 2007; Doreian et al., 2008; Zhang et al., 2009). The balance between the two modes, which is regulated by the strength of the stimulus (Fulop et al., 2005; Elhamdani et al., 2006; Vardjan et al., 2007; Gerachshenko et al., 2009), controls the kinetics of release, as well as the nature of the secreted products. Molecules that are large or packed into a dense matrix can only be released by full fusion (Takahashi et al., 2002; Michael et al., 2006). In general, full-collapse fusion reactions are needed in protein trafficking, as well as in cell-to-cell fusion during fertilization and development.
The mechanisms that control fusion pore dilation remain largely unknown. Theoretical studies suggest that membrane tension could drive fusion pore dilation (Amatore et al., 2000; Chizmadzhev et al., 2000; Katsov et al., 2004; Grafmuller et al., 2007; Chernomordik and Kozlov, 2008), and osmotic forces have indeed been shown to promote the fusion of artificial lipid bilayers (Cohen et al., 1984). Whether membrane tension is a major determinant of fusion pore kinetics in live cells has not been demonstrated.
The small GTPase Cdc42 is activated by secretory stimuli (Gasman et al., 2004; Malacombe et al., 2006; Wang et al., 2007) and promotes the secretion of peptidic hormones by neuroendocrine cells (Gasman et al., 2004; Malacombe et al., 2006; Sato et al., 2012) and insulin-secreting cells (Wang et al., 2007). Inhibiting phosphoinositide-3 kinase promotes secretory granule (SG) recruitment at the cell periphery by a mechanism that involves Cdc42-dependent actin reorganization (Wen et al., 2011). Sato et al. (2012) also found that inhibiting Cdc42 had some effect on SG recruitment at the cell periphery. However, this effect was moderate and could not account for the severe impairment of exocytosis observed by this group. Therefore the step at which Cdc42 regulates exocytosis remains unclear. In this study, we analyzed the effect of Cdc42 silencing on the secretory process and found that Cdc42 knockdown selectively compromises the enlargement of the fusion pore. We further investigated the effect of Cdc42 on membrane tension and the relationship between membrane tension and fusion pore dynamics. This work demonstrates that membrane tension is the driving force for fusion pore dilation in live cells and identifies Cdc42 and myosin II as major regulators of this force.
RESULTS
Cdc42 promotes fast release without altering secretory vesicle recruitment and docking at the plasma membrane
To elucidate the role of Cdc42 in the secretory process, we first monitored SG trafficking and exocytosis in enterochromaffin BON cells silenced or not for Cdc42. Human BON cells are derived from a pancreatic metastasis of a gut neuroendocrine tumor (Evers et al., 1991). These cells store serotonin and various peptides in SGs and secrete them upon stimulation. SGs were labeled by expressing green fluorescent protein– or monomeric red fluorescent protein–tagged neuropeptide Y (NPY-GFP and NPY-mRFP, respectively) and imaged by total internal reflection fluorescence microscopy (TIRFM). Full-fusion events can be easily detected due to their typical signature in TIRFM: a transient elevation of SG fluorescence is followed by a rapid decay as NPY-GFP diffuses into the external medium, which can be captured as a fluorescent halo (Figure 1A). Complete release is typically achieved in <200 ms (Figure 1A; also see Figure 6, A–D, later in the article). Two silencing RNA duplexes (siRNAs) that significantly reduced Cdc42 levels (Figure 1B) decreased the number of SG full-fusion events (Figure 1, C and D, and Supplemental Videos S1–S3). Coexpression of Cdc42 constructs insensitive to siCdc42-A (rescue-A) or siCdc42-C (rescue-C) restored at least partially the secretory responses, arguing against off-target effects of the siRNAs (Figure 1, C and D). Consistently, overexpression of a dominant negative Cdc42 construct (N17) also reduced the occurrence of full-fusion events (Figure 1E). These observations are in agreement with results obtained in PC12 cells (Gasman et al., 2004; Malacombe et al., 2006; Sato et al., 2012). In our experiments, secretion was triggered by ionomycin, a calcium ionophore that bypasses calcium channels, ruling out the possibility that the observed inhibition of exocytosis resulted from decreased calcium entry. Cdc42 knockdown induced a slight and nonsignificant reduction in the density of SGs in the juxtamembrane area, as measured by TIRFM (Figure 1, F and G), and did not change the colocalization of NPY-mRFP with Rab27a, a marker of SGs (Desnos et al., 2003) on confocal images (Figure 1, H and I), indicating that the biogenesis of SGs and their accumulation at the cell periphery were not significantly impaired.
FIGURE 1:

Cdc42 knockdown impairs full fusion but has little effect on SG recruitment at the plasma membrane. BON cells were transfected with a vector encoding NPY tagged with a fluorescent protein (mRFP, GFP, or pHluorin, a pH-sensitive GFP variant) and with control or siCdc42 siRNA duplexes. (A) A typical full-collapse exocytotic event captured by TIRFM. The fluorescence of the vesicular content marker NPY-GFP briefly increases upon exocytosis (arrow) and then decays to background levels as NPY-GFP diffuses. Bar, 1 μm. Time is indicated in milliseconds. In this example, the acquisition rate was >10 Hz, as used elsewhere in this study. (B) A representative Western blot showing reduced Cdc42 levels (arrowhead) in siCdc42-A– and siCdc42-C–treated BON cells. The observed reduction was 90.1 ± 2.7% (p < 0.001) with siCdc42-A (n = 8 independent experiments) and 68.9 ± 12.7% (p < 0.001) with siCdc42-C (n = 10 independent experiments). Tubulin staining (arrow) was used to normalize the Cdc42 signal. (C, D) Cdc42 knockdown decreases the number of full-fusion events. The mean (±SEM) number of events observed per cell in the different conditions: cells treated with control (luciferase-targeting siRNAs), siCdc42-A (C), or siCdc42-C (D) siRNAs. Coexpressing HA-tagged Cdc42 constructs insensitive to siCdc42-A (rescue-A) or to siCdc42-C (rescue-C) restored at least partially the secretory responses. For imaging, cells were selected on the basis of their NPY-mRFP fluorescence. Rescue-A and rescue-C were not visible in live cells, but control experiments revealed that they were consistently expressed in cells cotransfected with NPY-mRFP. The number of analyzed cells is indicated in the bars. **p < 0.01; ***p < 0.001 (Kruskal–Wallis followed by Dunn's test); ns, non significant. (E) Overexpression of mCherry-tagged Cdc42-N17, but not mCherry-Cdc42 WT, decreases the occurrence of full-fusion events compared with control cells expressing only mCherry. (F, G) The spatial distribution of SGs was analyzed by TIRFM under resting conditions in control or siCdc42-treated cells. (F) Representative images. (G) The juxtamembrane SG density was not significantly affected by Cdc42 knockdown (n = 18 cells from three independent experiments in each group). The size of cell footprints was not modified by Cdc42 silencing. (H, I) Confocal imaging of BON cells revealed that the majority of NPY-mRFP–positive structures are also labeled by GFP-Rab27a, which is associated with the cytoplasmic side of the SG membrane. This proportion was not affected by Cdc42 knockdown, as indicated by the quantification shown in I (mean ± SEM; n = 12 cells in each condition), suggesting unimpaired SG biogenesis. Representative images of SiCdc42-C-treated cells. Insets are zoomed-in views of the boxed areas. Bar, 5 μm. (J) Single SGs imaged by TIRFM were tracked, and the Dxy values were computed along trajectories using a rolling analysis window. Subtrajectories characterized by a Dxy lower than the threshold value of 5 × 10⁻⁴ μm2/s were defined as an immobilization period. A survival plot of immobilization events is shown. Control, 19 cells, 2978 trajectories; siCdc42-A, 18 cells, 2283 trajectories; siCdc42-C, 17 cells, 2917 trajectories; from three independent experiments. Data were fitted with the sum of two exponentials. Cdc42 silencing did not significantly alter SG immobilization, suggesting unimpaired SG attachment at the plasma membrane.
FIGURE 6:

A dual-color TIRFM assay to measure the dynamics of the fusion pore. BON cells expressing both NPY-mRFP and NPY-pHluorin were stimulated with ionomycin and imaged by dual-color TIRFM. (A) Cartoons and time-series images (10 Hz) showing the behavior of pH-insensitive (mRFP, red, top) and pH-sensitive (pHluorin, green, bottom) vesicular content markers upon full-collapse fusion. Fast diffusion of fluorescent markers in the external medium is captured as a fluorescent halo surrounding the SG and leads to complete disappearance of SG fluorescence. In kiss-and-run events (B, C), the pore does not fully enlarge, and NPY-mRFP is slowly (B) or not (C) released; in some cases, the pore reseals (C), leading to reacidification of the SG, as indicated by a decay of the green signal. (D) Mean (±SEM) time course of the fluorescence (arbitrary units) of events associated with (red) or without (blue) a fluorescent halo. (E–G) Cdc42 knockdown increases the fraction of kiss-and-run events (p < 0.0001, Kruskal–Wallis followed by Dunn's test; **p < 0.01; ***p < 0.001). These values were measured in each cell, normalized to the mean value found in control cells, and averaged over the different cells from the same group. The number of analyzed cells is indicated in the bars or above the boxes. NS, nonsignificant. Both effects are rescued by expressing a Cdc42 construct insensitive to siCdc42-A (E, rescue-A) or to siCdc42-C (F, rescue-C). In these experiments, the mean (±SEM) percentage of kiss-and-run events in control cells was 26.6 ± 2.3%. (G) Cdc42 knockdown increased the duration of the pHluorin signal. Cumulative distribution of the pHluorin signal duration measured using an automatic routine. A total of 2746 (control), 1595 (siCdc42-A), 1193 (rescue-A), 727 (siCdc42-C), and 394 (rescue-C) events were automatically analyzed. (H) Expressing a dominant negative Cdc42 construct (mCherry-Cdc42-N17) decreased the fraction of kiss-and-run events, whereas expressing WT Cdc42 had no significant effect. Whiskers in box plots indicate 10th–90th percentiles. Scale bars, 1 μm.
The next step, for SGs that have been transported to the cell periphery, is to dock to the plasma membrane, a process that leads to their immobilization. Previous studies indicated that SG docking can be inferred from SG mobility and that stalled SGs are attached at the plasma membrane (Huet et al., 2006, 2012; Desnos et al., 2007; Nofal et al., 2007; Karatekin et al., 2008; Yizhar and Ashery, 2008). To determine whether Cdc42 silencing affects vesicle docking, we therefore tracked single SGs, computed their lateral diffusion coefficient, Dxy, along trajectories, and analyzed immobilization periods (Desnos et al., 2007; Huet et al., 2012). Although Cdc42 silencing reduced SG exocytosis, it did not significantly affect SG immobilization (Figure 1J). In particular, the number of stalling periods >5 s, which cannot be accounted for by slow random walk (Huet et al., 2012), was not reduced. One might argue that immobile SGs might be tethered to the actin network. However, actin structures are not immobile (Huet et al., 2012). Moreover, a reduction in SG docking would be expected to reduce the time spent by SGs in the subplasmalemmal region and thus their density measured by TIRFM (Huet et al., 2012). Therefore, in agreement with previous observations (Sato et al., 2012), our data indicate that inhibiting Cdc42 has little effect on SG recruitment at the cell periphery and no significant effect on SG docking but severely impairs full fusion, suggesting that the main effect of Cdc42 on exocytosis takes place at a postdocking stage.
Cdc42 regulates fusion pore dynamics
Next we monitored exocytosis in BON cells with a submillisecond time resolution using carbon fiber amperometry (Chow et al., 1992; Fisher et al., 2001; Amatore et al., 2003; Desnos et al., 2003). This technique, which involves carbon fiber electrodes apposed onto the cell surface, measures the oxidation of serotonin molecules released upon exocytosis and reports single fusion events as current spikes. Typical recordings are shown in Figure 2A. To evaluate the secretory activity, amperometric spikes >0.4 pA, that is, five times the magnitude of the root mean square electrical noise, were automatically counted. In sharp contrast with data obtained by TIRFM, we could detect only subtle or nonsignificant reduction of the occurrence of exocytosis in Cdc42-knockdown cells compared with control cells (Figure 2C). Amperometric recordings thus suggest that Cdc42 knockdown had little effect on the probability of fusion. However, in agreement with the defect in release observed by TIRFM, these recordings revealed that the number of large spikes (>4 pA) was severely decreased by both siCdc42-A and siCdc42-C (Figure 2D). The expression of a Cdc42 construct insensitive to siCdc42-A partially rescued the effect of siCdc42-A on exocytosis (Figure 2, C and D), arguing against off-target effects of the siRNAs.
FIGURE 2:

Cdc42 knockdown reduces the occurrence of large spikes but not the overall probability of exocytosis. (A) Representative amperometric recordings of ionomycin-stimulated BON cells. Each spike reports an exocytotic event. (B) Enlarged view of a part (boxed area) of the bottom trace shown in A. Stars highlight events characterized by an irregular shape suggestive of fast fluctuations of the pore size. (C, D) Cumulative number of exocytotic events observed in stimulated BON cells treated with control siRNAs, siCdc42-A, or siCdc42-C, as indicated. Spikes were counted as an event when their height was >0.4 pA (C) or >4 pA (D). The significance of the differences was computed using a Kruskal–Wallis test followed by a Dunn's test for multiple comparisons. *p < 0.05; ***p < 0.001. Expressing a Cdc42 construct insensitive to siCdc42-A (rescue-A) reduced the effect of Cdc42 knockdown. Comparing siCdc42-A and rescue-A with a Mann–Whitney test yielded p = 0.0056 and 0.0207 in C and D, respectively. The number of cells is indicated in the bars.
Because fast and complete fusion pore dilation facilitates diffusion of serotonin from the SG matrix to the electrode and thus the appearance of high-amplitude amperometric spikes, a likely interpretation of our data is that Cdc42 knockdown impairs fusion pore dilation. We therefore analyzed the shape of individual amperometric spikes in more detail. The distribution of the spike height value, Imax, which reflects the maximal flux of serotonin through the fusion pore, was shifted toward lower values in BON cells treated with siCdc42-A (Figure 3A) or siCdc42-C (Figure 3E) compared with control cells. This effect was partially rescued by expressing Cdc42-rescue-A, which is insensitive to siCdc42-A (Figure 3I). Similarly, the amount of released serotonin (the spike integral, Q; Figure 3, B, F, and J) was reduced in Cdc42-silenced cells compared with control ones. Using an analysis of variance (ANOVA) model for repeated measures (see Materials and Methods), we found that the statistical significance of the differences in Imax and Q was very high (Figure 3). Moreover, we performed additional, stringent statistical analysis by computing the mean value of the different parameters in each cell and comparing the averaged values (Figure 3, C, D, G, H, K, and L). This analysis confirmed that Cdc42 knockdown induced a highly significant reduction in Imax and Q.
FIGURE 3:

Cdc42 knockdown reduces the efflux of serotonin upon exocytosis. BON cells were treated with control siRNAs (blue), siCdc42-A (red), siCdc42-C (green), or siCdc42-A and the rescue-A construct (black) and stimulated with ionomycin. Log-transformed values of the maximal spike height Imax and quantal size Q of amperometric spikes are reduced upon Cdc42 silencing, as indicated by the distribution of pooled spike values (A, B, E, F, I, J) and the mean values of these parameters measured in each cell (C, D, G, H, K, L). The significance of the differences in distributions was computed using an ANOVA test (see Materials and Methods) followed by a Tukey posttest; N = 3610 (control in A and B), 2954 (siCdc42-A in A and B), 1988 (control in E and F), 1586 (siCdc42-C), 2126 (control in I and J), 1334 (siCdc42-A in I and J), and 1642 (rescue-A) spikes. Significance of differences of mean values was computed by Mann–Whitney test (C, D, G, H) or Kruskal–Wallis test followed by Dunn's posttest (K, L).
The effects of Cdc42 knockdown on spike parameters may reflect a slower or incomplete dilation of the fusion pore, a reduced SG size, or diminished serotonin content. We measured SG size by stimulated emission depletion (STED) microscopy, resolution of which is not diffraction limited (Willig et al., 2006), and found that the mean size of SGs was not modified upon Cdc42 knockdown (Figure 4, A and C). In addition, reserpine-sensitive uptake of [3H]serotonin (i.e., the transport mediated by the vesicular monoamine transporter) was not affected, indicating that Cdc42 silencing did not impair the transport of serotonin into SGs (Figure 4D). Therefore the reduced amplitude and charge of spikes observed in Cdc42-knockdown cells does not result from changes in SG size or serotonin content. It might instead reflect the fact that SG content is expelled slowly or partially because fusion pore expansion is impaired in these cells.
FIGURE 4:

Cdc42 knockdown does not modify SG size and SG serotonin uptake. (A) STED images of SGs. BON cells were transfected with pNPY-mRFP, pNPY-pHluorin, and control, siCdc42-A, or siCdc42-C siRNA duplexes, as indicated. Three days later, the cells were fixed, and SGs were labeled with anti-GFP antibodies and atto532-coupled secondary antibodies. The cells were imaged using STED microscopy, and the images were segmented using MIA (bottom). We analyzed 1856 SGs from nine control cells, 2194 SGs from 11 siCdc42-A cells, and 2268 SGs from 12 siCdc42-C cells. The mask is shown to illustrate the identification of structures by MIA. Each object is given a particular color. Scale bar, 1 μm. (B) The resolution of the STED microscope was estimated by measuring the half-width (here 38 nm) of the Gaussian profile fitted to the fluorescence intensity along the cross section of a small SG. Bar, 500 nm. (C) Dot plots of SG diameter. Diameters were computed from the area of the segmented SGs, assuming a circular shape. Each dot represents the mean value of SG diameter in a given cell. The data indicate that Cdc42 knockdown did not change SG size (p = 0.67, one-way ANOVA). (D) BON cells were transfected with bVMAT1 and control, siCdc42-A, or siCdc42-C siRNA duplexes, as indicated. Three days later, the cells were incubated for 2 h at 37°C with [3H]serotonin in the presence or the absence of 1 μM reserpine, an inhibitor of the vesicular monoamine transporter. The mean (N = 3 wells/condition) amount of [3H]serotonin taken up by the cells after subtraction of the signal measured in the presence of reserpine were expressed as percentage of the value measured in cells transfected with control siRNAs and averaged (±SEM) over three independent experiments.
To assess whether Cdc42 controls fusion pore dilation, we analyzed how Cdc42 silencing affects nascent fusion pores, that is, during the first millisecond of their lifetime. Amperometric spikes are often preceded by a prespike foot current (PSF) reflecting the opening of a nanometer-sized pore that slowly dilates for a few milliseconds before it suddenly enlarges, giving rise to the main spike (Figure 5A; Chow et al., 1992). We found that the PSF maximal amplitude was significantly reduced in Cdc42-knockdown cells compared with control cells, whereas its duration was not affected (Figure 5, B and C). This result suggests that Cdc42 knockdown reduced the diameter of the nascent fusion pore. Previous studies revealed that initial fusion pores flicker and can close (Breckenridge and Almers, 1987; Takahashi et al., 2002). Of note, inspection of amperometric traces revealed that a significant fraction of small-sized spikes have complex shapes that may reflect rapid fluctuations of the pore diameter followed by pore closure (see events depicted with a star in Figure 2B). Such amperometric events reflecting fusion pores that fail to dilate are referred to as stand-alone foot currents, that is, as PSFs that are not followed by spikes (Wang et al., 2001). The leftward shift in the distribution of spike height and spike charge values observed in Cdc42-knockdown cells may thus correspond to an increased proportion of stand-alone foot currents. Such events, however, are difficult to analyze accurately and to distinguish from overlapping small-sized events. Taken together, our observations indicate that Cdc42 knockdown reduces the size of nascent pores, slows their enlargement, and may promote their premature closure (kiss-and-run).
FIGURE 5:
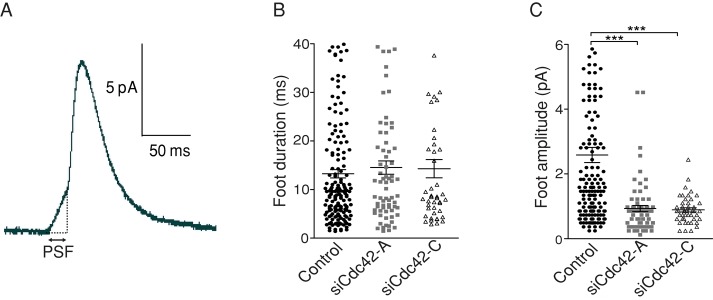
Cdc42 knockdown impairs the enlargement of nascent fusion pores. (A) Characteristic view of an amperometric spike preceded by a PSF. Cdc42 knockdown did not change the PSF duration (B) but reduced the flux of serotonin through the nascent pore, as indicated by the decreased PSF maximal amplitude (C). ***p < 0.0001; Kruskal–Wallis test followed by Dunn's test; n = 166 (control), 72 (siCdc42-A), and 45 PSFs (siCdc42-C).
Cdc42 silencing shifts exocytosis from full fusion to kiss-and-run
To address further the effect of Cdc42 silencing on fusion pore dilation, we used dual-color TIRFM. NPY-mRFP and NPY-superecliptic pHluorin (NPY-pHluorin) were expressed in BON cells. In this way, SGs were labeled with both reporters. The fluorescence of pHluorin, a pH-sensitive variant of GFP, is dim in the acidic lumen of SGs but brightens at neutral pH (Miesenbock et al., 1998; Balaji and Ryan, 2007). We reasoned that the fluorescence of NPY-pHluorin would increase upon fusion pore opening due to rapid H+ efflux and SG alkalinization even if the pore fails to expand, thus allowing the detection of kiss-and-run events (Xu et al., 2011). Cells were stimulated by local perfusion of ionomycin, and TIRF images were simultaneously acquired at 10 Hz in green and red channels. Different types of fusion events were observed. Figure 6A, left, illustrates a typical full-fusion event. On the first frame, an SG is visible in the red (top) but not the green (bottom) channel, indicating that this SG has not fused yet. Fusion occurs at frame 3 and is witnessed by the appearance of a bright green signal and the presence in both channels of a fluorescent halo surrounding the SG. Release is fast and completed within two frames. In Figure 6B, the SG undergoes exocytosis at frame 4 but the efflux of fluorescent proteins is slow, as indicated by the absence of fluorescent halo and the gradual decrease in SG fluorescence in both channels over >13 frames. Whereas fusion pore opening is demonstrated by the abrupt appearance of a green signal at frame 4, the fluorescence decrease observed on the following frames may reflect undocking rather than slow release. In Figure 6C, fusion occurs at frame 2 and is not followed by a significant decrease of NPY-mRFP signal. However, the fluorescence of NPY-pHluorin tapers, suggesting SG reacidification after the fusion pore has resealed. This assay thus detects full-fusion events (as illustrated in Figure 6A; ∼75% of events in control cells) and kiss-and-run events followed by undetectable or slow release of NPY-mRFP (as depicted in Figure 6, B and C). These two kinds of events have very different kinetics, as illustrated in Figure 6D, in which red and blue curves correspond to the mean time course of events accompanied by a fluorescent halo or not accompanied by such a halo, respectively. In the following, we use two criteria to categorize events: 1) the presence of a pHluorin fluorescent halo and 2) the duration of the pHluorin signal. Detecting a fluorescent halo was sufficient to tag an event as full fusion. Events not associated with an observable halo but characterized by rapid (i.e., within one or two frames) and complete release of NPY-pHluorin (i.e., when the fluorescence of the fused SG could no longer be distinguished from the background) were also classified as full-fusion events. Such events were not frequent, as the first criterion was generally met for short-lasting events. All other exocytotic events were classified as kiss-and-run.
Cdc42 knockdown severely decreased the occurrence of full-fusion events (Figure 1, B and C). In contrast, a slight, albeit nonsignificant, increase in the number of kiss-and-run events was observed in siCdc42-A– and siCdc42-C–treated cells (unpublished data). Accordingly, both siCdc42-A and siCdc42-C significantly increased the fraction of kiss-and-run events (Figure 6, E and F). These effects were rescued by coexpressing the rescue-A– or the rescue-C–insensitive Cdc42 constructs (Figure 6, E and F). Defining the fusion mode was sometimes difficult, such as when fast release occurred after an initial slow-release phase. Therefore we computed the duration of the pHluorin signal as an additional unbiased way of characterizing the effect of Cdc42 on the fusion process. As illustrated in Figure 6G, Cdc42 knockdown shifted the distribution of the duration of the pHluorin signal toward higher values. To further determine whether a reduction in the amount of active Cdc42 was responsible for the observed shift of exocytosis from full fusion to kiss-and-run, we tested the effect of overexpressing the dominant negative construct Cdc42-N17 or Cdc42-WT. We found that Cdc42-N17, but not Cdc42-WT, significantly increased the percentage of kiss-and-run events (Figure 6H), an observation that supports the results of Cdc42-knockdown experiments. Overall these experiments indicate that reducing the expression or activity of Cdc42 impairs full fusion and promotes slow release of SG content, consistent with this small GTPase being required for fusion pore dilation.
Cdc42 controls the fusion pore by regulating membrane tension
The growth of pores in lipid bilayers is driven by surface tension (Karatekin et al., 2003), and theoretical modeling has suggested that membrane tension constitutes the driving force for fusion pore dilation (Amatore et al., 2000; Chizmadzhev et al., 2000; Katsov et al., 2004; Grafmuller et al., 2007). However, there is no direct experimental evidence that membrane tension drives fusion pore enlargement in cells. Because Cdc42 is an organizer of the actin cytoskeleton and the interaction of the cell membrane with the actin cortex is known to govern membrane tension (Raucher and Sheetz, 1999), we hypothesized that Cdc42 regulates fusion pore dilation by controlling membrane tension. We therefore measured the effect of Cdc42 silencing on membrane tension. To do this, we extracted membrane tethers using optical tweezers and concanavalin A–coated beads adhering to the cell membrane and measured the displacement of the bead from the center of the optical trap (Figure 7A). This tether-pulling technique measures the tether force (Dai and Sheetz, 1995; Sinha et al., 2011), which varies with the square root of the effective membrane tension, σeff, that is, the sum of the lipid bilayer tension, σ, and the cytoskeleton-to-membrane adhesion energy W0:  . It is worth noting that there is no technique available to directly measure σ. As reported previously (Raucher and Sheetz, 1999; Nambiar et al., 2009), plots of bead displacement versus time are characterized by a spike followed by a plateau (Figure 7B). The spike is likely to reflect the formation of the membrane tether. Presumably, forming a membrane tether (i.e., detaching a patch of membrane from the underlying cytoskeleton) is harder than increasing its length (i.e., recruiting lipids in the tether). Because the peak value may not be directly linked to membrane tension, we measured the mean force during the plateau (1–3 s after the spike; Figure 7E). The tether force was reduced by Cdc42 knockdown (Figure 7, B–E). These observations indicate that reduced σeff correlates with reduced fusion pore enlargement.
FIGURE 7:
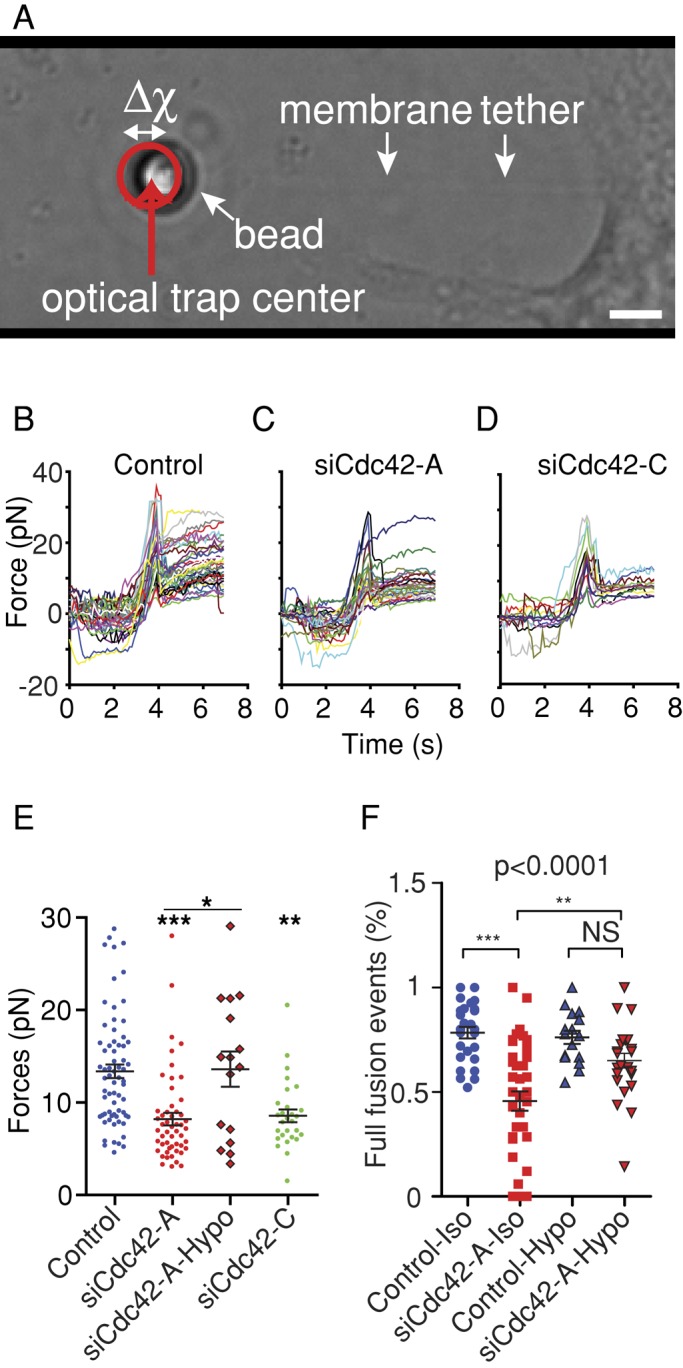
Cdc42 knockdown decreases membrane tension. (A) An optically trapped concanavalin A–coated latex bead is placed in contact with the cell until it is bound to the membrane and then pulled away to extract a membrane tether. The force exerted by the membrane tether is proportional to the square root of the effective membrane tension and displaces the bead from the center of the optical trap. Scale bar, 2 μm. Measurements were performed in the presence of ionomycin. (B–D) Plots of the force vs. time recorded in single cells transfected with control siRNAs (39 cells, B), siCdc42-A (29 cells, C), and siCdc42-C (13 cells, D). Traces comprise an initial peak in the force plot likely to reflect tether extraction, followed by a relatively stable plateau region (5–7 s). (E) Dot plot of the mean force measured during the plateau (i.e., 1–3 s after the spike). Cdc42 knockdown shifted the force to lower values, but bathing siCdc42-A–treated cells in a hypo-osmotic medium (250 mosm; siCdc42-A-Hypo) restored a force similar to that measured under iso-osmotic conditions. Values were obtained from 68 (control), 52 (siCdc42-A), 16 (siCdc42-A Hypo), and 28 (siCdc42-C) cells. (F) BON cells stimulated by ionomycin under iso- or hypo-osmotic conditions were analyzed as in Figure 6. Cdc42 knockdown reduced the fraction of full-fusion events under iso- but not hypo-osmotic conditions. The significance of differences was analyzed with a Kruskal–Wallis test followed by Dunn's posttest (E) or with ANOVA and Bonferroni's multiple comparison test (F); *p < 0.05, **p < 0.01, ***p < 0.001.
To investigate whether these Cdc42-dependent changes in membrane tension directly affect fusion pore dilation, we monitored exocytosis by TIRFM under hypo-osmotic conditions, which induce cell swelling and increase membrane tension. Accordingly, bathing si-Cdc42-A– treated cells in hypo-osmotic medium increased their membrane tension to values similar to the ones found in control cells under iso-osmotic conditions (Figure 7E). The data shown in Figure 7F indicate that in this set of experiments, Cdc42 knockdown significantly decreased the percentage of fast fusion events under iso- but not hypo-osmotic conditions. Moreover, in siCdc42-A–treated cells, the fraction of fast fusion events was increased in hypo-osmotic conditions compared with control ones. Two conclusions can be inferred from these observations: 1) Cdc42 controls the dynamics of the fusion pore by regulating effective membrane tension, and 2) this effect of Cdc42 on effective membrane tension is likely to result from a direct effect on σ. Indeed, cell swelling, which rescues the Cdc42 phenotype, increases σ but not the cytoskeleton-to-membrane adhesion energy (W0). We therefore conclude that Cdc42-dependent regulation of membrane tension controls fusion pore dilation.
Membrane tension regulates fusion pore dynamics and the release of large molecules
To strengthen these results, we addressed the role of the myosin II inhibitor blebbistatin on fusion pore dilation. Indeed, myosin II was previously found by amperometric detection to slow the dilation of fusion pores in neuroendocrine cells (Doreian et al., 2008; Neco et al., 2008; Berberian et al., 2009). We therefore investigated whether this effect was due to a decrease in membrane tension. We observed that blebbistatin induced a significant (∼30%) reduction in tether force (Figure 8A). In addition, using our dual-color TIRFM assay, we found that blebbistatin decreased the percentage of fast fusion events (Figure 8B) without changing the total number of fusion events (17.7 ± 4.5 and 11.9 ± 2.0 events/min in control cells and blebbistatin-treated cells, respectively; N = 14 cells in each condition; p = 0.9, Mann–Whitney). Although additional experiments might be needed to formally demonstrate that myosin II controls membrane tension, the fact that blebbistatin affects membrane tension and fusion pore dilation further indicates that the two phenomena are linked. Taken together, our results indicate that membrane tension is a driving force for fusion pore expansion and that Cdc42 (and presumably also myosin II) regulates this force.
FIGURE 8:

Effect of membrane tension on the final step of exocytosis. (A, B) Myosin II controls membrane tension and fusion pore dilation. (A) BON cells were treated with 50 μM blebbistatin (Blebbi) or the same amount of dimethyl sulfoxide (Control) for 10–30 min. Blebbistatin induced a significant reduction in tether force, measured as described in Figure 7 in the presence of ionomycin. (B) BON cells expressing NPY-pHluorin and NPY-mRFP were stimulated by ionomycin after a 10- to 30-min treatment with or without 50 μM blebbistatin, as indicated (Blebbi). Blebbistatin induced a reduction in the percentage of full-fusion events. (C) BON cells transiently expressing NPY fused in tandem with mRFP and pHluorin were imaged by TIRFM and stimulated by ionomycin under iso- or hypo-osmotic conditions. The graph shows that elevating membrane tension by inflating cells increases the percentage of full-fusion events. The significance of differences was analyzed with a Mann–Whitney test. (D) Schematic model depicting the effect of membrane tension on the final step of exocytosis. Fusion of the SG membrane with the plasma membrane (PM) mediates the release of different-sized molecules such as hormones or neurotransmitters, depending on the size of the fusion pore. A, the nascent, narrow fusion pore may eventually dilate to allow complete release of the SG content. Pore dilation relies on the GTPase Cdc42 and the motor protein myosin II, which are major regulators of the actomyosin cytoskeleton and set the PM lateral tension, the force acting on the spring. B, inhibiting Cdc42 or myosin II reduces membrane tension and impairs fusion pore dilation, shifting the fusion process from full-collapse fusion to kiss-and-run.
Finally, we analyzed the effect of pore dilation regulation by membrane tension on the exocytosis of different-sized molecules. For this, we compared by TIRFM the release of NPY-pHluorin with the release of a larger tandem reporter, NPY-pHluorin-mRFP, under different osmotic conditions. Under iso-osmotic conditions, we observed 43 ± 7% of fast fusion events with the tandem reporter, compared with 80 ± 3% with NPY-pHluorin, suggesting that the tandem construct is expelled more slowly than NPY-pHluorin. In hypo-osmotic solutions, the fraction of full-fusion events was enhanced to 64 ± 5% for the tandem reporter (Figure 8C), indicating that increasing membrane tension promotes fusion pore expansion and facilitates the release of large molecules.
DISCUSSION
This study revealed that Cdc42 affects the secretory process by promoting fusion pore dilation. We also found that Cdc42 regulates membrane tension, suggesting that Cdc42 acts on fusion pores by regulating membrane tension. We tested this possibility and observed that increasing membrane tension with hypo-osmotic solutions promotes fusion pore enlargement, leading to large reporter molecules being expelled more rapidly. Moreover, increasing membrane tension rescues the effect of Cdc42 knockdown on fusion pore expansion, whereas lowering membrane tension with blebbistatin impairs fusion pore expansion. We therefore conclude that membrane tension is a driving force for fusion pore dilation and that Cdc42 controls this force (see Figure 8D for a schematic representation of this conclusion).
The dynamics of pores in artificial lipid bilayers are governed by the balance between the line tension, a force that tends to reseal the pore and varies with the radius of the pore, R, and the membrane tension, which tends to enlarge the pore and varies with R2 (Karatekin et al., 2003). The exocytotic fusion pore is believed to be similarly controlled by the balance between the line tension and the membrane tension. The line tension primarily results from the edge of the fusion pore consisting of highly bent membranes. Increasing the pore size implies the need to bend a wider area of membrane, which is energetically unfavorable. In this study, we demonstrated that membrane tension overcomes line tension and drives the enlargement of the exocytotic fusion pore and that Cdc42 (and probably myosin II) controls this force. Cdc42 silencing induced a 40% reduction in the tether force under stimulating conditions, indicating an almost threefold reduction in membrane tension. This drop in membrane tension is expected to induce a threefold increase in the energy barrier, ΔWmax to fusion pore expansion (ΔWmax = πδ2/σ, with δ being the line tension and σ the membrane tension; Amatore et al., 2000; Chizmadzhev et al., 2000), providing an explanation for the fact that fusion pores often fail to dilate in Cdc42-depleted cells. Moreover, even pores that pass over the energy barrier have slower expansion kinetics, in agreement with the theoretical finding that the radius of the fusion pore varies with the membrane tension (Chizmadzhev et al., 2000).
Because the tether-pulling technique does not probe the membrane tension locally, at the site of exocytosis, we infer that Cdc42 acts globally by setting the tension of the plasma membrane. However, it may also play a role in determining the tension of the SG membrane, and we cannot exclude an additional, local mechanism at exocytotic sites. In addition, independently of Cdc42, other sources of local membrane tension can be envisioned. First, it was suggested that ionic exchanges through the fusion pore induce osmotic swelling of the secretory granule matrix (but see Monck et al., 1990) and thus an increase in SG membrane tension (Zimmerberg et al., 1987; Borges et al., 1997; Amatore et al., 2003). However, although chromogranin A is a major component of the SG matrix, only minor changes in fusion pore kinetics were observed in adrenal chromaffin cells from chromogranin A–knockout mice (Montesinos et al., 2008); moreover, this mechanism could not operate in organelles that are not endowed with a hydrogel-like matrix. Assembly of soluble N-ethylmaleimide–sensitive factor attachment protein receptors (SNAREs) and SNARE-associated proteins, which are anchored in the SG and the plasma membrane, may also locally tense the two fusing membranes by bringing them into close apposition despite the existence of forces opposing the reduction of the intermembrane distance. Relaxing this tension by inserting a linker in the juxtamembrane region of the vesicle-SNARE synaptobrevin-2 was found to consistently slow the expansion of the fusion pore under high-calcium concentrations (Deak et al., 2006; Kesavan et al., 2007; Bretou et al., 2008). These observations suggest that SNAREs, together with a calcium-binding protein, most likely synaptotagmin (Wang et al., 2006; Lynch et al., 2008), may increase the membrane tension locally. The GTPase dynamin has also been shown to regulate fusion pore dynamics (Elhamdani et al., 2001; Graham et al., 2002; Anantharam et al., 2011; Gonzalez-Jamett et al., 2013). However, the assembly of dynamin rings at the neck of fusing SGs has not been demonstrated. Dynamin is known to control the dynamics of membrane invaginations, such as caveolae, and may thereby set the tension of the membrane (Sinha et al., 2011). Dynamin may act on fusion pores by acting globally, on the plasma membrane tension, and not locally, at the neck of the SG undergoing exocytosis.
How does Cdc42 control the tension of the membrane? Via N-WASP and Arp2/3, Cdc42 promotes actin polymerization and secretion (Gasman et al., 2004). The effect of Cdc42 on the fusion pore may thus result from an increased interaction between the actin-rich cortex and the plasma membrane, which is known to tense the membrane (Raucher and Sheetz, 1999). However, conflicting results have been reported regarding the effect of actin depolymerization on fusion pore dynamics (Doreian et al., 2008; Berberian et al., 2009). Alternatively, Cdc42 may activate motor molecules. For example, Cdc42 activates myosin II (Leung et al., 1998; Gomes et al., 2005), and inhibiting myosin II restricts fusion pore enlargement (Doreian et al., 2008; Neco et al., 2008; Berberian et al., 2009; this study). The similarity of the effects of Cdc42 silencing and blebbistatin on membrane tension and on fusion pore dynamics may thus reflect the fact that Cdc42 affects membrane tension by activating myosin II. Via p21-activated kinases, Cdc42 can also activate myosins I and VI, which have been shown to regulate membrane tension (Nambiar et al., 2009; Chuan et al., 2011). Further work is needed to determine whether these myosins also generate membrane tension downstream of Cdc42 to facilitate fusion pore expansion. In contrast with our findings, blebbistatin was found to increase membrane tension in fibroblasts and fish keratocytes (Gauthier et al., 2011; Lieber et al., 2013). However, these cells were observed during lamellipodium spreading, when membrane tension is elevated as a result of depletion of membrane reservoirs and when growing actin filaments at the cell edge exert a high pressure against the plasma membrane. Under those conditions, myosin II is believed to affect membrane tension by pulling actin filaments away from the leading edge and assisting cell detachment at the rear. How myosin II controls membrane tension in nonspreading neuroendocrine cells remains to be addressed.
Controlling the fate of fusion pores is emerging as an important aspect of the physiological regulation of hormone and protein secretion. For instance, narrow fusion pores spontaneously open in lactotroph cells, and the effect of the secretory stimulus is to increase their dwell time and diameter (Vardjan et al., 2007). Similarly, robust stimulation of adrenal chromaffin cells promotes rapid and complete dilation of fusion pores and release of SG matrix proteins, whereas mild stimuli only trigger the release of small transmitter molecules (Fulop et al., 2005; Elhamdani et al., 2006; Bretou et al., 2008). The mechanisms that couple robust stimuli and complete dilation of the fusion pore are not understood. Stimuli that trigger secretion, such as high K+ in PC12 cells (Gasman et al., 2004; Malacombe et al., 2006), high glucose in pancreatic beta cells (Wang et al., 2007), and engagement of the B-cell receptor in lymphocytes (which promotes lysosome exocytosis at the immune synapse; Yuseff et al., 2011), activate Cdc42. Our data suggest that Cdc42 activation and the consequent increase in membrane tension mediate the coupling between the stimulus and fusion pore dilation.
Wide pores are required to secrete large molecular complexes such as insulin, von Willebrand factor, and surfactants (Takahashi et al., 2002; Michael et al., 2006; Miklavc et al., 2009; Nightingale et al., 2011). In the cases of von Willebrand factor and surfactant release, postfusion mechanisms involving actin coating of SGs or myosin II contribute to expelling SG content (Miklavc et al., 2009; Nightingale et al., 2011). These mechanisms last tens of seconds and thus differ from the rapid exocytotic process described in this study. Nevertheless, membrane tension is likely to play an important role in these secretory processes. Multiple biological processes, such as fertilization or viral transduction and fusion between intracellular compartments, also require fusion pore enlargement. The effect of membrane tension and its regulators on the dynamics of fusion pores in these systems will now be addressed.
MATERIALS AND METHODS
Constructs, siRNAs, and antibodies
Plasmids encoding NPY-EGFP, NPY-mRFP, and GFP-Rab27A were described previously (El-Amraoui et al., 2002; Desnos et al., 2007). Vectors encoding bovine vesicular monoamine transporter-1 (bVMAT1) and pHluorin were kindly provided by B. Gasnier and C. Sagné (Paris Descartes University, Paris, France) and G. Miesenböck (University of Oxford, Oxford, United Kingdom), respectively. The plasmid encoding NPY-pHluorin was obtained as follows: BamHI and NotI sites were introduced into the sequence of pHluorin by PCR; the resulting plasmid was digested with BamHI/NotI, and the excised pHluorin fragment was inserted into pCDNA-NPYmRFP digested with the same enzymes to replace mRFP. Mutations (F64L, S65T) were introduced by PCR in the sequence of pHluorin to increase its brightness according to the sequence of superecliptic pHluorin (Sankaranarayanan et al., 2000). Sequences were verified by automated DNA sequencing. The plasmids encoding mCherry-Cdc42-WT and mCherry-Cdc42-N17 were kindly provided by T. Tsuboi (University of Tokyo, Tokyo, Japan). The plasmid encoding hemagglutinin (HA)-tagged Cdc42-rescue-A, resistant to siCdc42-A, was generated by mutagenesis (QuikChange mutagenesis kit; Stratagene) of the GAG codon encoding Glu-62 to GAA and of the GAT codon encoding Asp-63 to GAC. HA-tagged Cdc42-rescue-C was made by mutating the CAC codons encoding His-103 and His-104 to CAT. To silence Cdc42 expression, two different siRNAs were used: siCdc42-A (5′-GGG CAA GAG GAU UAU GAC ATT-3′) and siCdc42-C (5′-GAU AAC UCA CCA CUG UCC ATT-3′). SiRNA duplexes targeting luciferase (5′-CUU ACG CUG AGU ACU UCG ATT-3′ or 5′-AAC GUA CGC GGA AUA CUU CGA-3′ were used as control. siRNAs were obtained from Eurofins MWG Operon (Ebersberg, Germany).
The following antibodies were used: mouse monoclonal anti-Cdc42 antibodies (610928; Becton Dickinson, Franklin Lakes, NJ), mouse monoclonal anti-Cdc42 antibodies (sc8401; Santa Cruz Biotechnology, Dallas, TX), mouse monoclonal anti–β-tubulin (Sigma-Aldrich, St. Louis, MO), mouse monoclonal anti-GFP (Roche, Basel, Switzerland), and goat anti-mouse immunoglobulin G peroxidase–conjugated antibodies (Jackson ImmunoResearch, West Grove, PA).
Cell culture, transfection, and immunoblotting
Cell culture media, sera, and reagents were purchased from PAA Laboratories (Linz, Austria). Other chemicals were from Sigma-Aldrich. Blots were scanned and quantified using ImageJ software (National Institutes of Health, Bethesda, MD). Levels of β-tubulin were used to normalize the results from different samples.
BON cells were kindly provided by C. M. Townsend (University of Texas Medical Branch, Galveston, TX). Experiments were done with a subclone named N13 (Tran et al., 2007). Cells were maintained in DMEM F12 with l-glutamine, supplemented with 10% fetal calf serum and penicillin (100 U/ml)/streptomycin (100 μg/ml) at 37°C under 5% CO2. Confluent cells were harvested on the day of transfection. Cells were electroporated as described previously (Desnos et al., 2003), using various DNA and RNA mixes. For amperometry experiments, cells were electroporated with 4.0 μg of pcDNA3-bVMAT1, 1.0 μg of pcDNA3-NPYmRFP, and 5 μM control, siCdc42-A, or siCdc42–C siRNA. For rescue experiments, 2 μg of plasmid encoding Cdc42-rescue-A or Cdc42-rescue-C was added. We verified by immunofluorescence with an anti-HA antibody that these HA-tagged Cdc42-rescue constructs were readily expressed in transfected BON cells and, in particular, in cells cotransfected with NPY-mRFP. The very high efficacy of cotransfection indicates that cells selected in amperometry or TIRFM experiments on the basis of NPY-mRFP fluorescence were actually expressing the rescue constructs. For TIRFM experiments, electroporation was carried out with 1 μg of pcDNA3-NPY-mRFP and 1 μg of pNPY-pHluorin with 5 μM siRNAs. Electroporated cells were plated onto 20 μg/ml collagen (rat type VII)–coated 12-mm glass coverslips for amperometric experiments or onto 5 μg/ml collagen–coated glass bottom dishes for TIRFM experiments (MatTek, Ashland, MA; World Precision Instruments, Sarasota, FL). Twenty-four hours after electroporation, the silencing was reinforced using Interferin (Polyplus Transfection, Illkirch, France), according to the manufacturer's protocol (30 nM siRNA duplex), which leads to > 90% of cells being transfected, as assessed by fluorescent siRNA duplexes. Experiments were carried out 72 h after the initial electroporation. For membrane tension measurements, cells were initially silenced with the siRNA of interest using Interferin and plated onto 5 μg/ml collagen–coated fluorodishes (WPI). A second round of silencing was carried out 24 h after the first one. Plasmids encoding mCherry-Cdc42-WT or mCherry-Cdc42-N17 were cotransfected with NPY-pHluorin or NPY-mRFP using Jet PEI (Polyplus Transfection).
Carbon fiber amperometry
Carbon fiber electrodes were kindly provided by F. Lemaitre and A. Meunier (Ecole Normale Supérieure, Paris, France; Amatore et al., 2006). Before use, the electrodes were examined under a microscope, and their response was tested in fresh 50 μM dopamine solution. Amperometric recordings were performed at room temperature (25–27°C) as described previously (Schonn et al., 2003), with modifications: 1) data were sampled at 40 kHz, and 2) to reduce electrical noise, acquisitions were carried out using a Hum bug noise eliminator device (Quest Scientific, North Vancouver, Canada). Loading of SGs was increased by incubating the cells overnight in complete culture medium supplemented with 300 μM serotonin-hydrochloride and 100 μM pargyline, a monoamine oxidase inhibitor used to protect serotonin from oxidation and increase its SG concentration. Before use, the cells were rinsed in Locke's medium containing (concentrations in mM) glucose 5.6, HCO3− 3.6, Cl− 159.6, Na+ 157.6, K+ 5.6, 4-(2-hydroxyethyl)-1-piperazineethanesulfonic acid–NaOH 5, CaCl2 2.5, and MgCl2 1.2 and transferred to Locke's solution supplemented with 2.5 mM CaCl2. The tip of a micropipette containing a stimulating solution (Locke's medium supplemented with 5 μM ionomycin) was positioned near the target cell with a micropositioner (5171; Eppendorf, Hamburg, Germany). To increase membrane tension, cells were perfused with a hypo-osmotic medium (modified Locke's medium with only 98 mM NaCl instead of 154 mM, measured osmolarity of 250 mosm) supplemented with 5 μM ionomycin. The stimulating solution was pressure ejected with a microinjector (5246; Eppendorf). To eliminate bias due to electrode gum-up, the electrode was briefly polished after every three cells, and its response was verified in fresh 50 μM dopamine.
Amperometric traces were analyzed with custom-written routines in Elphy (G. Sadoc, Centre National de la Recherche Scientifique UPR3293, Gif sur Yvette, France) and Minianalysis (Synaptosoft, Decatur, GA) with a detection threshold set at 0.4 pA. To facilitate the detection and analysis of PSFs, traces were smoothed in Elphy with a sliding average window of 500 data points. Nonresponding cells were discarded from the analysis.
TIRFM imaging
TIRFM imaging was performed on a previously described custom prism-based setup (Huet et al., 2006), using a water immersion objective (Plan-Apochromat, 63×/numerical aperture [NA] 1.0; Zeiss, Jena, Germany). The penetration depth of the evanescent field was set to 150 nm. Stream acquisitions were performed at 10 Hz using a charge-coupled device camera (CoolSnap HQ, pixel 6.45 μm; Photometrics, Tucson, AZ). Simultaneous two-color acquisitions were performed using green and blue wavelengths of the laser (488 and 514 nm) and adding an image splitter device (DualView; Photometrics).
BON cells were bathed in Locke's solution. Cells were selected on the basis of their NPY-mRFP fluorescence. The secretory activity was triggered by local application of Locke's solution supplemented with 10 μM ionomycin for 1 min or, where indicated, with hypo-osmotic solution (see Carbon fiber amperometry) supplemented with ionomycin. The stimulating solution was delivered using a glass micropipette positioned near the selected cell and connected to a syringe pump. Image acquisition started just before the onset of perfusion.
Exocytotic events were manually detected in time-series images (Desnos et al., 2007) after alignment of NPY-pHluorin and NPY-mRFP films using wide-field transmission images of the cells. The duration of events was measured by an automatic routine counting the number of frames between the appearance of a SG in the green channel and the frame at which the signal had decreased to <120% of its value before the onset of the exocytotic signal. Nonresponding cells were discarded from the analysis. The density of fluorescent structures was evaluated using multidimensional image analysis software (MIA, a segmentation algorithm based on wavelets; Racine et al., 2006) running under MetaMorph (Molecular Devices, Sunnyvale, CA). From stacks of images, two-dimensional (x, y) trajectories were obtained by single-particle tracking using MIA software. Single-particle tracking and analysis of SG mobility were performed as described previously (Huet et al., 2012). Immobilization periods were defined as portions of trajectories during which Dxy < 5 × 10⁻⁴ μm2 s−1.
Membrane tension measurements
BON cells were transferred into Locke's solution and were stimulated by locally perfusing Locke's solution supplemented with 5 μM ionomycin for 5 s just before the onset of the force measurement. Recordings under hypo-osmotic conditions were done by bathing cells in a hypo-osmotic medium (see Carbon fiber amperometry) for 15–30 min. Optical tweezers were used to trap 3-μm-diameter latex beads (Polysciences Europe, Eppelheim, Germany) coated with concanavalin A and bring them into contact with the cell membrane for 4 s, after which they were pulled away at a speed of 1 μm/s by translation of the piezoelectric stage, allowing the formation of membrane tethers (Nambiar et al., 2009; Sinha et al., 2011). More precisely, the tethers were formed using a sinusoid of period 20 s and amplitude 10 μm. This guarantees the nucleation of the tether and a constant speed of 1 μm/s for >5 μm. At least 5 s after tether formation (tether length, ∼5 μm), the bead was released by shutting off the laser. Because the tether is often invisible in phase images, the retraction of a released bead indicated formation of the tether (only movies with this feature were considered for the analysis). Typically, formation of a tether is indicated by a spike in bead displacement, followed by a plateau (Raucher and Sheetz, 1999; Nambiar et al., 2009). Because the interpretation of the spike is unclear, we focused on the plateau. Pulling tether longer than tens of micrometers could result in deformation of the cortex or loss of the beads (Raucher and Sheetz, 1999). Note that although the measurement is dynamic (and therefore the measured result might mix viscoelastic relaxations with the pulling force), we did not notice any relaxation on tether of 1–5 μm in control experiments where the traction was stopped. Moreover, the plateau is flat over several micrometers, indicating that the measurement is indeed quasistatic and that the different curves can be averaged. The displacement of the bead (and therefore the force necessary to pull the tether) from the resting position was measured by averaging the plateau at a tether length between 2 and 3 μm (i.e., 1–3 s after the spike).
The bead was tracked offline using a custom-made program developed in MATLAB (MathWorks, Natick, MA) by G. Toombes (Institut Curie, UMR168, Paris, France) and P. Pierobon (Institut Curie, U932, Paris, France). At each frame, the algorithm fits the diffraction dark ring around the image of a bead identified using an automatic threshold (determined as 1 SD above the minimal value of the image). The localization precision depends mainly on the contrast of the image, but we estimated an accuracy of ∼40 nm (measured on a bead attached to the surface).
The optical trap used in our experiments was a single-mode ytterbium fiber laser (λ = 1064 nm, TEM 00, 5 W; IPG Photonics, Oxford, MA) expanded 2× to fill the back focal aperture of the objective (U Plan Apo 100×/N.A. 1.35; Olympus, Tokyo, Japan). The setup was mounted on an Olympus IX71 inverted microscope. The sample was illuminated by transmitted light, and movies were acquired at 10 Hz with a charge-coupled device camera (CoolSNAP HQ, pixel 6.45 μm) driven by MetaMorph. The sample was displaced using a Marzhauser stage (Wetzlar, Germany). The fine movements and particularly the translational movement necessary to pull the membrane tether were performed using a custom-made stage mounted on a piezoelectric element (P753; Physik Instrumente, Karlsruhe, Germany) driven by a servo controller (E665; Physik Instrumente) and a function generator (Sony Tektronix AFG320, Tokyo, Japan).
Calibration was performed using an oscillatory modulation driven by the function generator. Inspired by the method described by (Tolic´-Norrelykke et al., 2006), we observed the response of the bead to an oscillatory motion of the stage with a frequency of ω. The ratio between the driving and response amplitudes is proportional to  , from which one can extract the corner frequency, ωc = k/γ, and, hence (knowing the viscous coefficient of a sphere, γ), the stiffness of the tweezers, k. This calibration method allowed us to avoid spectral measurements and the viscous drag force on long runs: the first method requires a fast detection system, such as a quadrant photodiode, whereas the second one requires a stage with accurate speed over long distances. With this calibration method (also validated at low laser power by measuring Brownian diffusion and using the equipartition theorem), we obtain k = 0.039P pN/(nm W), where P is the laser power. This relationship is linear in the laser power range of 0.6–1 W (r2 = 0.99). The laser power used for the experiments ranged from 0.6 to 1 W, and so the stiffness of the tweezers ranged between 0.023 and 0.039 pN/nm.
STED imaging
The mean SG diameter in BON cells was shown to be 240 nm (Tran et al., 2007), which is a value close to the diffraction limit. To measure SG size, we therefore used STED microscopy, in which the resolution is not diffraction limited. A custom-built STED microscope was used. Both excitation and depletion laser sources were generated by a single Ti:Sa laser (Chameleon Ultra II; Coherent, Santa Clara, CA) simultaneously pumping a supercontinuum-generation photonic crystal fiber (NKT Photonics, Birkerød, Denmark) for excitation and a frequency-doubled optical parametric oscillator (PP-Automatic; Coherent) to generate the STED beam. This solution eliminates time jitter between excitation and STED pulses. The excitation beam was obtained from the supercontinuum spectrum with a 480/20 filter (Chroma, Bellows Falls, VT) before spatial filtering by a monomode fiber. The femtosecond STED pulse was stretched to ∼200 ps with a pair of gratings to reduce multiphotonic photobleaching (Dyba and Hell, 2003). After spatial filtering with a polarization-maintaining optical fiber, the STED beam passed through a helicoidal phase mask (RPC Photonics, Rochester, NY) yielding a toroidal focus. The two beams were combined with diachronic beamsplitters (Chroma) and passed through a quarter-wave plate (Bernhard Halle Nachfolger, Berlin, Germany) in front of the microscope objective (Olympus UPlanSAPo, 100×/1.4 NA). Fluorescence was imaged with a 400-mm tube lens (Linos, Göttingen, Germany) through an emission filter (550/50, Chroma) onto a multimode optical fiber with a 62.5-μm core diameter connected to an avalanche photodiode (SPCM-AQR-13; PerkinElmer, Waltham, MA). Scanning of the sample was achieved with a piezo stage (P734-2CL with digital controller E710; Physik Instrumente).
Samples were immunolabeled with a primary antibody against GFP and a secondary antibody custom labeled with the synthetic dye ATTO532 (ATTO Tec, Siegen, Germany). Images were segmented with MIA using wavelet planes 4–8.
Serotonin uptake
BON cells were transfected with pCDNA3-bVMAT1, which encodes a vesicular monoamine transporter, and siRNA duplexes as described, and then plated in 24-well dishes (250,000 cells/well). The serotonin-uptake assay was performed 3 d later. Cells were incubated for 2 h in complete medium culture supplemented with 10 nM [3H]serotonin (Amersham, Little Chalfont, United Kingdom) in the presence or the absence of 1 μM reserpine, a VMAT inhibitor. The medium was then exchanged for fresh culture medium lacking serotonin and incubated for 1 h. Cells were then washed three times using Locke's medium supplemented with 0.2% bovine serum albumin and lysed in 250 μl of 0.2% Triton X-100. Part of each sample was used to measure the radioactivity, and another part was used to measure the protein concentration with a Bradford assay.
Statistical analyses
To assess the significance of the differences in amperometric spike parameters between treatments, the following linear model was used:
 |
where Yijkl is the signal (log Q or log Imax) measured for peak l of cell k upon treatment i on day j; μ is the overall mean of the data; Ti is the effect of the treatment i; Dj is the effect of the day; γk is the effect of the cell; and εijkl is the residual error, assuming that ε follows a normal distribution of parameters 0, σ. The nested effect of a cell into a treatment allows us to take into account the variability between cells in each treatment and therefore to obtain a better estimate of the treatment effect. The significance of the treatment effect was assessed by an ANOVA test. When a treatment effect was observed, the significance of the differences between the treatment levels was assessed by a Tukey honestly significant difference test, giving a p value for all pairwise comparisons. For all of the tests, the significance threshold was fixed at 0.05. All analyses were performed with R statistical software.
For other statistical analyses, one-way ANOVA and a Bonferroni posttest or nonparametric tests (Mann–Whitney or Kruskal–Wallis followed by Dunn's posttest), as indicated, were run under Prism 5 (GraphPad Software, La Jolla, CA). *p < 0.05; **p < 0.01; ***p < 0.001. Errors are shown as SEM.
Supplementary Material
Acknowledgments
We thank E. Karatekin and P. Nassoy for critical reading of the manuscript; I. Brito for contribution to the statistical analyses; V. Calco for technical assistance in generating Cdc42 rescue constructs; G. Toombes, C. Campillo, and G. Cappello for technical advice; and Marcel Lauterbach for help with the STED microscope. This work was funded by grants from the Young Investigator Program of the City of Paris, the European Research Council to A.-M.L.-D. (Strapacemi 243103), and the Agence Nationale pour la Recherche to F.D. (ANR-06-BLAN-0211-02), P.B. (ANR-2010-JCJC-1504-01), and A.-M.L.-D. (ANR-12-BSV3-0014-02). F.D. is supported by the Institut National de la Santé et de la Recherche Médicale, and M.B. was supported by the Centre National de la Recherche Scientifique and the Fondation pour la Recherche Médicale.
Abbreviations used:
- bVMAT1
bovine vesicular monoamine transporter-1
- GFP
green fluorescent protein
- mRFP
monomeric red fluorescent protein
- NPY
neuropeptide Y
- N-WASP
neuronal Wiskott-Aldrich syndrome protein
- PM
plasma membrane
- PSF
prespike foot
- SG
secretory granule
- SNARE
soluble N-ethyl-maleimide–sensitive factor attachment protein receptor
- STED
stimulated-emission-depletion
- TIRFM
total internal reflection fluorescence microscopy
Footnotes
This article was published online ahead of print in MBoC in Press (http://www.molbiolcell.org/cgi/doi/10.1091/mbc.E14-07-1229) on August 20, 2014.
*These authors contributed equally to this work.
REFERENCES
- Amatore C, Arbault S, Bonifas I, Bouret Y, Erard M, Guille M. Dynamics of full fusion during vesicular exocytotic events: release of adrenaline by chromaffin cells. Chemphyschem. 2003;4:147–154. doi: 10.1002/cphc.200390024. [DOI] [PubMed] [Google Scholar]
- Amatore C, Arbault S, Bouret Y, Guille M, Lemaitre F, Verchier Y. Regulation of exocytosis in chromaffin cells by trans-insertion of lysophosphatidylcholine and arachidonic acid into the outer leaflet of the cell membrane. Chembiochem. 2006;7:1998–2003. doi: 10.1002/cbic.200600194. [DOI] [PubMed] [Google Scholar]
- Amatore C, Bouret Y, Travis ER, Wightman RM. Adrenaline release by chromaffin cells: constrained swelling of the vesicle matrix leads to full fusion. Angew Chem Int Ed Engl. 2000;39:1952–1955. doi: 10.1002/1521-3773(20000602)39:11<1952::aid-anie1952>3.0.co;2-3. [DOI] [PubMed] [Google Scholar]
- Anantharam A, Bittner MA, Aikman RL, Stuenkel EL, Schmid SL, Axelrod D, Holz RW. A new role for the dynamin GTPase in the regulation of fusion pore expansion. Mol Biol Cell. 2011;22:1907–1918. doi: 10.1091/mbc.E11-02-0101. [DOI] [PMC free article] [PubMed] [Google Scholar]
- Balaji J, Ryan TA. Single-vesicle imaging reveals that synaptic vesicle exocytosis and endocytosis are coupled by a single stochastic mode. Proc Natl Acad Sci USA. 2007;104:20576–20581. doi: 10.1073/pnas.0707574105. [DOI] [PMC free article] [PubMed] [Google Scholar]
- Berberian K, Torres AJ, Fang Q, Kisler K, Lindau M. F-actin and myosin II accelerate catecholamine release from chromaffin granules. J Neurosci. 2009;29:863–870. doi: 10.1523/JNEUROSCI.2818-08.2009. [DOI] [PMC free article] [PubMed] [Google Scholar]
- Borges R, Travis ER, Hochstetler SE, Wightman RM. Effects of external osmotic pressure on vesicular secretion from bovine adrenal medullary cells. J Biol Chem. 1997;272:8325–8331. doi: 10.1074/jbc.272.13.8325. [DOI] [PubMed] [Google Scholar]
- Breckenridge LJ, Almers W. Final steps in exocytosis observed in a cell with giant secretory granules. Proc Natl Acad Sci USA. 1987;84:1945–1949. doi: 10.1073/pnas.84.7.1945. [DOI] [PMC free article] [PubMed] [Google Scholar]
- Bretou M, Anne C, Darchen F. A fast mode of membrane fusion dependent on tight SNARE zippering. J Neurosci. 2008;28:8470–8476. doi: 10.1523/JNEUROSCI.0860-08.2008. [DOI] [PMC free article] [PubMed] [Google Scholar]
- Chernomordik LV, Kozlov MM. Mechanics of membrane fusion. Nat Struct Mol Biol. 2008;15:675–683. doi: 10.1038/nsmb.1455. [DOI] [PMC free article] [PubMed] [Google Scholar]
- Chizmadzhev YA, Kuzmin PI, Kumenko DA, Zimmerberg J, Cohen FS. Dynamics of fusion pores connecting membranes of different tensions. Biophys J. 2000;78:2241–2256. doi: 10.1016/S0006-3495(00)76771-3. [DOI] [PMC free article] [PubMed] [Google Scholar]
- Chow RH, von Ruden L, Neher E. Delay in vesicle fusion revealed by electrochemical monitoring of single secretory events in adrenal chromaffin cells. Nature. 1992;356:60–63. doi: 10.1038/356060a0. [DOI] [PubMed] [Google Scholar]
- Chuan P, Spudich JA, Dunn AR. Robust mechanosensing and tension generation by myosin VI. J Mol Biol. 2011;405:105–112. doi: 10.1016/j.jmb.2010.10.010. [DOI] [PMC free article] [PubMed] [Google Scholar]
- Cohen FS, Akabas MH, Zimmerberg J, Finkelstein A. Parameters affecting the fusion of unilamellar phospholipid vesicles with planar bilayer membranes. J Cell Biol. 1984;98:1054–1062. doi: 10.1083/jcb.98.3.1054. [DOI] [PMC free article] [PubMed] [Google Scholar]
- Dai J, Sheetz MP. Mechanical properties of neuronal growth cone membranes studied by tether formation with laser optical tweezers. Biophys J. 1995;68:988–996. doi: 10.1016/S0006-3495(95)80274-2. [DOI] [PMC free article] [PubMed] [Google Scholar]
- Deak F, Shin OH, Kavalali ET, Sudhof TC. Structural determinants of synaptobrevin 2 function in synaptic vesicle fusion. J Neurosci. 2006;26:6668–6676. doi: 10.1523/JNEUROSCI.5272-05.2006. [DOI] [PMC free article] [PubMed] [Google Scholar]
- Desnos C, Huet S, Fanget I, Chapuis C, Bottiger C, Racine V, Sibarita JB, Henry JP, Darchen F. Myosin va mediates docking of secretory granules at the plasma membrane. J Neurosci. 2007;27:10636–10645. doi: 10.1523/JNEUROSCI.1228-07.2007. [DOI] [PMC free article] [PubMed] [Google Scholar]
- Desnos C, Schonn JS, Huet S, Tran VS, El-Amraoui A, Raposo G, Fanget I, Chapuis C, Menasche G, de Saint Basile G, et al. Rab27A and its effector MyRIP link secretory granules to F-actin and control their motion towards release sites. J Cell Biol. 2003;163:559–570. doi: 10.1083/jcb.200302157. [DOI] [PMC free article] [PubMed] [Google Scholar]
- Doreian BW, Fulop TG, Smith CB. Myosin II activation and actin reorganization regulate the mode of quantal exocytosis in mouse adrenal chromaffin cells. J Neurosci. 2008;28:4470–4478. doi: 10.1523/JNEUROSCI.0008-08.2008. [DOI] [PMC free article] [PubMed] [Google Scholar]
- Dyba M, Hell SW. Photostability of a fluorescent marker under pulsed excited-state depletion through stimulated emission. App Opt. 2003;42:5123–5129. doi: 10.1364/ao.42.005123. [DOI] [PubMed] [Google Scholar]
- El-Amraoui A, Schonn JS, Kussel-Andermann P, Blanchard S, Desnos C, Henry JP, Wolfrum U, Darchen F, Petit C. MyRIP, a novel Rab effector, enables myosin VIIa recruitment to retinal melanosomes. EMBO Rep. 2002;3:463–470. doi: 10.1093/embo-reports/kvf090. [DOI] [PMC free article] [PubMed] [Google Scholar]
- Elhamdani A, Azizi F, Artalejo CR. Double patch clamp reveals that transient fusion (kiss-and-run) is a major mechanism of secretion in calf adrenal chromaffin cells: high calcium shifts the mechanism from kiss-and-run to complete fusion. J Neurosci. 2006;26:3030–3036. doi: 10.1523/JNEUROSCI.5275-05.2006. [DOI] [PMC free article] [PubMed] [Google Scholar]
- Elhamdani A, Palfrey HC, Artalejo CR. Quantal size is dependent on stimulation frequency and calcium entry in calf chromaffin cells. Neuron. 2001;31:819–830. doi: 10.1016/s0896-6273(01)00418-4. [DOI] [PubMed] [Google Scholar]
- Evers BM, Townsend CM, Jr, Upp JR, Allen E, Hurlbut SC, Kim SW, Rajaraman S, Singh P, Reubi JC, Thompson JC. Establishment and characterization of a human carcinoid in nude mice and effect of various agents on tumor growth. Gastroenterology. 1991;101:303–311. doi: 10.1016/0016-5085(91)90004-5. [DOI] [PubMed] [Google Scholar]
- Fisher RJ, Pevsner J, Burgoyne RD. Control of fusion pore dynamics during exocytosis by Munc18. Science. 2001;291:875–878. doi: 10.1126/science.291.5505.875. [DOI] [PubMed] [Google Scholar]
- Fulop T, Radabaugh S, Smith C. Activity-dependent differential transmitter release in mouse adrenal chromaffin cells. J Neurosci. 2005;25:7324–7332. doi: 10.1523/JNEUROSCI.2042-05.2005. [DOI] [PMC free article] [PubMed] [Google Scholar]
- Gasman S, Chasserot-Golaz S, Malacombe M, Way M, Bader MF. Regulated exocytosis in neuroendocrine cells: a role for subplasmalemmal Cdc42/N-WASP-induced actin filaments. Mol Biol Cell. 2004;15:520–531. doi: 10.1091/mbc.E03-06-0402. [DOI] [PMC free article] [PubMed] [Google Scholar]
- Gauthier NC, Fardin MA, Roca-Cusachs P, Sheetz MP. Temporary increase in plasma membrane tension coordinates the activation of exocytosis and contraction during cell spreading. Proc Natl Acad Sci USA. 2011;108:14467–14472. doi: 10.1073/pnas.1105845108. [DOI] [PMC free article] [PubMed] [Google Scholar]
- Gerachshenko T, Schwartz E, Bleckert A, Photowala H, Seymour A, Alford S. Presynaptic G-protein-coupled receptors dynamically modify vesicle fusion, synaptic cleft glutamate concentrations, and motor behavior. J Neurosci. 2009;29:10221–10233. doi: 10.1523/JNEUROSCI.1404-09.2009. [DOI] [PMC free article] [PubMed] [Google Scholar]
- Gomes ER, Jani S, Gundersen GG. Nuclear movement regulated by Cdc42, MRCK, myosin, and actin flow establishes MTOC polarization in migrating cells. Cell. 2005;121:451–463. doi: 10.1016/j.cell.2005.02.022. [DOI] [PubMed] [Google Scholar]
- Gonzalez-Jamett AM, Momboisse F, Guerra MJ, Ory S, Baez-Matus X, Barraza N, Calco V, Houy S, Couve E, Neely A, et al. Dynamin-2 regulates fusion pore expansion and quantal release through a mechanism that involves actin dynamics in neuroendocrine chromaffin cells. PLoS One. 2013;8:e70638. doi: 10.1371/journal.pone.0070638. [DOI] [PMC free article] [PubMed] [Google Scholar]
- Grafmuller A, Shillcock J, Lipowsky R. Pathway of membrane fusion with two tension-dependent energy barriers. Phys Rev Lett. 2007;98:218101. doi: 10.1103/PhysRevLett.98.218101. [DOI] [PubMed] [Google Scholar]
- Graham ME, O'Callaghan DW, McMahon HT, Burgoyne RD. Dynamin-dependent and dynamin-independent processes contribute to the regulation of single vesicle release kinetics and quantal size. Proc Natl Acad Sci USA. 2002;99:7124–7129. doi: 10.1073/pnas.102645099. [DOI] [PMC free article] [PubMed] [Google Scholar]
- Harata NC, Aravanis AM, Tsien RW. Kiss-and-run and full-collapse fusion as modes of exo-endocytosis in neurosecretion. J Neurochem. 2006;97:1546–1570. doi: 10.1111/j.1471-4159.2006.03987.x. [DOI] [PubMed] [Google Scholar]
- Huet S, Fanget I, Jouannot O, Meireles P, Zeiske T, Larochette N, Darchen F, Desnos C. Myrip couples the capture of secretory granules by the actin-rich cell cortex and their attachment to the plasma membrane. J Neurosci. 2012;32:2564–2577. doi: 10.1523/JNEUROSCI.2724-11.2012. [DOI] [PMC free article] [PubMed] [Google Scholar]
- Huet S, Karatekin E, Tran VS, Fanget I, Cribier S, Henry JP. Analysis of transient behavior in complex trajectories: application to secretory vesicle dynamics. Biophys J. 2006;91:3542–3559. doi: 10.1529/biophysj.105.080622. [DOI] [PMC free article] [PubMed] [Google Scholar]
- Karatekin E, Sandre O, Guitouni H, Borghi N, Puech PH, Brochard-Wyart F. Cascades of transient pores in giant vesicles: line tension and transport. Biophys J. 2003;84:1734–1749. doi: 10.1016/S0006-3495(03)74981-9. [DOI] [PMC free article] [PubMed] [Google Scholar]
- Karatekin E, Tran VS, Huet S, Fanget I, Cribier S, Henry JP. A 20-nm step toward the cell membrane preceding exocytosis may correspond to docking of tethered granules. Biophys J. 2008;94:2891–2905. doi: 10.1529/biophysj.107.116756. [DOI] [PMC free article] [PubMed] [Google Scholar]
- Katsov K, Muller M, Schick M. Field theoretic study of bilayer membrane fusion. I. Hemifusion mechanism. Biophys J. 2004;87:3277–3290. doi: 10.1529/biophysj.103.038943. [DOI] [PMC free article] [PubMed] [Google Scholar]
- Kesavan J, Borisovska M, Bruns D. v-SNARE actions during Ca(2+)-triggered exocytosis. Cell. 2007;131:351–363. doi: 10.1016/j.cell.2007.09.025. [DOI] [PubMed] [Google Scholar]
- Leung T, Chen XQ, Tan I, Manser E, Lim L. Myotonic dystrophy kinase-related Cdc42-binding kinase acts as a Cdc42 effector in promoting cytoskeletal reorganization. Mol Cell Biol. 1998;18:130–140. doi: 10.1128/mcb.18.1.130. [DOI] [PMC free article] [PubMed] [Google Scholar]
- Lieber AD, Yehudai-Resheff S, Barnhart EL, Theriot JA, Keren K. Membrane tension in rapidly moving cells is determined by cytoskeletal forces. Curr Biol. 2013;23:1409–1417. doi: 10.1016/j.cub.2013.05.063. [DOI] [PubMed] [Google Scholar]
- Lynch KL, Gerona RR, Kielar DM, Martens S, McMahon HT, Martin TF. Synaptotagmin-1 utilizes membrane bending and SNARE binding to drive fusion pore expansion. Mol Biol Cell. 2008;19:5093–5103. doi: 10.1091/mbc.E08-03-0235. [DOI] [PMC free article] [PubMed] [Google Scholar]
- Malacombe M, Ceridono M, Calco V, Chasserot-Golaz S, McPherson PS, Bader MF, Gasman S. Intersectin-1L nucleotide exchange factor regulates secretory granule exocytosis by activating Cdc42. EMBO J. 2006;25:3494–3503. doi: 10.1038/sj.emboj.7601247. [DOI] [PMC free article] [PubMed] [Google Scholar]
- Michael DJ, Ritzel RA, Haataja L, Chow RH. Pancreatic beta-cells secrete insulin in fast- and slow-release forms. Diabetes. 2006;55:600–607. doi: 10.2337/diabetes.55.03.06.db05-1054. [DOI] [PubMed] [Google Scholar]
- Miesenbock G, De Angelis DA, Rothman JE. Visualizing secretion and synaptic transmission with pH-sensitive green fluorescent proteins. Nature. 1998;394:192–195. doi: 10.1038/28190. [DOI] [PubMed] [Google Scholar]
- Miklavc P, Wittekindt OH, Felder E, Dietl P. Ca2+-dependent actin coating of lamellar bodies after exocytotic fusion: a prerequisite for content release or kiss-and-run. Ann NY Acad Sci. 2009;1152:43–52. doi: 10.1111/j.1749-6632.2008.03989.x. [DOI] [PubMed] [Google Scholar]
- Monck JR, Alvarez de Toledo G, Fernandez JM. Tension in secretory granule membranes causes extensive membrane transfer through the exocytotic fusion pore. Proc Natl Acad Sci USA. 1990;87:7804–7808. doi: 10.1073/pnas.87.20.7804. [DOI] [PMC free article] [PubMed] [Google Scholar]
- Montesinos MS, Machado JD, Camacho M, Diaz J, Morales YG, Alvarez de la Rosa D, Carmona E, Castaneyra A, Viveros OH, O'Connor DT, et al. The crucial role of chromogranins in storage and exocytosis revealed using chromaffin cells from chromogranin A null mouse. J Neurosci. 2008;28:3350–3358. doi: 10.1523/JNEUROSCI.5292-07.2008. [DOI] [PMC free article] [PubMed] [Google Scholar]
- Nambiar R, McConnell RE, Tyska MJ. Control of cell membrane tension by myosin-I. Proc Natl Acad Sci USA. 2009;106:11972–11977. doi: 10.1073/pnas.0901641106. [DOI] [PMC free article] [PubMed] [Google Scholar]
- Neco P, Fernandez-Peruchena C, Navas S, Gutierrez LM, de Toledo GA, Ales E. Myosin II contributes to fusion pore expansion during exocytosis. J Biol Chem. 2008;283:10949–10957. doi: 10.1074/jbc.M709058200. [DOI] [PubMed] [Google Scholar]
- Nightingale TD, White IJ, Doyle EL, Turmaine M, Harrison-Lavoie KJ, Webb KF, Cramer LP, Cutler DF. Actomyosin II contractility expels von Willebrand factor from Weibel-Palade bodies during exocytosis. J Cell Biol. 2011;194:613–629. doi: 10.1083/jcb.201011119. [DOI] [PMC free article] [PubMed] [Google Scholar]
- Nofal S, Becherer U, Hof D, Matti U, Rettig J. Primed vesicles can be distinguished from docked vesicles by analyzing their mobility. J Neurosci. 2007;27:1386–1395. doi: 10.1523/JNEUROSCI.4714-06.2007. [DOI] [PMC free article] [PubMed] [Google Scholar]
- Racine V, Hertzog A, Jouanneau J, Salamero J, Kervrann C, Sibarita J-B. Multiple-target tracking of 3D fluorescent objects based on simulated annealing. Presented at 2006 IEEE International Symposium on Biomedical Imaging, April 6–9, 2006; Arlington, VA. 2006. [Google Scholar]
- Raucher D, Sheetz MP. Characteristics of a membrane reservoir buffering membrane tension. Biophys J. 1999;77:1992–2002. doi: 10.1016/S0006-3495(99)77040-2. [DOI] [PMC free article] [PubMed] [Google Scholar]
- Sankaranarayanan S, De Angelis D, Rothman JE, Ryan TA. The use of pHluorins for optical measurements of presynaptic activity. Biophys J. 2000;79:2199–2208. doi: 10.1016/S0006-3495(00)76468-X. [DOI] [PMC free article] [PubMed] [Google Scholar]
- Sato M, Kitaguchi T, Numano R, Ikematsu K, Kakeyama M, Murata M, Sato K, Tsuboi T. The small GTPase Cdc42 modulates the number of exocytosis-competent dense-core vesicles in PC12 cells. Biochem Biophys Res Commun. 2012;420:417–421. doi: 10.1016/j.bbrc.2012.03.010. [DOI] [PubMed] [Google Scholar]
- Schonn JS, Desnos C, Henry JP, Darchen F. Transmitter uptake and release in PC12 cells overexpressing plasma membrane monoamine transporters. J Neurochem. 2003;84:669–677. doi: 10.1046/j.1471-4159.2003.01561.x. [DOI] [PubMed] [Google Scholar]
- Sinha B, Koster D, Ruez R, Gonnord P, Bastiani M, Abankwa D, Stan RV, Butler-Browne G, Vedie B, Johannes L, et al. Cells respond to mechanical stress by rapid disassembly of caveolae. Cell. 2011;144:402–413. doi: 10.1016/j.cell.2010.12.031. [DOI] [PMC free article] [PubMed] [Google Scholar]
- Sorensen JB. Conflicting views on the membrane fusion machinery and the fusion pore. Annu Rev Cell Dev Biol. 2009;25:513–537. doi: 10.1146/annurev.cellbio.24.110707.175239. [DOI] [PubMed] [Google Scholar]
- Takahashi N, Kishimoto T, Nemoto T, Kadowaki T, Kasai H. Fusion pore dynamics and insulin granule exocytosis in the pancreatic islet. Science. 2002;297:1349–1352. doi: 10.1126/science.1073806. [DOI] [PubMed] [Google Scholar]
- Tolic‘-Nørrelykke SF, Schaffer E, Howard J, Pavone FS, Julicher F, Flyvbjerg H. Calibration of optical tweezers with positional detection in the back focal plane. Rev Sci Instrum. 2006;77:103101. [Google Scholar]
- Tran VS, Huet S, Fanget I, Cribier S, Henry JP, Karatekin E. Characterization of sequential exocytosis in a human neuroendocrine cell line using evanescent wave microscopy and “virtual trajectory” analysis. Eur Biophys J. 2007;37:55–69. doi: 10.1007/s00249-007-0161-3. [DOI] [PubMed] [Google Scholar]
- Vardjan N, Stenovec M, Jorgacevski J, Kreft M, Zorec R. Subnanometer fusion pores in spontaneous exocytosis of peptidergic vesicles. J Neurosci. 2007;27:4737–4746. doi: 10.1523/JNEUROSCI.0351-07.2007. [DOI] [PMC free article] [PubMed] [Google Scholar]
- Wang CT, Bai J, Chang PY, Chapman ER, Jackson MB. Synaptotagmin-Ca2+ triggers two sequential steps in regulated exocytosis in rat PC12 cells: fusion pore opening and fusion pore dilation. J Physiol. 2006;570:295–307. doi: 10.1113/jphysiol.2005.097378. [DOI] [PMC free article] [PubMed] [Google Scholar]
- Wang CT, Grishanin R, Earles CA, Chang PY, Martin TF, Chapman ER, Jackson MB. Synaptotagmin modulation of fusion pore kinetics in regulated exocytosis of dense-core vesicles. Science. 2001;294:1111–1115. doi: 10.1126/science.1064002. [DOI] [PubMed] [Google Scholar]
- Wang Z, Oh E, Thurmond DC. Glucose-stimulated Cdc42 signaling is essential for the second phase of insulin secretion. J Biol Chem. 2007;282:9536–9546. doi: 10.1074/jbc.M610553200. [DOI] [PMC free article] [PubMed] [Google Scholar]
- Wen PJ, Osborne SL, Zanin M, Low PC, Wang HT, Schoenwaelder SM, Jackson SP, Wedlich-Soldner R, Vanhaesebroeck B, Keating DJ, et al. Phosphatidylinositol(4,5)bisphosphate coordinates actin-mediated mobilization and translocation of secretory vesicles to the plasma membrane of chromaffin cells. Nat Commun. 2011;2:491. doi: 10.1038/ncomms1500. [DOI] [PubMed] [Google Scholar]
- Willig KI, Kellner RR, Medda R, Hein B, Jakobs S, Hell SW. Nanoscale resolution in GFP-based microscopy. Nat Methods. 2006;3:721–723. doi: 10.1038/nmeth922. [DOI] [PubMed] [Google Scholar]
- Xu Y, Rubin BR, Orme CM, Karpikov A, Yu C, Bogan JS, Toomre DK. Dual-mode of insulin action controls GLUT4 vesicle exocytosis. J Cell Biol. 2011;193:643–653. doi: 10.1083/jcb.201008135. [DOI] [PMC free article] [PubMed] [Google Scholar]
- Yizhar O, Ashery U. Modulating vesicle priming reveals that vesicle immobilization is necessary but not sufficient for fusion-competence. PLoS One. 2008;3:e2694. doi: 10.1371/journal.pone.0002694. [DOI] [PMC free article] [PubMed] [Google Scholar]
- Yuseff MI, Reversat A, Lankar D, Diaz J, Fanget I, Pierobon P, Randrian V, Larochette N, Vascotto F, Desdouets C, et al. Polarized secretion of lysosomes at the B cell synapse couples antigen extraction to processing and presentation. Immunity. 2011;35:361–374. doi: 10.1016/j.immuni.2011.07.008. [DOI] [PubMed] [Google Scholar]
- Zhang Q, Li Y, Tsien RW. The dynamic control of kiss-and-run and vesicular reuse probed with single nanoparticles. Science. 2009;323:1448–1453. doi: 10.1126/science.1167373. [DOI] [PMC free article] [PubMed] [Google Scholar]
- Zimmerberg J, Curran M, Cohen FS, Brodwick M. Simultaneous electrical and optical measurements show that membrane fusion precedes secretory granule swelling during exocytosis of beige mouse mast cells. Proc Natl Acad Sci USA. 1987;84:1585–1589. doi: 10.1073/pnas.84.6.1585. [DOI] [PMC free article] [PubMed] [Google Scholar]
Associated Data
This section collects any data citations, data availability statements, or supplementary materials included in this article.