Abstract
The balance between mitochondrial fusion and fission influences the reticular shape of mitochondria in yeasts. Little is known about whether mitochondria fusion occurs in plants. Plant mitochondria are usually more numerous and more grain-shaped than animal mitochondria. blast searches of the nuclear and mitochondrial genome sequences of Arabidopsis thaliana did not find any obvious homologue of mitochondrial fusion genes found in animals and yeasts. To determine whether mitochondrial fusion actually occurs in plants, we labeled mitochondria in onion epidermal cells with a mitochondria-targeted, photoconvertible fluorescent protein Kaede and then altered the fluorescence of some of the mitochondria within a cell from green to red. Frequent and transient fusion of red and green mitochondria was demonstrated by the appearance of yellow mitochondria that subsequently redivided. We also show that mitochondrial fission occasionally occurs without an equal distribution of the nucleoid (DNA–protein complex in mitochondria), resulting in the coexistence of mitochondria containing various amounts of DNA within a single cell. The heterogeneity of DNA contents in mitochondria may be overcome by the frequent and transient fusion of mitochondria.
In animals and yeasts, mitochondrial morphology varies dynamically as a result of the balance between mitochondrial fusion and fission (1–4). Several genes relating to mitochondrial fission and fusion have been found, especially in yeast (3–8). However, in Arabidopsis thaliana, no fusion-related genes have been found in either the nuclear or mitochondrial genomes, although a few fission-related genes have been found by blast searches (9, 10). At present, only indirect evidence of plant mitochondrial fusion has been reported. Mitochondrial fusion was suggested by the appearance of novel restriction patterns in mtDNA as a result of recombination between the mitochondrial genomes of fused protoplasts (11).
The mitochondrial genomes of higher plants are larger and more complex than those of other organisms. The genomes consist of multiple molecules with many repeated sequences that are characterized by active homologous recombination (12, 13). Plant mitochondria occasionally have less DNA than expected based on their whole genome size (14–17). It has been proposed that mitochondrial fusion in higher plants compensates for this shortage of DNA (18).
In this study, to obtain direct evidence of mitochondrial fusion in higher plants, we used a photoconvertible fluorescent protein, Kaede. Kaede (the Japanese word for maple tree) is a recently isolated fluorescent protein from a stony coral, whose emission color can be irreversibly changed from green to red by exposure to 350- to 400-nm wavelength light (19, 20). By using Kaede with a mitochondrial presequence, the mitochondria in a single cell were labeled with green fluorescence and then part of them were photoconverted to red fluorescence. Consequently, frequent mitochondrial fusion between the red and green mitochondria was detected by the appearance of yellow mitochondria. This report of Kaede being used to understand a biological problem is previously uninvestigated. We also show that mitochondrial DNA is unevenly distributed during mitochondrial division in living cells.
Materials and Methods
Plasmid Construction. The coding region of Kaede was subcloned from the plasmid pKaede (Amalgaam, Tokyo) into the general plant expression vector with the CaMV35S promoter and the NOS terminator. The N-terminal 36 aa of the Arabidopsis mitochondrial ATPase δ subunit (21) and the N-terminal 98 aa of rice chloroplast ribosomal protein S9 (22) were subcloned into the Kaede plasmid as presequence and transit peptides, respectively. The PTS-1 peroxisome localization signal [C-terminal SKL sequence (23)] was generated from the Kaede expression vector by using a QuikChange XL Site-Directed Mutagenesis Kit (Stratagene). Each of the constructed plasmids was checked by sequencing.
Plant Cells. The experiments were conducted with onion epidermal cells and tobacco BY-2 cells. Onion epidermal cells were chosen for two reasons. First, they constitute a single-cell-layer organ, in which it is easy to find a few transformed cells among a large number of untransformed cells. Second, because they have a large cell volume, it is possible to selectively expose part of a cell to UV light and to observe many mitochondria at one time. Tobacco BY-2 cells were chosen because they stain well with both MitoTracker (Molecular Probes) and SYBR Green I (Molecular Probes).
Transformation. Plasmid DNA was transiently introduced into tobacco BY-2 cells and onion epidermal cells on agar plates by a helium-driven particle accelerator (PDS/1000; Bio-Rad) with all basic adjustments set according to the manufacturer's recommendations. Bombardment parameters were the following: 1,100-psi bombardment pressure, 1.6-μm gold particles, a distance of 12 cm from macrocarrier to samples, and a decompression vacuum of ≈95,000 Pa. The transformation efficiency varied widely, with the percent of the bombarded cells that were transformed, varying from 0.1 to 1.0% in each bombardment. The bombarded onion cells and BY-2 cells were incubated for ≈2 days under dark conditions at 22°C and 27°C, respectively, and then observed under the microscope.
Microscopic Observations. All pieces of the bombarded samples were imaged vitally without fixation by using a fluorescence microscope [Nikon Eclipse-600 with ×40 (numerical aperture, 0.75) or ×100 (numerical aperture, 1.40) objectives, Nikon] and a confocal laser scanning microscope system (MicroRadiance MR/AG-2, Bio-Rad). BY-2 cells and onion cells were treated with 500 nM MitoTracker Orange CMTMRos (Molecular Probes) and 1:1,000 diluted SYBR Green I (Molecular Probes). The samples were illuminated with an argon ion laser with 488-nm light for green Kaede and for SYBR Green I and a green HeNe laser with 543-nm light for red Kaede and for MitoTracker. Kaede was photoconverted with a Nikon Eclipse-600 fluorescence microscope with a V-2A filter set (Nikon). The exposed area was restricted by closing the field diaphragm lever of the epi-fluorescence attachment of the Nikon Eclipse-600. Exposure time was 5–10 sec. In onion epidermal cells, images were obtained by superimposing several images on the same position except that the z-axis position of the focal plane was varied by steps of 5 μm for onion or 0.5 μm for BY-2. The colocalization histograms in Fig. 3 were made by the computer program image-pro plus (Media Cybernetics, Silver Spring, MD). All analyses were repeated more than three times, and representative data are shown. All images were prepared by using photoshop 7.0 (Adobe Systems, Mountain View, CA).
Fig. 3.
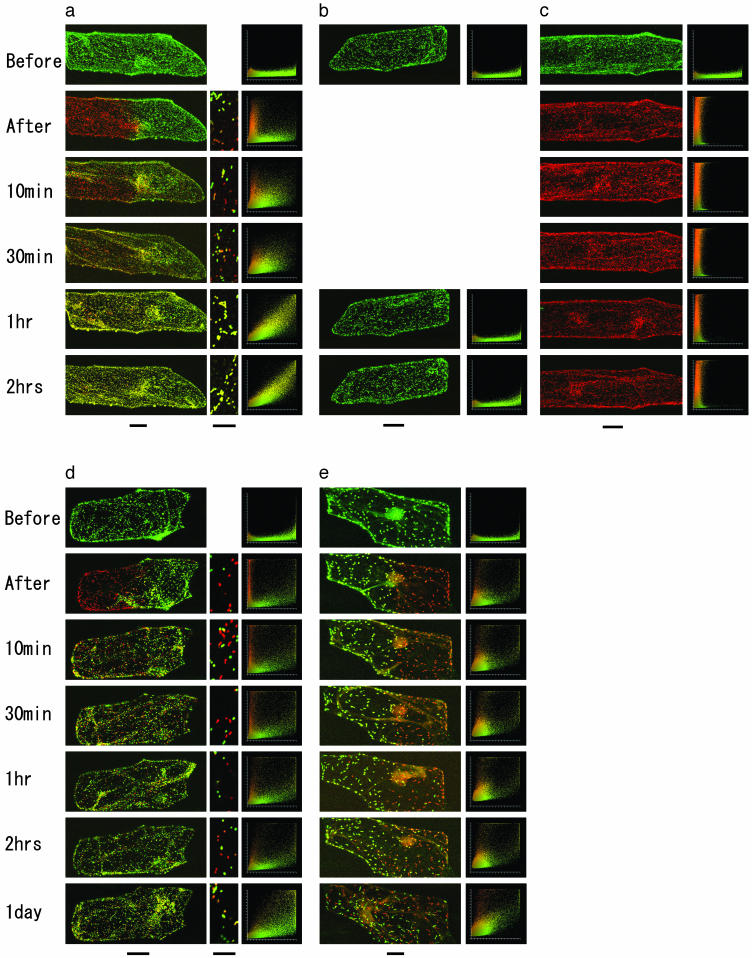
Fusion of organelles in single onion bulb epidermal cells transformed with Kaede fusion proteins. (a) Mitochondria. (b) A non-UV-exposed control (mitochondria). (c) A whole-UV-exposed control (mitochondria). (d) Peroxisomes. (e) Plastids. A portion of each cell was exposed to UV to photoconvert some of the organelles to red. High-magnification images are also shown for mitochondria (a) and peroxisomes (d). In mitochondria, Kaede was completely redistributed within 2 h. Colocalization histograms plot each pixel according to its red intensity (y axis) and green intensity (x axis). Pixels with well colocalized red and green fluorescence appear as a narrow diagonal line. Scale bars (at the bottom of a–e) indicate 50 μm for whole-cell images and 10 μm for high-magnification images.
Results
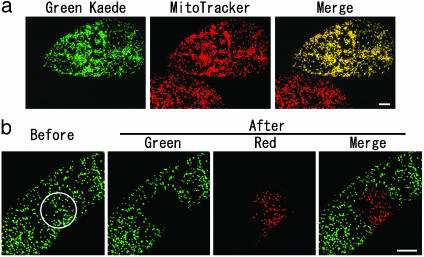
Photoconversion of Mitochondria-Targeted Kaede. The plant expression vector consisting of Kaede and a mitochondrial presequence was introduced into tobacco suspension BY-2 cells. Kaede was confirmed to localize to the mitochondria (Fig. 1a). Exposure of mitochondria in a restricted portion of a transformed cell to 380- to 420-nm wavelength light by a fluorescence microscope turned them to red (Fig. 1b).
Fig. 1.
Restricted photoconversion of Kaede with a mitochondrial presequence (Mt-Kaede) in a BY-2 cell. (a) Mitochondria were stained by MitoTracker. Native Kaede signals appear green. (Scale bar, 10 μm.) (b) Restricted photoconversion of Mt-Kaede in a BY-2 cell. The area in the white circle was irradiated with 380- to 420-nm wavelength light. (Scale bar, 10 μm.)
Mitochondrial Fusion in Onion Epidermal Cells. Fusion of green and red mitochondria was demonstrated by the appearance of yellow mitochondria in bulb epidermal cells of onion (Allium cepa L.) (Fig. 2 and Movie 1, which is published as supporting information on the PNAS web site). In each of the observed 16 fusions, a constriction remained at the site of fusion (Fig. 2, arrowheads). The red and green fluorescent labels rapidly mixed (within 3 sec) to form yellow. In Fig. 2b, the fused mitochondria then divided, apparently at the constriction site, and separated.
Fig. 2.
Mitochondrial fusion in onion bulb epidermal cells. (a) Mitochondrial fusion. (b) Mitochondrial fusion and fission. Time-course observations of red and green mitochondria. Images were acquired at 3-sec intervals, and representative ones are shown. Arrowheads indicate constrictions at the point of fusion. (Scale bars, 2 μm.) See Movie 1.
Frequent Mitochondrial Fusion. The time course of mitochondrial fusion in an onion epidermal cell is shown in Fig. 3. This cell is typical in that it has a >10,000-grain mitochondria. The mitochondrial complement in half of the transformed cell was photoconverted. At first, many small green and red mitochondria moved into each other's area of the cell. The number of yellow (fused) mitochondria gradually increased and the numbers of red and green mitochondria decreased. In the colocalization histograms, points in the vertical (red) and horizontal (green) clouds gathered into a thin diagonal cloud. The transition to a uniform color took between 1 and 2 h. A non-UV-exposed control remained green (Fig. 3b), ruling out the possibility that the yellow color had arisen from exposure of some of the green Kaede to normal microscope illumination. A whole cell exposed to UV (Fig. 3c) remained red, which rules out the possibility that the yellow color had arisen from synthesis of green Kaede that was subsequently transported into the red mitochondria. When Kaede was combined with signal peptides for peroxisomes and plastids and a portion of these organelles were photoconverted, no transition to a uniform color was observed, even 1 day after the photoconversion (Fig. 3 d and e). Thus, the fusion of mitochondria appeared to be a much more active process than the fusion of plastids (24) and peroxisomes.
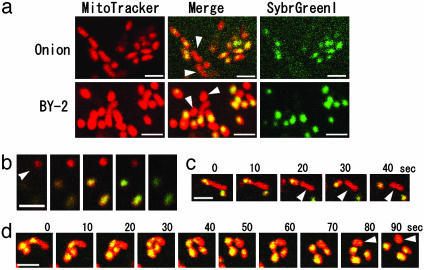
Mitochondrial Nucleoid Distribution During Mitochondrial Fission. How is the mitochondrial genome properly maintained in the course of frequent fusion and fission cycles in higher plant cells? To elucidate the mitochondrial genome distribution during mitochondrial fission, we observed mitochondria and the mitochondrial genome simultaneously in living onion epidermal cells and tobacco suspension cells (BY-2) by staining the mitochondria with MitoTracker Orange and by staining the mitochondrial genome with SYBR Green I (Fig. 4a). Mitochondrial DNAs were detected as green punctate forms [referred to as nucleoids (25)] in red mitochondria. When the two stains are viewed simultaneously, the nucleoids appear yellow (Fig. 4a Center). In some mitochondria (Fig. 4, arrowheads) the amount of mitochondrial DNA was below the limit of detection by SYBR Green I fluorescence, even with longer staining times (data not shown). The absence of green fluorescence was not a result of the choice of focal plane (Fig. 4b). Thus, in mitochondria with SYBR Green I nucleoids, the nucleoids do not always divide equally, resulting in the coexistence of mitochondria with unequal amounts of DNA (Fig. 4 c and d and Movies 2–4, which are published in supporting information on the PNAS web site).
Fig. 4.
Mitochondria and mitochondrial nucleoids in tobacco suspension cultured cells (BY-2). (a) Mitochondria stained by MitoTracker (Left) and mitochondrial nucleoids stained by Sybr Green I (Right). In the merged images (Center), the nucleoids appear yellow because of the combination of red and green fluorescence. Arrowheads indicate mitochondria that have no visible nucleoids. (b) Views of three mitochondria at 0.5-μm intervals along the optical axis. Yellow nucleoids are visible in the lower two mitochondria but not in the top mitochondria. (c and d) Time series of fission of mitochondria with nucleoids shown at 10-sec intervals. (Scale bars, 2 μm.) Movies 2–4.
Discussion
Mitochondrial fusion in live onion epidermal cells was directly observed under the microscope (Figs. 2 and 3). In these cells, the mitochondrial fused frequently enough to allow the red and green mitochondria in a cell to reach a uniform color in 1–2 h (Fig. 3). In the course of this transition, the shape and numbers of onion mitochondria did not seem to change. Mitochondria in onion epidermal cells usually didn't fuse into fewer and larger spherical mitochondria, but fused only transiently so that their shape was maintained. This transient mitochondrial fusion resembles the so-called “kiss-and-run” exocytosis in animal cells, in which vesicles fuse transiently to the plasma membrane and are then pinched off without losing their identities (26–29). Further studies are needed to determine whether this type of mitochondrial fusion is specific to nondividing plant cells, such as onion epidermal cells. In any case, frequent and transient fusion of mitochondria may make it possible for all the mitochondria in a cell to share their internal molecules without changing their grain shape or ability to move.
The shortage and variation of mitochondrial DNA content in plants were investigated in the 1980s and early 1990s (14–17) but have been somewhat neglected in recent years. How the mitochondria of higher plants can function properly with reduced (or variegated) DNA contents was addressed by Lonsdale et al. (18), who hypothesized that the mitochondria form a dynamic syncytium in which the mtDNA population of individual cells is panmictic and in a state of recombinational equilibrium. In mammals, mitochondria with defective genomes can be complemented by other mitochondria (30, 31). The heterogeneity of nucleoids in many grain-shaped plant mitochondria may also be overcome by frequent mitochondrial fusion.
Supplementary Material
Acknowledgments
We thank Prof. M. Nishimura and Dr. S. Mano for helpful discussions during the course of this study and Prof. W. Sakamoto (Research Institute for Bioresources, Okayama University, Okayama, Japan) for kindly providing the ATPase delta presequence-GFP (Mt-GFP) expression vector. This research was supported by a research fellowship of the Japan Society for the Promotion of Science for young scientists.
This paper was submitted directly (Track II) to the PNAS office.
References
- 1.Bereiter-Hahn, J. & Voth, M. (1994) Microsc. Res. Tech. 27, 198-219. [DOI] [PubMed] [Google Scholar]
- 2.Nunnari, J., Marshall, W. F., Straight, A., Murray, A., Sedat, J. W. & Walter, P. (1997) Mol. Biol. Cell 8, 1233-1242. [DOI] [PMC free article] [PubMed] [Google Scholar]
- 3.Bleazard, W., McCaffery, J. M., King, E. J., Bale, S., Mozdy, A., Tieu, Q., Nunnari, J. & Shaw, J. M. (1999) Nat. Cell Biol. 1, 298-304. [DOI] [PMC free article] [PubMed] [Google Scholar]
- 4.Sesaki, H. & Jensen, R. E. (1999) J. Cell Biol. 147, 699-706. [DOI] [PMC free article] [PubMed] [Google Scholar]
- 5.Hales, K. G. & Fuller, M. T. (1997) Cell 90, 121-129. [DOI] [PubMed] [Google Scholar]
- 6.Sesaki, H. & Jensen, R. E. (2001) J. Cell Biol. 152, 1123-1134. [DOI] [PMC free article] [PubMed] [Google Scholar]
- 7.Mozdy, A. D. & Shaw, J. M. (2003) Nat. Rev. Mol. Cell Biol. 4, 468-478. [DOI] [PubMed] [Google Scholar]
- 8.Westermann, B. (2003) Biochim. Biophys. Acta 1641, 195-202. [DOI] [PubMed] [Google Scholar]
- 9.Logan, D. C. (2003) New Phytol. 160, 463-478. [DOI] [PubMed] [Google Scholar]
- 10.Arimura, S. & Tsutsumi, N. (2002) Proc. Natl. Acad. Sci. USA 99, 5727-5731. [DOI] [PMC free article] [PubMed] [Google Scholar]
- 11.Belliard, G., Vedel, F. & Pelletier, G. (1979) Nature 281, 401-403. [Google Scholar]
- 12.Lonsdale, D. M., Hodge, T. P. & Fauron, C. M. R. (1984) Nucleic Acids Res. 12, 9249-9261. [DOI] [PMC free article] [PubMed] [Google Scholar]
- 13.Palmer, J. D. & Schields, C. R. (1984) Nature 307, 437-440. [Google Scholar]
- 14.Bendich, A. J. & Gauriloff, L. P. (1984) Protoplasma 119, 1-7. [Google Scholar]
- 15.Kuroiwa, T., Fujie, M. & Kuroiwa, H. (1992) J. Cell Sci. 101, 483-493. [Google Scholar]
- 16.Fujie, M., Kuroiwa, H., Kawano, S. & Kuroiwa, T. (1993) Planta 189, 443-452. [DOI] [PubMed] [Google Scholar]
- 17.Satoh, M., Nemoto, Y., Kawano, S., Nagata, T., Hirokawa, H. & Kuroiwa, T. (1993) Protoplasma 175, 112-120. [Google Scholar]
- 18.Lonsdale, D. M., Brears, T., Hodge, T. P., Merville, S. E. & Rottmann, W. H. (1988) Philos. Trans. R. Soc. London B 319, 149-163. [Google Scholar]
- 19.Ando, R., Hama, H., Yamamoto-Hino, M., Mizuno, H. & Miyawaki, A. (2002) Proc. Natl. Acad. Sci. USA 99, 12651-12656. [DOI] [PMC free article] [PubMed] [Google Scholar]
- 20.Mizuno, H., Mal, T. K., Tong, K. I., Ando, R., Furuta, T., Ikura, M. & Miyawaki, A. (2003) Mol. Cell 12, 1051-1058. [DOI] [PubMed] [Google Scholar]
- 21.Sakamoto, W. & Wintz, H. (1996) Plant Physiol. 112, 1736. [Google Scholar]
- 22.Arimura, S., Takusagawa, S., Hatano, S., Nakazono, M., Hirai, A. & Tsutsumi, N. (1999) FEBS Lett. 450, 231-234. [DOI] [PubMed] [Google Scholar]
- 23.Hayashi, M., Aoki, M., Kondo, M. & Nishimura, M. (1997) Plant Cell Physiol. 38, 759-768. [DOI] [PubMed] [Google Scholar]
- 24.Köhler, R. H., Cao, J., Zipfel, W. R., Webb, W. W. & Hanson, M. R. (1997) Science 276, 2039-2042. [DOI] [PubMed] [Google Scholar]
- 25.Miyakawa, I., Aoi, H., Sando, N. & Kuroiwa, T. (1984) J. Cell. Sci. 66, 21-38. [DOI] [PubMed] [Google Scholar]
- 26.Schneider, S. W. (2001) J. Membr. Biol. 181, 67-76. [PubMed] [Google Scholar]
- 27.Fesce, R., Grohovaz, F., Valtorta, F. & Meldolesi, J. (1994) Trends Cell Biol. 4, 1-4. [DOI] [PubMed] [Google Scholar]
- 28.Graham, M. E., O'Callaghan, D. W., McMahon, H. T. & Burgoyne, R. D. (2002) Proc. Natl. Acad. Sci. USA 99, 7124-7129. [DOI] [PMC free article] [PubMed] [Google Scholar]
- 29.Holroyd, P., Lang, T., Wenzel, D., De Camilli, P. & Jahn, R. (2002) Proc. Natl. Acad. Sci. USA 99, 16806-16811. [DOI] [PMC free article] [PubMed] [Google Scholar]
- 30.Nakada, K., Inoue, K., Ono, T., Isobe, K., Ogura, A., Goto, Y., Nonaka, I. & Hayashi, J. I. (2001) Nat. Med. 7, 934-940. [DOI] [PubMed] [Google Scholar]
- 31.Ono, T., Isobe, K., Nakada, K & Hayashi, J. (2001) Nat. Genet. 28, 272-275. [DOI] [PubMed] [Google Scholar]
Associated Data
This section collects any data citations, data availability statements, or supplementary materials included in this article.


