

Abstract
Mucolipidosis type IV is an autosomal recessive lysosomal storage disorder characterized by severe neurodegeneration, achlorhydria, and visual impairments such as corneal opacity and strabismus. The disease arises due to mutations in a group 2 transient receptor potential (TRP)-related cation channel, TRPML1. Mammals encode two additional TRPML proteins named TRPML2 and TRPML3. Information regarding the propensity of these proteins to multimerize, their subcellular distribution and mechanisms that regulate their trafficking are limited. Here we demonstrate that TRPMLs interact to form homo- and heteromultimers. Moreover, the presence of either TRPML1 or TRPML2 specifically influences the spatial distribution of TRPML3. TRPML1 and TRPML2 homo-multimers are lysosomal proteins, whereas TRPML3 homomultimers are in the endoplasmic reticulum. However, TRPML3 localizes to lysosomes when coexpressed with either TRPML1 or TRPML2 and is comparably mislocalized when lysosomal targeting of TRPML1 and TRPML2 is disrupted. Conversely, TRPML3 does not cause retention of TRPML1 or TRPML2 in the endoplasmic reticulum. These data demonstrate that there is a hierarchy controlling the subcellular distributions of the TRPMLs such that TRPML1 and TRPML2 dictate the localization of TRPML3 and not vice versa.
Mucolipidosis type IV (MLIV)2 is a developmental disorder with a variety of clinical manifestations ranging from achlorhydria to neuro-degeneration, psychomotor retardation, and visual impairments (1-3). The disease is a lysosomal storage disorder associated with lysosomal accumulation of macromolecules such as sphingolipids, phospholipids, and mucopolysaccharides (1). It was reported previously that MLIV does not appear to be due to defects in the activities of lysosomal enzymes but rather from perturbations in membrane sorting and trafficking during late steps in endocytosis and lysosomal biogenesis (4). However, a recent study indicates that cells obtained from patients with MLIV are characterized by over-acidified lysosomes and reduced acidic lipase activity (5).
MLIV is a consequence of mutations in a member of the group 2 subset of TRP cation channels (6) referred to as TRPML1 (Mucolipin1) (7-9). The group 2 TRPs also include TRPP proteins, two of which are disrupted in autosomal dominant polycystic kidney disease (6). Members of the five group 1 TRP subfamilies (TRPC, TRPV, TRPM, TRPA, and TRPN) are only distantly related to the TRPML and TRPP proteins, although all TRP channels contain six transmembrane segments.
TRPML1 has been localized to late endosomes and lysosomes (10, 11), and this spatial distribution, combined with phenotypic analyses of cells isolated from MLIV patients, led to the proposal that TRPML is required for lysosomal reformation/biogenesis (11). This conclusion is further supported by functional analyses of the Caenorhabditis elegans TRPML homolog, CUP-5 (12-15). Recently, TRPML1 has been reported to be a proton-leak channel in the lysosomes, thereby preventing excessive acidification of the lysosomal lumen (5).
In addition to TRPML1, mammals encode two other highly related proteins, TRPML2 and TRPML3, although the subcellular distributions of these latter proteins have not been defined. Nevertheless, mutations in mouse TRPML3 (encoded by mcoln3) have been shown to be responsible for the hearing, vestibular, and pigmentation defects associated with varitint-waddler mice (16).
A feature of many TRPs is their ability to heteromultimerize with closely related members within the same subfamily (17-23). However, it is not known whether group 2 TRP channels, such as the TRPMLs, share this characteristic.
In this report we used a fluorescence resonance energy transfer (FRET)-based approach to demonstrate that each TRPML protein was capable of forming homo- and heteromultimers with other members of the TRPML subfamily. Furthermore, we show that the subcellular distribution of TRPML3 is dictated by TRPML1 or TRPML2. When expressed individually, TRPML1 and TRPML2 were lysosomal membrane proteins whereas TRPML3 was retained in the ER. In contrast, when TRPML3 was coexpressed with either TRPML1 or TRPML2, it translocated to the lysosomes. Mislocalization of TRPML1 or TRPML2 to the plasma membrane, due to mutations in lysosomal targeting sequences or as result of interfering with clathrin-mediated endocytosis, caused a similar plasma membrane distribution of TRPML3. Since TRPML3 did not influence the localization of TRPML1 or TRPML2, these latter TRPML family members were dominant over TRPML3 with respect to trafficking.
EXPERIMENTAL PROCEDURES
Plasmids and cDNAs
The TRPML1 (GenBank™ accession number NM020533) and TRPML3 (GenBank™ accession number NM134160) expressed sequence tags (Invitrogen) cDNAs were subcloned into the pcDNA3.1 vector (Invitrogen). The TRPML2 clone was a gift from Sharon Matthews and Dr. Andrew Scharenberg (University of Washington). The truncated mutants described in supplemental Fig. S5 are TRPML1Δ1 (removal of C-terminal LLVN; supplemental Fig. S5B), TRPML1Δ2 (removal of the first 15 amino acids following the initiation methionine; supplemental Fig. S5C), TRPML1Δ3 (combination of the C- and N-terminal deletions; supplemental Fig. S5D) and TRPML2Δ1 (removal of the C-terminal DRLILID; supplemental Fig. S5F) were generated by PCR-mediated mutagenesis and subcloned into pcDNA3.1 (Invitrogen). The amo cDNA was previously described (24). To fuse TRPML1, −2, and −3 or AMO with enhanced YFP or enhanced CFP their translation STOP codons were replaced by in-frame XhoI or EcoRI restriction sites and then subcloned into the appropriate pcDNA3-CFP or -YFP fusion vectors (18). To fuse TRPML1–3, TRPML1Δ1–3, and TRPML2Δ1 with the HA tag, their STOP codons were replaced by the sequence encoding the HA tag followed by an in-frame XhoI restriction site and subcloned into pcDNA3.1. Sun-YFP and -CFP constructs have been described previously (25). The LAMP3 cDNA was provided by Dr. S. Gould (The Johns Hopkins University School of Medicine). ER-YFP was generated by fusing the ER-targeting sequence of calreticulin with a KDEL-retrieval sequence (EGFP-ER vector; Clontech) and subcloning into pcDNA3-YFP. GFP-Rab11 was provided by Dr. A. Hubbard (The Johns Hopkins University School of Medicine). TRPC6-YFP was described previously (26). GFP-Golgin160 was provided by Dr. C. Machamer (The Johns Hopkins University School of Medicine). Rab7 cDNA was obtained from the ATCC and was fused at its C terminus to the HA tag. Plasmids for expression of wild-type Dynamin 1a and Dynamin 1aK44A were obtained from Dr. A. Morielli (University of Vermont College of Medicine). AP180 cDNA clones were obtained from Drs. H. McMahon (Medical Research Council, Cambridge, UK) and E. Ungewickell (Hannover Medical School, Hannover, Germany).
Antibodies Used
Rabbit polyclonal anti-HA and mouse monoclonal anti-MYC antibodies were from Sigma, rabbit polyclonal Rab5 and Rab8 antibodies were from Santa Cruz Biotechnology, and all Alexa-conjugated anti-rabbit and anti-mouse secondary antibodies were from Molecular Probes.
Cell Culture and Transient Transfections
HEK293 cells were cultured in Dulbecco’s minimum essential medium (Invitrogen) supplemented with 10% fetal bovine serum (Invitrogen) and plated on poly-d lysine-coated 35-mm glass bottom microwell dishes (Mattek Corp.) 24 h prior to transfection. 3 μl of FuGENE 6 (Roche Applied Science) was used per μg of DNA used for transfection. Cells were used 72 h post-transfection. For the confocal studies, exactly 1 μg of each construct was used per dish in an attempt to ensure equal expression of the various constructs.
FRET
The TRPML proteins, which were fused to either CFP or YFP, were coexpressed in HEK293 cells. The vectors encoding the TRPML-YFP fusions were introduced at a slight excess to minimize the probability of TRPML-CFP-only multimers. The live cells were imaged at normal ambient temperature using an Axiovert 135 TV microscope (Zeiss) with a Plan-APOCHROMAT 100× oil immersion objective (N.A. 1.4) (Zeiss) and a CoolSnap HQ CCD camera (Photometrics). Excitation and emission wavelengths were controlled by filter wheels (Ludl) included in the excitation and emission paths, respectively. In a subset of experiments, an Olympus IX70 inverted microscope equipped with a polychrome IV monochromator (TILL Photonics), an Olympus 40× UApo objective, a Sensicam CCD camera (PCO), and a Lambda 10-2 emission filter wheel (Sutter Instruments) were used, essentially as previously described (18, 19). For the acceptor-bleach protocol, cells were excited at 4–5-s intervals for 100–200 ms at 440 nm for CFP detection and for 100 ms at 512 nm for YFP detection. After 10 base-line excitation cycles, an additional 4–4.5-s bleach pulse at 512 nm was added to each cycle. This procedure resulted in photobleaching of >80% of the YFP signal within the observation time frame. A total of 40–60 cycles were used. Image time series were acquired, and data were extracted from regions of interest. A region of interest in the close vicinity of the cell was subtracted as background. FRET efficiencies were calculated as the relative increase in CFP fluorescence after a nearly saturating photobleach of the FRET acceptor, YFP (>80%). In the majority of the experiments, the linear correlation of CFP increase and YFP decrease was evaluated by plotting the increasing CFP emission versus the decreasing YFP emission.
Immunofluorescence and Confocal Microscopy
Cells cultured on 35-mm microwell dishes were fixed in 4% paraformaldehyde (EM Sciences) for 30 min. For immunofluorescence stainings, the cells were permeabilized with 0.1% Triton X-100 for 30 min, blocked in Dulbecco’s modified Eagle’s medium supplemented with 10% fetal bovine serum for 1 h before incubating with primary and Alexa Fluor-conjugated secondary antibodies for 1 h each. The cells were washed with 1× phosphate-buffered saline between all steps and finally covered with Vectashield imaging medium (Vector) before observation. To observe DAPI staining, Vectashield with DAPI (Vector) was used. To visualize both YFP and LysoTracker-Red (Molecular Probes, Eugene, OR), we added 100 nm LysoTracker-Red to the growth medium and incubated the cells at 37 °C for 2 h before processing the cells as above. All confocal images were obtained at room temperature with the UltraView II confocal setup (PerkinElmer Life Sciences) equipped with an Axiovert 200 microscope (Zeiss) using a Plan-APOCHROMAT 100× oil immersion objective (N.A. 1.4) (Zeiss) and a OCRA-ER CCD camera (Hamamatsu). Pinhole setting was adjusted to allow acquisition of sections as thin as 0.5 μm. The UltraView image acquisition software was used to acquire images at 360, 488, and 568 nm and to perform colocalization analyses of merged images. Variability in the correlation coefficients due to differences in the expression levels and intensities of the fluorophores was minimized by: 1) transfecting the same amounts of each DNA to obtain approximately equal expression levels of the various constructs, 2) acquiring the images for the analyses at low exposures to prevent bleaching and saturation of pixels, which would lead to bleed-through to adjoining pixels, and 3) rapidly identifying the cells under the microscope to prevent selective bleaching of a particular fluorophore. Under these conditions, coexpression of two or more molecules did not change their respective fluorescence intensities, compared with when they are expressed alone (see supplemental Fig. S4 and “Results”). Correlation analyses for the pairs of fluorophores were always performed with images in which their pixel-intensities were below saturation to prevent overestimation of the correlation coefficients. Fixation of the samples with paraformaldehyde did not significantly alter the fluorescent intensities of YFP and GFP in these experiments (data not shown) and therefore did not affect our conclusions.
Surface Biotinylation
HEK293 cells cultured on 10 cm plates (75–80% confluence) were transfected with: 1) TRPML1-HA alone, 2) TRPML1-HA and Dyn1aK44A, 3) TRPML1-HA and full length-AP180, and 4) TRPML1Δ3-HA alone. 10 μm tunicamycin (Sigma) was added 30 min post-transfection to inhibit N-glycosylation of TRPML1 or TRPML1Δ3. Surface biotinylation was performed 24 h post-transfection using a cell surface protein biotinylation and purification kit (Pierce) as per the manufacturer’s instructions. The biotinylated and 0.5% input extracts were run on 12% SDS-PAGE gels and transferred to nitrocellulose membranes (Amersham Biosciences), and Western blots were performed. Rabbit polyclonal anti-HA antibody (Sigma) was used as the primary antibody (1:5000 dilution) and horseradish peroxidase-conjugated anti-rabbit donkey IgG (Amersham Biosciences) was used as the secondary antibody (1:10,000 dilution). The membranes were exposed to Kodak XAR film for 1 h each. Following development, the intensities of the bands were determined by densitometry (Scion Image, Scion Corp.). The intensities of the biotinylated bands were normalized to unsaturated bands of the 0.5% input.
Northern Blot Analysis
Total RNA was prepared (TRIzol reagent, Invitrogen) from the T98G glioma cell line. Poly(A)+ RNA was purified using an Oligotex Kit (Qiagen). RNAs (0.5 μg) were fractioned on a formaldehyde-agarose gel and blotted onto a Hybond-N (Amersham Biosciences) membrane. The 2-h prehybridization and overnight hybridization were at 65 °C in 0.5 m phosphate (pH 7.0), 4% SDS and 1% bovine serum albumin. The human TRPML1,−2, and −3 cDNA probes (nucleotides 682–1740, 147–1291, and 97–1303 of the coding sequences, respectively) had specific activities of 3.4, 2.3, and 2.7 × 10⁹ cpm/μg, respectively, and were used at concentrations of 3.4, 2.3, and 2.7 × 10⁶ cpm/ml hybridization solution, respectively. The blots were washed at 55 °C in 0.1 × SSC, 0.1% SDS for 20 min and subsequently hybridized with a human β-actin control probe (0.62 × 10⁹ cpm/μg, 0.4 × 10⁶ cpm/ml) under the same conditions.
RESULTS
FRET Signals Generated between TRPML-YFP/CFP
To determine whether the three TRPML proteins can interact to form homo- and heteromultimers, we utilized a FRET-based approach. We fused either yellow fluorescent protein (YFP) or cyan fluorescent protein (CFP) to the C termini of each of the three TRPMLs and coexpressed these proteins in HEK293 cells in various combinations. The presence of FRET between two tagged proteins is characterized by an increase in the CFP emission intensity upon photobleach of YFP and indicates that the proteins are in extremely close proximity since fluorescence resonance energy transfer occurs only when the fluorophores are separated by very small distances (27).
We found that there were high FRET efficiencies between each of the TRPML proteins in all combinations, suggesting that the TRPMLs form homo- and heteromultimeric interactions (Fig. 1, A, B, and F). We found a linear relationship between the CFP increase and YFP (Fig. 1E) as has been demonstrated for other TRPs (18, 19, 28). In contrast to these results, coexpression of TRPMLs with two other proteins with multiple transmembrane domains did not result in FRET. These include the Drosophila TRPP protein AMO (Almost there) (24, 29) (Fig. 1, C and F), which is also a group 2 TRP, and the lysosomal associated tetraspanin, referred to as Sun (Sunglasses) (25) (Fig. 1, D and F). The lack of FRET between the TRPML and either AMO or Sun was not due a failure to express these latter proteins, as there were significant FRET efficiencies between Sun-YFP/Sun-CFP and AMO-YFP/AMO-CFP (Fig. 1F). Since TRPML1 and Sun are both lysosomal membrane proteins, the high FRET efficiencies between the various TRPMLs did not appear to be a simple consequence of coexpression in the same organelle.
FIGURE 1. TRPMLs interact with each other to form multimers.
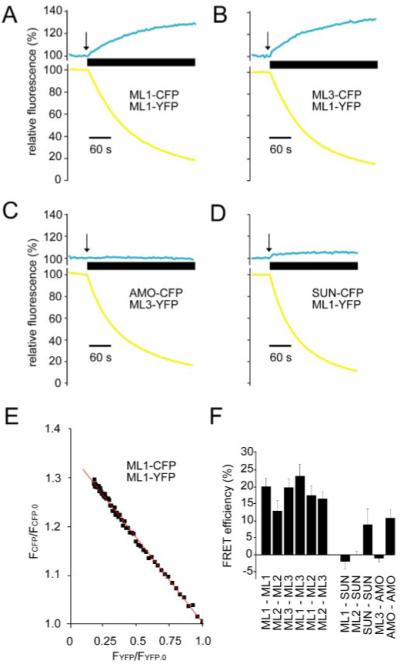
A, representative traces showing FRET between TRPML1-YFP and TRPML1-CFP. Changes in the relative fluorescence (percent) of CFP and YFP emissions are plotted against time (seconds). The thick horizontal bar denotes the duration of application of acceptor-photobleach, the initiation of the photobleach is indicated by the arrow. A 60-s scale bar is shown. B, FRET between TRPML1-YFP and TRPML3-CFP. C, representative traces demonstrating absence of FRET between TRPML3-YFP and AMO-CFP. D, absence of FRET between TRPML1-YFP and Sun-CFP. E, representative linear regression analysis of fractional donor (TRPML1-CFP) recovery (FCFP/FCFP.0) versus fractional acceptor (TRPML1-YFP) photobleach (FYFP/FYFP.0). F, bar graph showing the FRET efficiencies (percentage) between the various pairs of proteins as indicated along the x axis. Averages are results of three to five separate experiments in each case, and error bars indicate S.E.
If the native TRPMLs form heteromultimers, then they must be coexpressed, in at least some cell types. Consistent with this possibility, we found that the RNAs encoding all three TRPMLs were coexpressed in an available glioma cell line (supplemental Fig. S1).
TRPML1 and TRPML2 Are Lysosomal Membrane Proteins, whereas TRPML3 Is Retained in the ER
The high FRET efficiencies between the three TRPML proteins suggest that they display the same or highly overlapping spatial distributions. TRPML1 has been reported to be a lysosomal protein (10, 11); however, the localizations of TRPML2 and TRPML3 have not been described. To determine the subcellular distribution of each of the TRPML proteins, we compared the spatial distributions of the tagged TRPMLs with markers that stain various organelles. Both TRPML1-YFP and TRPML2-YFP decorated the periphery of vesicles labeled by the lysosomal marker, LysoTracker-Red (Fig. 2, A–C and D–F). LysoTracker accumulates in the lumen of acidic vesicles such as lysosomes and multivesicular bodies (MVBs) (30). Both TRPML1 and TRPML2 are detected in the cortical region of these vesicles, rather than in the lumen where LysoTracker and proteins that comprise the lysosomal-proteolytic machinery are found (31) (Fig. 2, G–I). The variability in the size of vesicles labeled by LysoTracker (Fig. 2, B, E, and H) is normal for HEK293 cells and does not appear to be a consequence of TRPML expression as the size of LysoTracker stained vesicles shows similar variability in untransfected HEK293 cells (supplemental Fig. S2, A–D).
FIGURE 2. Subcellular localizations of TRPML1 and TRPML2.
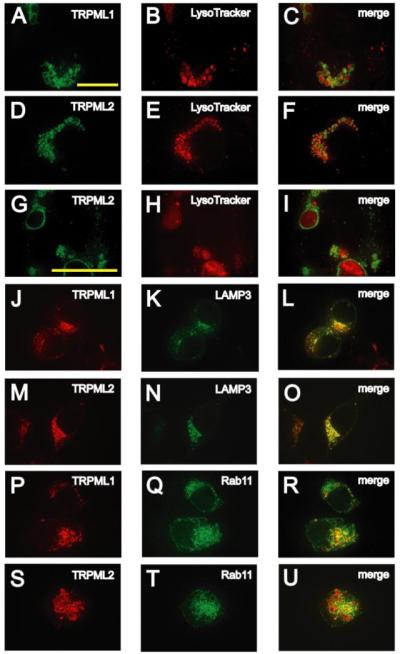
A and B, confocal images of fixed HEK293 cells that were transfected with TRPML1-YFP, loaded with LysoTracker-Red (100 nm) and viewed at the indicated excitation wavelengths. A, 488 nm, TRPML1-YFP, green; B, 568 nm, Lyso-Tracker-Red, red. C, merge of A and B. D–F, same as A–C but in HEK293 cells transfected with TRPML2-YFP. G–I, same as D–F but at 1.6× higher magnification. J and K, confocal images of HEK293 cells co-transfected with TRPML1-HA and LAMP3-YFP in which immunofluorescence was performed with anti-HA primary antibodies and Alexa568-conjugated secondary antibodies and viewed at the indicated excitation wavelengths: 568 nm, TRPML1-HA, red (J) and 488 nm, LAMP3-YFP, green (K). L, merge of J and K. M–O, same as J–L but in HEK293 cells cotransfected with TRPML2-HA and LAMP3-YFP. P–R, same as J–L but in HEK293 cells cotransfected with TRPML1-HA and GFP-Rab11. S–U, same as J–L but in HEK293 cells co-transfected with TRPML2-HA and GFP-Rab11. The scale bar shown in A is applicable to all the panels except G–I, which utilize the scale bar shown in G. All scale bars represent 20 μm.
Neither TRPML1 nor TRPML2 co-localized significantly with markers labeling other intracellular organelles such as the ER (supplemental Fig. S3, A–F), Golgi (GFP-Golgin160 (32)) (supplemental Fig. S3, G and H), early endosomes (Rab5 (33)) (supplemental Fig. S3, J and K); late endosomes (Rab7-HA (33)) (supplemental Fig. S3, M and N) and secretory vesicles (Rab8 (33)) (supplemental Fig. S3, P and Q).
Additional evidence that TRPML1 and TRPML2 were lysosomal membrane proteins was that HA tagged versions of these proteins co-localized with other integral and peripheral membrane proteins associated with lysosomal membranes. These include the tetraspanin LAMP-3 (34), which consists of four transmembrane domains (LAMP3-YFP; Fig. 2, J–L and M–O) and the Rab-GTPase Rab11 (Fig. 2, P–R and S–U), which is associated with the membranes of lysosomes and MVBs in addition to recycling vesicles (35). Thus, we conclude that both TRPML1 and TRPML2 are lysosomal associated membrane proteins.
In contrast to TRPML1 and TRPML2, we found that TRPML3-HA showed the greatest overlap with an ER membrane marker (ER-YFP; Fig. 3, A–C). TRPML3 showed negligible overlap with markers labeling lysosomes (LysoTracker-Red, Fig. 3, D–F; LAMP3-YFP and GFP-Rab11, Fig. 3, G-I and J–L), Golgi (GFP-Golgin160; supplemental Fig. S3I), early endosomes (Rab5; supplemental Fig. S3L), late endosomes (Rab7-HA; supplemental Fig. S3O), and secretory vesicles (Rab8; supplemental Fig. S3R). These results were surprising given the strong FRET signal between TRPML3 and the other TRPML proteins.
FIGURE 3. Subcellular localization of TRPML3.
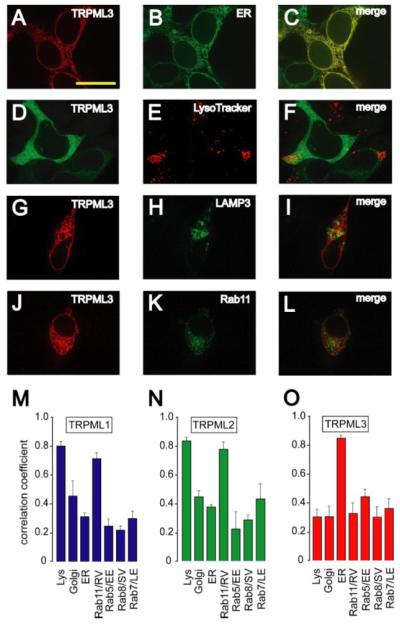
A and B, confocal images of HEK293 cells cotransfected with TRPML3-HA and ER-YFP. The immunofluorescence was performed with anti-HA primary antibodies and Alexa568-conjugated secondary antibodies and viewed at the indicated excitation wavelengths: 568 nm, TRPML3-HA, red (A); 488 nm, ER-YFP, green (B). C, merge of A and B. D–F, confocal images of fixed HEK293 cells that were transfected with TRPML3-YFP, loaded with Lyso-Tracker-Red (100 nm) and viewed at the indicated excitation wavelengths: 488 nm, TRPML3-YFP, green (D); 568 nm, LysoTracker-Red, red (E). F, merge of D and E. G–I, same as A–C but in HEK293 cells co-transfected with TRPML3-HA and LAMP3-YFP. J–L, same as A–C but in HEK293 cells co-transfected with TRPML3-HA and GFP-Rab11. Scale bar represents 20 μm. M–O, bar graphs quantifying colocalization of TRPMLs with various markers for subcellular organelles indicated along the x axis: TRPML1 (M), TRPML2 (N), and TRPML3 (O). Averages are based on three to five separate experiments in each case, and error bars indicate S.E. Unpaired student t tests indicated that the enrichment of TRPML1 and TRPML2 in lysosomes and TRPML3 in the ER relative to other organelles was statistically significant (p < 0.001).
The extent of colocalization of the TRPMLs with the different organellar markers was quantified by calculating the correlation coefficients of the TRPMLs with each marker. TRPML1 and TRPML2 showed the highest correlation coefficients with the lysosomal/MVB markers LAMP3 and Rab11 (Fig. 3, M and N), whereas TRPML3 displayed a comparably high colocalization only with the ER marker (Fig. 3O). The colocalizations of the TRPMLs with these markers did not appear to be influenced by alterations in expression levels due to coexpression with the marker proteins, since the relative expression of TRPML3 was similar if expressed alone or in combination with other proteins (supplemental Fig. S4, A–F).
Coexpression with TRPML1 or TRPML2 Causes TRPML3 to Be Localized in the Lysosomes
An apparent paradox is that TRPML3 can interact with either TRPML1 or TRPML2, yet it shows a subcellular localization distinct from TRPML1 and TRPML2. To address this conundrum, we considered whether the spatial distribution of TRPML3 was altered upon coexpression with either TRPML1 or TRPML2. We found that upon coexpression, TRPML3 showed significant overlap with either TRPML1 or TRPML2 (Fig. 4, A–C and D–F). Furthermore, such coexpression resulted in a large increase in the lysosomal/MVB localization of TRPML3 and a concomitant decrease in ER retention (Fig. 4, G–M). These data suggest that TRPML3 is cotrafficked with either TRPML1 or TRPML2 to the lysosomes/MVBs as a result of heteromultimerization. Moreover, the spatial distributions of TRPML1 or TRPML2 were unchanged when coexpressed with TRPML3 (data not shown). Thus, either TRPML1 or TRPML2 affected the localization of TRPML3 but not vice versa. The localization of TRPML3 in lysosomes, when coexpressed with other TRPMLs, did not appear to be influenced by changes its expression level as the relative intensities of the TRPML3 immunofluorescence were similar in the presence or absence of TRPML1 (supplemental Fig. S4, A and D–F).
FIGURE 4. Translocation of TRPML3 to lysosomes as a result of coexpression with either TRPML1 or TRPML2.
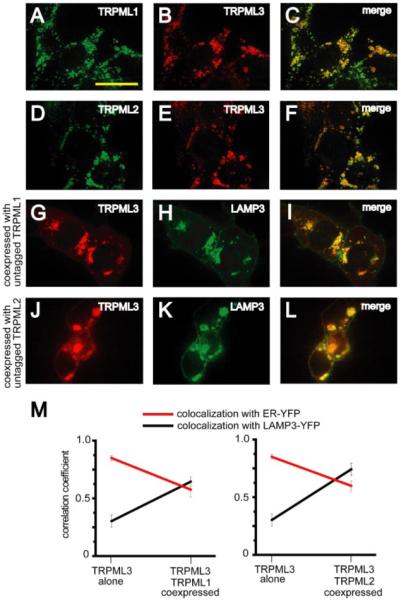
A and B, confocal images of HEK293 cells cotransfected with TRPML1-HA and TRPML3-MYC. Immunofluorescence was performed with anti-HA primary/Alexa488-conjugated secondary and anti-MYC primary/Alexa568-conjugated secondary antibodies at the indicated excitation wavelengths: 488 nm, TRPML1-HA, green (A); 568 nm, TRPML3-MYC, red (B). C, merge of A and B. D–F, same as A–C but in HEK293 cells co-transfected with TRPML2-HA and TRPML3-MYC. G–I, confocal images of HEK293 cells cotransfected with TRPML3-HA, untagged TRPML1, and LAMP3-YFP. Immunofluorescence was performed with anti-HA primary antibodies and Alexa568-conjugated secondary antibodies at the indicated excitation wavelengths: 568 nm, TRPML3-HA, red (G); 488 nm, LAMP3-YFP, green (H). I, merge of G and H. J–L, same as G–I but in HEK293 cells cotransfected with TRPML3-HA, untagged TRPML2, and LAMP3-YFP. Scale bar represents 20 μm. M, quantification of decrease in ER localization (red) and an increase in lysosomal localization (black) of TRPML3 when coexpressed with either TRPML1 (left) or TRPML2 (right). Averages are based on three to five separate experiments in each case, and error bars indicate S.E.
To test whether the preceding results were cell line-dependent, we repeated the experiments in a fibroblast cell line, NIH3T3 cells. In accordance with the results in HEK293 cells, we found that both TRPML1 and TRPML2 were lysosomal membrane proteins (co-localized with LAMP3-YFP; Fig. 5, A–D and E–H), whereas TRPML3 localized primarily to the ER when expressed in the absence of either TRPML1 or TRPML2 (co-localized with ER-YFP; Fig. 5, I–L). Upon coexpression with either TRPML1 or TRPML2, we found that TRPML3 was present in the lysosomes, as demonstrated by colocalization with LAMP3-YFP (Fig. 5, M–P and Q–T).
FIGURE 5. Subcellular localizations of TRPMLs in NIH3T3 cells.
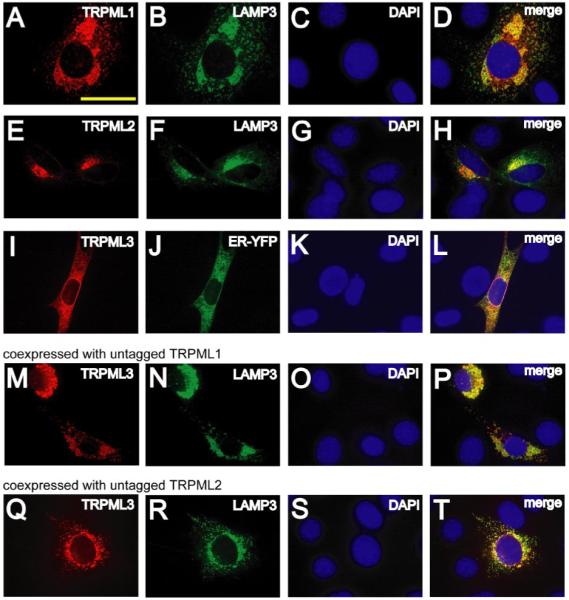
A–C, confocal images of DAPI-loaded NIH3T3 cells co-transfected with TRPML1-HA and LAMP3-YFP in which immunofluorescence was performed with anti-HA primary antibodies and Alexa568-conjugated secondary antibodies and viewed at the indicated excitation wavelengths: 568 nm, TRPML1-HA, red (A); 488 nm, LAMP3-YFP, green (B); 360 nm, DAPI, blue (C). D, merge of A–C. E–H, same as A–D but in DAPI-loaded NIH3T3 cells co-transfected with TRPML2-HA and LAMP3-YFP. I–L, same as A–D but in DAPI-loaded NIH3T3 cells co-transfected with TRPML3-HA and ER-YFP. M–O, confocal images of DAPI loaded NIH3T3 cells previously co-transfected with TRPML3-HA, untagged TRPML1, and LAMP3-YFP. Immunofluorescence was performed with anti-HA primary antibodies and Alexa568-conjugated secondary antibodies at the indicated excitation wavelengths: 568 nm, TRPML3-HA, red (M); 488 nm, LAMP3-YFP, green (N); 360 nm, DAPI, blue (O). P, merge of M–O. Q–T, same as M–P but in DAPI-loaded NIH3T3 cells co-transfected with TRPML3-HA, untagged TRPML2, and LAMP3-YFP. Scale bar represents 20 μm.
Mislocalization of TRPML3 Induced by Mutations That Alter Lysosomal Localization of TRPML1/TRPML2
To provide additional evidence that TRPML3 cotrafficked with TRPML1 and TRPML2 we set out to determine whether mutations that disrupt the lysosomal localization of TRPML1 and TRPML2 might in turn cause a similar mislocalization of wild-type TRPML3. Therefore, we scanned the TRPML1 and TRPML2 sequences for motifs similar to known lysosomal targeting signals (36). Both TRPML1 and TRPML2 contained one type of motif (di-leucine motif: [D/E]XXXL[L/I]), situated near the N and C termini of TRPML1 (supplemental Fig. S5A; ETERLL and EEHSLL, respectively) and near the C terminus of TRPML2 (supplemental Fig. S5E; DRLILI). Removal of the C-terminal di-leucine sequence of TRPML1 (supplemental Fig. S5B, TRPML1Δ1) did not alter lysosomal localization (Fig. 6, A–C). However, deletion of either the N-terminal or both the N- and C-terminal di-leucine sequences (supplemental Fig. S5, C and D; TRPML1Δ2 and TRPML1Δ3, respectively) disrupted lysosomal localization and enhanced cortical distribution as indicated by colocalization with the plasma membrane cation channel TRPC6 (26) (Fig. 6, D–F and G–I). Deletion of the C-terminal di-leucine motif of TRPML2 (supplemental Fig. S5F; TRPML2Δ1) also disrupted its lysosomal localization and resulted in a cortical distribution similar to that of TRPC6 (Fig. 6, J–L).
FIGURE 6. Signals responsible for lysosomal localization of TRPML1 and TRPML2.
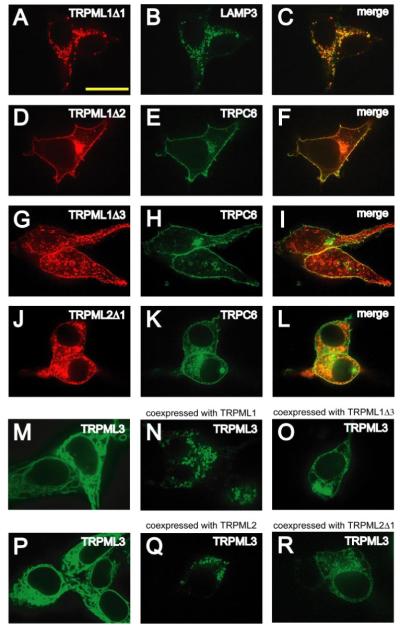
A and B, confocal images of HEK293 cells previously co-transfected with TRPML1Δ1-HA and LAMP3-YFP in which immunofluorescence was performed with anti-HA primary antibodies and Alexa568-conjugated secondary antibodies and the cells were viewed at the indicated excitation wavelengths: 568 nm, TRPML1Δ1-HA, red (A); 488 nm, LAMP3-YFP, green (B). C, merge of A and B. D–L, same as A–C but in HEK293 cells co-transfected with either TRPML1Δ2-HA and TRPC6-YFP, TRPML1Δ3-HA and TRPC6-YFP, or TRPML2Δ1-HA and TRPC6-YFP, respectively. M–O, confocal images of HEK293 cells transfected with vectors encoding the following and viewed at an excitation wavelength of 488 nm: TRPML3-YFP alone (M), TRPML3-YFP and TRPML1 (N), TRPML3-YFP and TRPML1Δ2 (O). P–R, same as M–O except in HEK293 cells transfected with: TRPML3-YFP alone (P), TRPML3-YFP and TRPML2 (Q), or TRPML3-YFP and TRPML2Δ1 (R). The scale bar represents 20 μm.
If the subcellular distribution of TRPML3 is controlled by TRPML1 or TRPML2, then TRPML3 should display an increased cortical distribution when coexpressed with either TRPML1Δ2 or TRPML2Δ1. Consistent with this proposal, we found that the cortical appearance of TRPML3-YFP increased when it was coexpressed with TRPML1Δ2or TRPML2Δ1 (Fig. 6, O and R, respectively).
Mislocalization of TRPML3 by Interfering with Clathrin-mediated Endocytosis
The preceding data indicate that the distribution of wild-type TRPML3 mirrors that of either TRPML1 or TRPML2. To lend further support to this conclusion, we attempted to alter the localizations of wild-type TRPML1 or TRPML2 by disrupting the relevant proteins involved in clathrin mediated endocytosis and lysosomal targeting, rather than by mutating the TRPML sequences.
To interfere with clathrin-mediated endocytosis, we used a dominant negative form of Dynamin 1a (Dyn1a), a mechano-enzyme that utilizes the energy of GTP-hydrolysis to cause scission of membranes during clathrin-mediated endocytosis at the plasma membrane or trans-Golgi network (37, 38). The dominant negative mutant of Dyn1a (Dyn1aK44A) is incapable of binding GTP and inhibits clathrin-mediated endocytosis (37, 39). Expression of TRPML1-YFP with wild-type Dyn1a did not alter its normal lysosomal localization (Fig. 7, A and B). However, expression of TRPML1-YFP with Dyn1aK44A decreased lysosomal localization and resulted in significant cortical distribution reminiscent of the pattern of TRPML1Δ2 and TRPML1Δ3 (Fig. 7C). Similar results were obtained with TRPML2 (Fig. 7, E–G). AP180 is another protein that modulates clathrin-mediated endocytosis (40). Full-length AP180 binds clathrin and causes it to be distributed into a lattice-like pattern thereby preventing clathrin-coated pit formation and clathrin-mediated endocytosis (40). When expressed with either TRPML1-YFP or TRPML2-YFP, full-length AP180 decreased lysosomal targeting and induced significant cortical localization (Fig. 7, D and H). In contrast to the effects on TRPML1 and TRPML2, wild-type Dyn1a, Dyn1aK44A, and full length-AP180 had no effect on the localization of TRPML3 when expressed in the absence of other TRPMLs (Fig. 7, I–L). However, Dyn1aK44A caused cortical localization of TRPML3 when it was coexpressed with either TRPML1 or TRPML2 (Fig. 7, O and S). Similar results were obtained when TRPML3 was coexpressed with TRPML1 or TRPML2 and full length-AP180 (Fig. 7, P and T, respectively). Thus when expressed together, the spatial distribution of TRPML3 always parallels that of either TRPML1 or TRPML2.
FIGURE 7. Coexpression with mislocalized TRPML1 or TRPML2 causes mislocalization of TRPML3.

A, confocal image of fixed HEK293 cells that were previously transfected with TRPML1-YFP at the excitation wavelength of 488 nm. B and C, same as A but in HEK293 cells co-transfected with: TRPML1-YFP and Dyn1aWT (B) or Dyn1aK44A (C). D, confocal image of HEK293 cells co-transfected with TRPML1-HA and full-length AP180 and in which immunofluorescence was performed with anti-HA primary antibodies and Alexa568-conjugated secondary antibodies and viewed at an excitation wavelength of 568 nm. E–H, same as A–D but with TRPML2-YFP instead of TRPML1-YFP. I–L, same as A–D but with TRPML3-YFP instead of TRPMl1-YFP. M–P, confocal images of HEK293 cells co-transfected with vectors encoding the following and viewed at an excitation wavelength of 488 nm: TRPML3-YFP and TRPML1 (M); TRPML3-YFP, TRPML1 and wild-type Dyn1a (N); TRPML3-YFP, TRPML1, and Dyn1aK44A (O); and TRPML3-YFP, TRPML1, and full-length AP180 (P). Q–T, same as M–P but with TRPML2 instead of TRPML1. The scale bar represents 20 μm. U, increased biotinylation of TRPML1 due to inhibition of clathrin-mediated endocytosis and deletion of lysosomal targeting motif. The Western blot shows extracts prepared from HEK293 cells expressing TRPML1-HA alone (left lane), TRPML1-HA with Dyn1aK44A or AP180 (middle lanes), and TRPML1Δ3-HA alone (right lane). The extracts were prepared following surface biotinylation and the biotinylated proteins were purified. The blot was probed with anti-HA primary antibodies and horseradish peroxidase-conjugated secondary antibodies. Upper panels show surface-biotinylated fractions. The arrow indicates the 65-kDa TRPML1 band. The lower panels show the 0.5% input, with the arrow indicating the TRPML1 band. V, bar graphs showing the fold-increase in the TRPML1-HA surface biotinylation upon inhibition of clathrin-mediated endocytosis or as a result of mutating the lysosomal targeting motif. Averages are based on three separate experiments in each case and the error bars indicate S.E. Unpaired Student’s t tests indicate that the fold increase in surface biotinylation of TRPML1-HA was statistically significant (p < 0.05) upon coexpression with Dyn1aK44A or full-length AP180 or upon removal of the lysosomal targeting motif.
Mislocalized TRPML1 Is Inserted into the Plasma Membrane
We performed surface biotinylation to determine if the mislocalized TRPML1 is inserted into the plasma membrane or whether it remains in vesicles subjacent to the plasma membrane. The baseline surface labeling of predominantly lysosomal TRPML1 has been reported previously (10). Here we show that upon inhibition of clathrin-mediated endocytosis with full-length AP180 or Dyn1aK44A the surface labeling of TRPML1 increases 2.5–3-fold (2.5 ± 0.4-fold and 3.0 ± 0.6-fold, respectively; Fig. 7, U and V). The increase in surface labeling of TRPML1Δ3 due to absence of the lysosomal targeting motif is even more striking (4.1 ± 0.5-fold, Fig. 7, U and V). These results indicate that TRPML1 inserted into the plasma membrane upon inhibition of clathrin-mediated endocytosis or as a result of mutation of its lysosomal targeting motif.
DISCUSSION
Our data provide four independent lines of evidence supporting the conclusions that the TRPML proteins form heteromultimers and such interactions dictate the subcellular localization of TRPML3. First, using a FRET-based approach we found that the TRPML proteins associate in all combinations. Second, the localization of TRPML3 was altered in the presence of TRPML1 or TRPML2. When expressed alone, TRPML3 was primarily found in the ER. However, in the presence of the lysosomal-associated TRPML1 or TRPML2 proteins, we detected TRPML3 in the lysosomes. These latter observations were consistent with the presence of lysosomal targeting di-leucine motifs in TRPML1 and TRPML2 but not TRPML3. Third, mutations in the di-leucine motifs, which induce cortical localization of TRPML1 or TRPML2, cause a similar change in the spatial distribution of coexpressed wild-type TRPML3. Fourth, TRPML3 displayed an increased cortical pattern when coexpressed with either wild-type TRPML1 or TRPML2 along with proteins that interfere with clathrin-mediated endocytosis. Such a dependence of one protein on another lysosomal protein for its appropriate localization is reminiscent of the requirement of the α chain of hexosaminidase on the β chain to reach the lysosomes. Absence of the β chain and the consequent mislocalization of the α chain underlies Sandhoff’s disease (41, 42).
While the localization of TRPML3 was altered in the presence of either of the other TRPMLs, TRPML3 did not impact on the localization TRPML1 or TRPML2. Thus, there was a hierarchy of control concerning the spatial distributions, such that TRPML1 and TRPML2 were dominant over TRPML3. This hierarchy could be established simply because TRPML1 and TRPML2 have signals directing them to the lysosomes, which are absent in TRPML3. Consistent with this proposal, we found that the mutated forms of TRPML1 or TRPML2 (TRPML1Δ2, TRPML1Δ3, and TRPML2Δ1), which accumulate in the cortical region when expressed alone, are trafficked to the lysosomes upon coexpression with wild-type TRPML1 or TRPML2 (data not show). However, it is possible that heteromultimerization with either TRPML1 or TRPML2 also causes masking of putative ER-retention signals in TRPML3. Consistent with the proposal that TRPMLs may form heteromultimers in vivo, we found that all three TRPML RNAs were expressed in a human cell line, as assessed by Northern blot analysis. However, due to the paucity of effective antibodies, it remains to be shown in native cells whether the TRPML proteins are coexpressed and whether the localization of TRPML3 depends on TRPML1 and TRPML2.
The current results raise the intriguing possibility that heteromultimerization induced trafficking of TRPML3 to the lysosomes is required for normal lysosomal function and that at least some of the symptoms of MLIV may be attributable to defects in lysosomal localization of TRPML3. Whether the localization of TRPML3 is disrupted in patients with mutations that eliminate or greatly reduce the concentration of TRPML1 (1, 43, 44) awaits the generation of antibodies that recognize the endogenous TRPML3 protein.
Supplementary Material
Acknowledgments
We thank Drs. H. Xu, M. Köttgen, and R. Elsaesser for helpful suggestions and Dr. A. Scharenberg and S. Matthews for providing the TRPML2 construct.
Footnotes
This work was supported by NEI/National Institutes of Health Grant EY10852 (to C. M.) and by the Mucolipidosis Foundation. The costs of publication of this article were defrayed in part by the payment of page charges. This article must therefore be hereby marked “advertisement” in accordance with 18 U.S.C. Section 1734 solely to indicate this fact.
The on-line version of this article (available at http://www.jbc.org) contains supplemental Figs. S1-S5.
- MLIV
- mucolipidosis type IV
- AP180
- Adaptor protein 180
- AMO
- Almost there
- CFP
- cyan fluorescent protein
- Dyn1a
- Dynamin 1a
- ER
- endoplasmic reticulum
- FRET
- fluorescence resonance energy transfer
- MVB
- multivesicular bodies
- Sun
- Sunglasses
- TRP
- transient receptor potential channels
- YFP
- yellow fluorescent protein
- HA
- hemagglutinin
- DAPI
- 4′,6-diamidino-2-phenylindole
REFERENCES
- 1.Bach G. Mol. Genet. Metab. 2001;73:197–203. doi: 10.1006/mgme.2001.3195. [DOI] [PubMed] [Google Scholar]
- 2.Bach G. Pfluegers. Arch. 2005;451:313–317. doi: 10.1007/s00424-004-1361-7. [DOI] [PubMed] [Google Scholar]
- 3.Altarescu G, Sun M, Moore DF, Smith JA, Wiggs EA, Solomon BI, Patronas NJ, Frei KP, Gupta S, Kaneski CR, Quarrell OW, Slaugenhaupt SA, Goldin E, Schiffmann R. Neurology. 2002;59:306–313. doi: 10.1212/wnl.59.3.306. [DOI] [PubMed] [Google Scholar]
- 4.Chen CS, Bach G, Pagano RE. Proc. Natl. Acad. Sci. U. S. A. 1998;95:6373–6378. doi: 10.1073/pnas.95.11.6373. [DOI] [PMC free article] [PubMed] [Google Scholar]
- 5.Soyombo AA, Tjon-Kon-Sang S, Rbaibi Y, Bashllari E, Bisceglia J, Muallem S, Kiselyov K. J. Biol. Chem. 2006;281:7294–7301. doi: 10.1074/jbc.M508211200. [DOI] [PubMed] [Google Scholar]
- 6.Montell C. Sci. STKE. 2005:re3. doi: 10.1126/stke.2722005re3. 2005. [DOI] [PubMed] [Google Scholar]
- 7.Bargal R, Avidan N, Ben-Asher E, Olender Z, Zeigler M, Frumkin A, Raas-Rothschild A, Glusman G, Lancet D, Bach G. Nat. Genet. 2000;26:118–123. doi: 10.1038/79095. [DOI] [PubMed] [Google Scholar]
- 8.Bassi MT, Manzoni M, Monti E, Pizzo MT, Ballabio A, Borsani G. Am. J. Hum. Genet. 2000;67:1110–1120. doi: 10.1016/s0002-9297(07)62941-3. [DOI] [PMC free article] [PubMed] [Google Scholar]
- 9.Sun M, Goldin E, Stahl S, Falardeau JL, Kennedy JC, Acierno JS, Jr., Bove C, Kaneski CR, Nagle J, Bromley MC, Colman M, Schiffmann R, Slaugenhaupt SA. Hum. Mol. Genet. 2000;9:2471–2478. doi: 10.1093/hmg/9.17.2471. [DOI] [PubMed] [Google Scholar]
- 10.Kiselyov K, Chen J, Rbaibi Y, Oberdick D, Tjon-Kon-Sang S, Shcheynikov N, Muallem S, Soyombo A. J. Biol. Chem. 2005;280:43218–43223. doi: 10.1074/jbc.M508210200. [DOI] [PubMed] [Google Scholar]
- 11.Manzoni M, Monti E, Bresciani R, Bozzato A, Barlati S, Bassi MT, Borsani G. FEBS Lett. 2004;567:219–224. doi: 10.1016/j.febslet.2004.04.080. [DOI] [PubMed] [Google Scholar]
- 12.Fares H, Greenwald I. Nat. Genet. 2001;28:64–68. doi: 10.1038/ng0501-64. [DOI] [PubMed] [Google Scholar]
- 13.Hersh BM, Hartwieg E, Horvitz HR. Proc. Natl. Acad. Sci. U. S. A. 2002;99:4355–4360. doi: 10.1073/pnas.062065399. [DOI] [PMC free article] [PubMed] [Google Scholar]
- 14.Treusch S, Knuth S, Slaugenhaupt SA, Goldin E, Grant BD, Fares H. Proc. Natl. Acad. Sci. U. S. A. 2004;101:4483–4488. doi: 10.1073/pnas.0400709101. [DOI] [PMC free article] [PubMed] [Google Scholar]
- 15.Schaheen L, Dang H, Fares H. Dev. Biol. 2006 doi: 10.1016/j.ydbio.2006.02.008. [DOI] [PubMed] [Google Scholar]
- 16.Di Palma F, Belyantseva IA, Kim HJ, Vogt TF, Kachar B, Noben-Trauth K. Proc. Natl. Acad. Sci. U. S. A. 2002;99:14994–14999. doi: 10.1073/pnas.222425399. [DOI] [PMC free article] [PubMed] [Google Scholar]
- 17.Hellwig N, Albrecht N, Harteneck C, Schultz G, Schaefer M. J. Cell Sci. 2005;118:917–928. doi: 10.1242/jcs.01675. [DOI] [PubMed] [Google Scholar]
- 18.Hofmann T, Schaefer M, Schultz G, Gudermann T. Proc. Natl. Acad. Sci. U. S. A. 2002;99:7461–7466. doi: 10.1073/pnas.102596199. [DOI] [PMC free article] [PubMed] [Google Scholar]
- 19.Chubanov V, Waldegger S, Mederos y Schnitzler M, Vitzthum H, Sassen MC, Seyberth HW, Konrad M, Gudermann T. Proc. Natl. Acad. Sci. U. S. A. 2004;101:2894–2899. doi: 10.1073/pnas.0305252101. [DOI] [PMC free article] [PubMed] [Google Scholar]
- 20.Xu XZ, Li HS, Guggino WB, Montell C. Cell. 1997;89:1155–1164. doi: 10.1016/s0092-8674(00)80302-5. [DOI] [PubMed] [Google Scholar]
- 21.Xu XZ, Chien F, Butler A, Salkoff L, Montell C. Neuron. 2000;26:647–657. doi: 10.1016/s0896-6273(00)81201-5. [DOI] [PubMed] [Google Scholar]
- 22.Strubing C, Krapivinsky G, Krapivinsky L, Clapham DE. J. Biol. Chem. 2003;278:39014–39019. doi: 10.1074/jbc.M306705200. [DOI] [PubMed] [Google Scholar]
- 23.Strubing C, Krapivinsky G, Krapivinsky L, Clapham DE. Neuron. 2001;29:645–655. doi: 10.1016/s0896-6273(01)00240-9. [DOI] [PubMed] [Google Scholar]
- 24.Watnick TJ, Jin Y, Matunis E, Kernan MJ, Montell C. Curr. Biol. 2003;13:2179–2184. doi: 10.1016/j.cub.2003.12.002. [DOI] [PubMed] [Google Scholar]
- 25.Xu H, Lee SJ, Suzuki E, Dugan KD, Stoddard A, Li HS, Chodosh LA, Montell C. EMBO J. 2004;23:811–822. doi: 10.1038/sj.emboj.7600112. [DOI] [PMC free article] [PubMed] [Google Scholar]
- 26.Hofmann T, Obukhov AG, Schaefer M, Harteneck C, Gudermann T, Schultz G. Nature. 1999;397:259–263. doi: 10.1038/16711. [DOI] [PubMed] [Google Scholar]
- 27.dos Remedios CG, Moens PD. J. Struct. Biol. 1995;115:175–185. doi: 10.1006/jsbi.1995.1042. [DOI] [PubMed] [Google Scholar]
- 28.Amiri H, Schultz G, Schaefer M. Cell Calcium. 2003;33:463–470. doi: 10.1016/s0143-4160(03)00061-7. [DOI] [PubMed] [Google Scholar]
- 29.Gao Z, Ruden DM, Lu X. Curr. Biol. 2003;13:2175–2178. doi: 10.1016/j.cub.2003.11.053. [DOI] [PubMed] [Google Scholar]
- 30.Anderson RG, Orci L. J. Cell Biol. 1988;106:539–543. doi: 10.1083/jcb.106.3.539. [DOI] [PMC free article] [PubMed] [Google Scholar]
- 31.Bohley P, Seglen PO. Experientia (Basel) 1992;48:151–157. doi: 10.1007/BF01923508. [DOI] [PubMed] [Google Scholar]
- 32.Fritzler MJ, Hamel JC, Ochs RL, Chan EK. J. Exp. Med. 1993;178:49–62. doi: 10.1084/jem.178.1.49. [DOI] [PMC free article] [PubMed] [Google Scholar]
- 33.Zerial M, McBride H. Nat. Rev. Mol. Cell. Biol. 2001;2:107–117. doi: 10.1038/35052055. [DOI] [PubMed] [Google Scholar]
- 34.Rous BA, Reaves BJ, Ihrke G, Briggs JA, Gray SR, Stephens DJ, Banting G, Luzio JP. Mol. Biol. Cell. 2002;13:1071–1082. doi: 10.1091/mbc.01-08-0409. [DOI] [PMC free article] [PubMed] [Google Scholar]
- 35.Savina A, Fader CM, Damiani MT, Colombo MI. Traffic. 2005;6:131–143. doi: 10.1111/j.1600-0854.2004.00257.x. [DOI] [PubMed] [Google Scholar]
- 36.Bonifacino JS, Traub LM. Annu. Rev. Biochem. 2003;72:395–447. doi: 10.1146/annurev.biochem.72.121801.161800. [DOI] [PubMed] [Google Scholar]
- 37.Herskovits JS, Burgess CC, Obar RA, Vallee RB. J. Cell Biol. 1993;122:565–578. doi: 10.1083/jcb.122.3.565. [DOI] [PMC free article] [PubMed] [Google Scholar]
- 38.Praefcke GJ, McMahon HT. Nat. Rev. Mol. Cell Biol. 2004;5:133–147. doi: 10.1038/nrm1313. [DOI] [PubMed] [Google Scholar]
- 39.Nesti E, Everill B, Morielli AD. Mol. Biol. Cell. 2004;15:4073–4088. doi: 10.1091/mbc.E03-11-0788. [DOI] [PMC free article] [PubMed] [Google Scholar]
- 40.Ford MG, Pearse BM, Higgins MK, Vallis Y, Owen DJ, Gibson A, Hopkins CR, Evans PR, McMahon HT. Science. 2001;291:1051–1055. doi: 10.1126/science.291.5506.1051. [DOI] [PubMed] [Google Scholar]
- 41.Proia RL, d’Azzo A, Neufeld EF. J. Biol. Chem. 1984;259:3350–3354. [PubMed] [Google Scholar]
- 42.Neufeld EF. J. Biol. Chem. 1989;264:10927–10930. [PubMed] [Google Scholar]
- 43.Bargal R, Avidan N, Olender T, Ben Asher E, Zeigler M, Raas-Rothschild A, Frumkin A, Ben-Yoseph O, Friedlender Y, Lancet D, Bach G. Hum. Mutat. 2001;17:397–402. doi: 10.1002/humu.1115. [DOI] [PubMed] [Google Scholar]
- 44.Bargal R, Goebel HH, Latta E, Bach G. Neuropediatrics. 2002;33:199–202. doi: 10.1055/s-2002-34496. [DOI] [PubMed] [Google Scholar]
Associated Data
This section collects any data citations, data availability statements, or supplementary materials included in this article.