

Abstract
This study investigates the relationship between genetic copy number variations and brain volume differences in an alcohol use disorder (AUD) population. We hypothesized that copy number variations may influence subject’s risk for alcohol use disorders through variations in regional gray and white matter brain volumes. Since genetic influences upon behavior are the result of many complicated interactions we focus on differences in brain volume as a putative intermediate phenotype between genetic variation and behavior. Copy number variation, alcohol use assessments and brain structural magnetic resonance images from 283 subjects, 199 male and 84 females who were enrolled in two AUD studies were obtained and analyzed using a combination of the Freesurfer image analysis suite and independent component analysis. Because brain volume varies by age we compared participant’s volume variation with that derived from a control cohort of 75 subjects. In addition we also regressed out the possible brain volume changes induced by long term alcohol consumption. Small cerebral cortex, cerebellar and caudate along with large cerebral white matter and 5th ventricle volumes are shown to be significantly associated with increased AUD severity. When these volume variations are compared with control subject volumes; the variations seen in subjects with AUD are markedly different from normal aging effects. CNVs at 11 q14.2 are marginally (p < 0.05 uncorrected) correlated with such brain volume variations and the correlation holds true after controlling for long-term alcohol consumption; deletion carriers have smaller cerebral cortex, cerebellar, caudate and larger cerebral white matter and 5th ventricle volumes than insertion carriers or subjects with no variation in this region. Similarly, deletion carriers also demonstrate higher AUD severity scores than insertion carriers or subjects with no variation. The results presented here suggest that copy number variation and in particular the variation at chromosome 11 q14.2 may have an impact in brain volume variation, potentially influencing AUD behavior.
Keywords: Copy number variations, Structural MRI, Genetics, Alcohol dependence
Introduction
Variations in the human genome are present in many forms; including single nucleotide polymorphisms (SNPs), presence/ absence of transposable elements and structural copy number variations (CNVs) (insertions, deletions). Until recently SNPs were thought to be the dominant form of genetic variation, however several studies including (Estivill & Armengol, 2007) and (Sebat et al., 2004) have shown that CNVs account for a significant amount of the nucleotide sequence variation. They have been implicated as contributing factors to many neuropsychiatric and other diseases including autism (Pinto et al., 2010), schizophrenia (Cook & Scherer, 2008), late onset Alzheimer’s disease (Heinzen et al., 2009) and rheumatoid arthritis (Uddin, Sturge, Rahman, & Woods, 2011). However, given their increasing association as a potential biomarker for several prominent diseases; CNV’s effect on substance abuse, in particular alcohol use disorders (AUDs), remains largely understudied.
There is an increasing amount of evidence suggesting that genetic variations play an important role in AUD (Jacob et al., 2003; Lichtermann et al., 2000; Yasseen, Kennedy, Zawertailo, & Busto, 2010). Several candidate genes have been identified, including the dopamine receptor D2 gene DRD2, serotonin transporter genes 5-HT2A, 5-HT2C and GABA receptor gene GABAα6 (Dick & Foroud, 2003; Schuckit et al., 1999). However, genetic influences on behavior are complex and the influence of any single gene is likely to be modest. Because of their large size and possible involvement with multiple genes in a region of the chromosome, CNVs make a good candidate for research into genetic effects on AUDs. As an exploratory study, genome wide association studies are a logical choice to uncover new genetic variations associated with AUDs.
Recently, neuroimaging measures have been applied as an intermediate biological phenotype to investigate the effect of genes on human behavior. Genetic modulation of brain function is a plausible model for increased AUD risk (Hutchison, 2008). These brain based phenotypes are predominately determined from functional magnetic resonance imaging (fMRI) measurements and have been linked to predisposition from genetic variations of genes including DRD2, DRD4 OPRM1 and CNVs to AUD in several studies (Filbey et al., 2008; Heinz et al., 2004; Liu, Calhoun, Chen, Claus, & Hutchison, 2011). Several regions are implicated, including the ventral striatum, precuneus and prefrontal cortex. In addition to using fMRI to find genetic associations with AUD, magnetic resonance spectroscopy has also been used to find associations between metabolite concentrations in the brain and total CNV burden in an alcohol using population (Yeo, Gangestad, Gasparovic et al., 2011; Yeo, Gangestad, Liu et al., 2011). Similar to using intermediate functional and metabolic phenotypes, intermediate structural phenotypes have also been used to study predisposed risk to AUD from alcohol dependence families (Hill et al., 2007, 2011). While there has been good progress in both determining genetic susceptibility to AUDs and categorizing brain structural differences related to AUDs, little work has been done combining both genetic variants with structural differences.
Given the general lack of knowledge of CNV in alcohol dependent populations, we perform a genome-wide association study on CNVs derived from high density genotyping data from an Illumina human 1 M-duo assay. We specifically focus on CNV regions with frequency greater than 1%. Inspired by previous findings with functional data (Liu et al., 2011); we adopt a model described in Fig. 1; where in addition to direct genetic influence upon behavior, brain volume variations act as a putative intermediate phenotype between copy number variations and behavior. Additionally, we also consider the possible influence of other effects, such as aging and prolonged alcohol use, on brain volume variations.
Fig. 1.
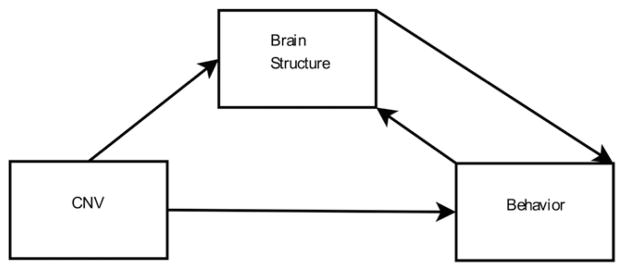
Model of CNV influence on alcohol use.
Materials and methods
Subjects and data collection
The results reported in this paper combine subjects from two studies investigating genetic effects on AUD. Both studies were conducted in accordance with the principles expressed in the Declaration of Helsinki of 1975 as revised in 1983 and approved by the Institutional Review Board of The University of New Mexico. One study collected treatment naive subjects and the other collected treatment seeking subjects. Right handed subjects between the ages of 21 and 55 who had a minimum of two binge drinking episodes per week were recruited and provided written informed consent. Binge drinking was defined as 5 or more drinks per episode for men, and 4 or more drinks for women, these binge episodes had to occur at least 5 times within the past month. Using the structured clinical interview for DSM-IV (SCID); 61% of participants were diagnosed with alcohol dependence, 80% with alcohol abuse at the interview time. 70% were diagnosed with alcohol dependence and 93% with alcohol abuse at lifetime. Because such a high percentage of participants were diagnosed with alcohol dependence or alcohol abuse at lifetime, we refer to them as subjects with AUD (Claus, Ewing, Filbey, Sabbineni, & Hutchison, 2011). Subjects were otherwise healthy, with no history of severe traumatic brain injury or symptoms of psychosis reported. Demographic information was collected and multiple AUD assessments were administered to subjects in order to gauge overall AUD severity. They included: alcohol dependency score (ADS) (Skinner & Allen, 1982), alcohol use disorder identification test (AUDIT) (Barry & Fleming, 1993), impaired control scale (ICS) (Heather, Tebbutt, Mattick, & Zamir, 1993) and the average number of drinking days in the 90 day period preceding their interview (tlfb avgd). Other alcohol use assessments such as the self-rating of the effects of alcohol scale and drinking history questionnaire were also available, however a significant portion of the data was incomplete and in order to maximize the number of available subjects we chose to use this subset of assessments. Available subcategories of each assessment score are shown in Table 1. Subject’s assessments showed a range of hazardous drinking behavior with AUDITtot ranging from 6 to 39.
Table 1.
Alcohol use disorder severity assessment subscales.
| AUDIT | ADS | ICS |
|---|---|---|
| AUDIT 1 – How often do you have a drink containing alcohol? | ADScon – Loss of behavior control. | ICSac – Attempted control. |
| AUDIT 2 – How many drinks do you have on a typical day when you are drinking? | ADSobs – Obsessive drinking style | ICSfc – Failed control. |
| AUDIT 3 – How often do you have 6 or more drinks on one occasion? | ADSper – Psychoperceptual withdrawal. | ICSpc – Perceived control. |
| AUDITtot – Total raw score from ten questions. | ADSphy – Psychophysical withdrawal. |
Subjects provided saliva samples for DNA extraction and genotyping and underwent structural MRI scans. A total of 326 subjects were consented, 305 passed quality control checks for CNV detection and of those 305, 283 passed further quality checks on their structural MRI scans. 84 of the 283 subjects were female age 33.02 ± 10.73 and 199 were male age 31.97 ± 9.42. Because our subjects were drawn from two separate studies, the final sample included 131 treatment seeking individuals and 152 treatment naive individuals. Structural data from a control cohort of 75 subjects drawn from a separate schizophrenia study were also used. Control subjects were screened using the SCID for DSM-IV, subjects were excluded who were diagnosed with alcohol and substance abuse/dependence, medical, psychiatric or neurological illnesses (Segall et al., 2009). All of the control subjects provided written informed consent. Forty eight of subjects were male and subject age was 32.04 ± 11.51.
Genotyping, CNV detection and structural measurements
Saliva was collected from participating subjects and DNA was extracted, purified and genotyped on an Illumina human 1 M-duo SNP assay resulting in 1,199,187 genotyped loci. CNVs were detecting using the log-R intensity ratio (LRR) and the beta allele frequency of each autosome locus in a process described in (Chen, Jingyu, Boutte, & Calhoun, 2011). Briefly, after an initial outlier and principal component correction to remove confounding experimental factors, the intensity and allele frequency data was segmented using both a circular binary segmentation algorithm (Olshen, Venkatraman, Lucito, & Wigler, 2004) and hidden Markov model based algorithm (Wang et al., 2007). Only those regions where both algorithms agreed were included in the final calls. Each copy number call was coded either 0,1,2,3,4 for homozygous and hemizygous variations with 2 representing the neutral case. Regions showing more than 1% incidence frequency of CNV calls were selected for further analysis resulting in a total of 253 CNV regions.
Structural MRI data were collected on a 3-Tesla Siemens Trio scanner. High resolution T1-weighted anatomic images were acquired with a 5-echo multi-echo MPRAGE sequence with TE = 1.64 ms, TR = 2.53 s, TI = 1.2 s, flip angle = 7°, number of excitations = 1, slice thickness = 1 mm, field of view = 256 mm, resolution = 256 × 256. Cortical reconstruction and volumetric segmentation was performed with the Freesurfer image analysis suite, which is documented and freely available for download online at (http://surfer.nmr.mgh.harvard.edu/). The technical details of these procedures are described in (Dale, Fischl, & Sereno, 1999; Fischl, Sereno, & Dale, 1999; Han et al., 2006). This processing includes motion correction and averaging (when available) of multiple T1 weighted images (Reuter, Rosas, & Fischl, 2010), removal of non brain tissue using a surface deformation method (Ségonne et al., 2004), Talairach transformation, segmentation of sub cortical white matter and deep gray matter structures (hippocampus, amygdala, caudate, putamen, ventricles), intensity normalization, tessellation of the gray matter white matter boundary, automated topology correction and surface deformation following intensity gradients. Following these procedures, 38 regionally segmented volumes for gray and white matter structures were obtained and carried forward in the analysis. Specific regions are shown in Table 2.
Table 2.
Regionally segmented brain regions. Segmented volumes for left and right hemispheres were used.
| Area | Area |
|---|---|
| Cerebral white matter | Accumbens |
| Cerebral cortex | Ventral DC |
| Lateral ventricle | Right vessel |
| Inferior lateral ventricle | Left vessel |
| Cerebellum white matter | Choroid plexus |
| Cerebellum cortex | 5th ventricle |
| Thalamus proper | Optic chiasm |
| Caudate | 3rd ventricle |
| Putamen | 4th ventricle |
| Pallidum | Brain stem |
| Hippocampus | CSF |
| Amygdala |
Parallel ICA and alcohol/structure factor association with CNVs
Because there is evidence to suggest a connection between AUD and brain structural variations (Harper & Kril, 1989; Jernigan et al., 1991; de la Monte, 1988; Pfefferbaum et al., 1995, 1998); we use brain volume as a putative intermediate phenotype to connect CNVs with the risk to AUD. The dual factorization framework of parallel independent component analysis (parallel ICA) presented in (Jingyu, Demirci, & Calhoun, 2008; Liu et al., 2009) is used to search for connected brain volume variation and hazardous drinking behavior and is explained below.
ICA (Bell & Sejnowski, 1995) is a procedure to reconstruct a group of statistically independent components from a set of linearly mixed observations. Mathematically this can be written as X = AS, where X represents our observations, in this case regionally segmented brain volumes or multiple AUD assessments from each subject. S represents the latent, statistically independent components and each component in this study is a network from covaried brain regions or a factor from co-varied AUD assessments across subjects. The loading coefficients, A, represent how each of these components is represented in the subjects.
Parallel ICA, as an extension of ICA, computes the same factorization of X, except it does it on two sets of observations, X1 and X2, simultaneously with an added constraint on the correlation between loading coefficients A1 and A2. By using this algorithm, components of different brain regions can be linked with components of different alcohol use assessments through correlated loading patterns across subjects. And thus parallel ICA is able to extract the brain volume variation associated with AUD severity, if the correlation between loading patterns is significant. After parallel ICA, the identified significantly correlated brain volume and alcohol use disorder components are used to test the potential CNVs’ effect on AUD. The procedure is summarized in the following steps:
Because of variability in subject brain size, due to gender or physiological differences, each subject’s regional brain volume was corrected using their total intra cranial volume. The correction was performed using a simple linear regression.
Each subject’s AUD assessment scores, seen in Table 1 and regionally segmented brain volumes were normalized (z-score) and factorized together using parallel ICA. Parallel ICA was done using the FIT toolbox for MATLAB, which are documented and freely available for download online at (http://mialab.mrn.org/software). The number of independent components for each modality was chosen using a combination of minimum description length principles (Akaike, 1974) and visual inspection of each data set’s eigenspectrum. The final component numbers were 7 brain volume components and 3 alcohol use disorder components. The significance of the correlation between the alcohol use disorder and brain volume components was corrected for multiple comparisons (21) at a significance level of p = 0.0024 and remained stable over a wide range component numbers, between 4 and 25 brain volume components and 3 and 8 alcohol use disorder components. This component pair was selected for further analysis on associations with CNVs.
An unbalanced one way ANOVA was applied to each CNV region to detect differences in the paired brain volume and alcohol use disorder component loadings. Any CNV regions that showed differences, p < 0.05 uncorrected for multiple comparisons across 253 CNV regions in both components, were selected. These CNV regions, though statistically not significant in terms of influence on regional brain volume and AUD behavior due to infrequency and small sample size; may still be biologically meaningful and reasonable. Here, we are conducting an exploratory study and hope to provide insights or suggestions for further in depth investigations.
Because aging is a strong confounding factor on brain volume variation, we compare our brain volume results with those derived from an independent control cohort. Using ICA, seven components were extracted in the control group in order to match previous results, and one component which was most correlated with subject age was selected to compare with the AUD subjects’ brain volume component. Nine brain regions were compared using percent changes in contribution weights, calculated as weights in the AUD subjects’ component minus weights in the controls’ component normalized by control weights.
Because of known neurotoxicity effects on brain volume changes due to long term alcohol consumption, we further use a linear regression model including candidate CNV regions and each subject’s duration of drinking to assess the genetic effect on brain volume variation. Duration of drinking is defined as subject age minus the age the subject reported beginning drinking.
Results
Total CNV regions
A total of 5220 CNVs were identified from 283 subjects using the conservative CNV detection scheme described above. From these 5220 regions, 253 regions were identified with incidence frequency greater than 1%. The detected CNVs range from 512 bp to 3 × 10⁶ bp with 0.4% greater than 5 × 10⁵ bp in length. A large portion of the CNVs detected occur with frequency less than 1% in the subjects, however here we limit our focus on frequent CNVs (frequency > 1%) to explore the common variant – common disorder hypothesis. Table 3 shows overall statistics for detected CNVs with frequency greater than 1%.
Table 3.
CNV statistics.
| Frequent CNVs | Statistics |
|---|---|
| Frequency | Min: 1% Max: 54% Mean: 4% |
| Deletions | Homozygous: 906 Hemizygous: 891 |
| Insertions | Homozygous: 498 Hemizygous: 1221 |
| CNV per subject | Min: 1 Max: 40 Mean: 12 |
| Size | 512 bp to 2,978,538 bp |
Drinking behavior and brain structural variation
After accounting for differences in subject total intra cranial volumes, a linked brain volume and alcohol use disorder component pair was found using parallel ICA. The alcohol use disorder component shown in Fig. 2 and the brain volume component shown in Fig. 3 have a correlation of 0.41, p < 0.05 corrected for all 21 comparisons and account for >70% of the variance in both data sets. The alcohol use disorder component is comprised most dominantly of ADScon, AUDITtot, ICSac, ICSfc and ICSpc scores, shown by their large absolute contribution weights. The positive ADScon contribution weight indicates an increase in loss of behavior control and the positive AUDITtot weight indicates an increase in the alcohol use disorder total score. The component also shows large positive ICSac weight and large negative ICSfc and ICSpc weights, which indicate increased attempts to control alcohol use coupled with decreases in success of controlling use and decreases in subject’s perception of control. This AUD component captures multiple perspectives including hazardous alcohol use and loss of control as well as perception gauging the overall severity of AUD. Hereafter we will refer to this component as the AUD severity component.
Fig. 2.

AUD severity component weights linked to the brain volume component with correlation of 0.41, p < 0.05 corrected. This component explains approximately 70% of the variance present in the subjects’ AUD assessments. The component weights show large positive ADS and AUDIT weights and large negative ICSfc and ICSpc weights consistent with increased alcohol use disorder severity.
Fig. 3.

Brain volume component weights for alcohol using subjects. Blue indicates small cerebella and caudate volumes and red large 5th ventricle (cavum septum pellucidum) volume. (For interpretation of the references to color in this figure legend, the reader is referred to the web version of this article.)
The associated brain volume component is shown in Fig. 3 and is mainly composed of nine brain regions including cerebral whiter matter, cerebral cortex, cerebellum cortex and caudate from left and right hemispheres, and 5th ventricle (contribution weight listed in Fig. 3). Along with smaller cerebral cortex and larger cerebral white matter, specific regions are highlighted with blue representing smaller the cerebellar and caudate regions while the red represents larger 5th ventricle (cavum septum pellucidum) volumes. The significant correlation of this brain volume component to the AUD severity component implies that such brain volume variation can be a valid intermediate phenotype for genetic effect on AUD.
Genetic associations with brain volume and behavioral components
To investigate CNV influence on volume variations and behavior, the brain volume component loadings were used in an unbalanced one way ANOVA to find any associated CNV regions. No region passed a Bonferroni corrected significance threshold of p < 4 × 10⁻⁵. However, one CNV region located at chromosome 11 q14.2 was found, with p = 0.0043, showing differences in the brain volume and AUD severity components loading coefficients, p < 0.05. This region is approximately 2000 bp (85981702–85984049) long with twelve subjects having homozygous deletions; six have hemizygous insertions and 265 subjects having no variation in this region. The differences in the brain volume loading coefficients are shown in Fig. 4; deletion carriers have significantly, p < 0.05, higher median loading coefficients than insertion carriers or subjects without variation. Similarly, insertion carriers have significantly lower, p < 0.05, median loading coefficients than deletion carriers or subjects with no variation. There is a significant, p < 0.05, negative slope associated with these differences indicating the possible presence of a genetic dosage effect. The high loading coefficients of this brain volume component indicate small cerebral cortex, cerebellar and caudate volumes and large cerebral whiter matter and 5th ventricle volumes; the low loading coefficients indicate the opposite pattern.
Fig. 4.

Volume component loading coefficient box plots for candidate CNV region at chromosome 11 q14.2. There are 12 homozygous deletion carriers, 6 hemizygous insertion carriers and 265 subjects with no variation in this region. Deletion carriers have significantly, p < 0.05, higher median loading coefficients indicating these subjects have small cerebellar and caudate volumes and large 5th ventricle volume relative to insertion carriers and subjects with no variation. Similarly, insertion carriers have significantly, p < 0.05, lower median loading coefficients indicating they have large cerebellar and caudate volumes and small 5th ventricle volumes relative to deletion carriers or subjects with no variation. The central mark or each box represents the median with edges representing the 25th and 75th percentile respectively. The whiskers extend to the extreme non-outlier points. Whiskers coincide with the box edges for hemizygous insertions.
Fig. 5 shows the direct association between this CNV region and the AUD severity component. Similar to before, deletion carriers have significantly, p < 0.05, higher median loading coefficients than insertion carriers or subjects with no variation. This indicates that deletion carriers contribute more to the alcohol use disorder severity component shown in Fig. 2 than insertion carriers or subjects with no variation.
Fig. 5.

Alcohol component loading coefficient box plots for candidate CNV region at chromosome 11 q14.2. Deletion carriers have significantly, p < 0.05, higher median loading coefficients indicating these subjects contribute more to the alcohol use disorder severity component than insertion carriers or subjects with no variation. Similarly, insertion carriers have significantly, p < 0.05, lower loading coefficients indicating these subjects contribute less to the alcohol use disorder severity component than deletion carriers or subjects with no variation. Whiskers coincide with the box edges for hemizygous insertions.
Cross evaluation of aging effect on brain volume variations
Because age is a known contributing factor to brain volume variation (correlation of 0.66 between age and the brain volume component shown in Fig. 3), particularly gray matter loss, we extracted an age related brain volume component (indicating regional volume changes driven by age, correlation of 0.62) from the control cohort of 75 subjects and compared with the AUD subjects’ brain volume component.
Fig. 6 shows the differences of component weights from subjects with AUD and control subjects. Left cerebellum, right caudate, left and right overall white matter and 5th ventricle all show significantly, p < 0.05, different weights in the AUD subject’s component compared with the control component. The significantly larger deviations observed in subjects with AUD suggest that the brain volume component extracted from these subjects is not due to normal aging effects.
Fig. 6.

Percent change in weights of subjects with AUD compared with control subjects. The change was calculated as subjects with AUD weights minus control weights normalized by the control weights. Positive values indicate larger volumes in subjects with AUD versus control subjects and negative values indicate smaller volumes. The change in weights was a significant difference, p < 0.05, in left cerebellum cortex, right caudate, left and right overall white matter and 5th ventricle.
Cross evaluation of long-term drinking effect on brain volume variations
Given the reported effect of chronic alcohol use on brain volume reduction (Fein et al., 2002; Pfefferbaum et al., 1998), we tested subject’s duration of drinking along with the candidate CNV regions to assess the genetic effect on brain volume variation using a linear regression model. As seen in Fig. 7 after controlling for duration of drinking, deletion carriers still have significantly, p < 0.05, higher loading coefficients than insertion carriers or subjects with no variation. In addition to this, there is still a significant negative slope associated with the loadings of brain volume component indicating a possible dosage effect of copy number on brain volume variation.
Fig. 7.

Volume component loading coefficient box plots for candidate CNV region at chromosome 11 q14.2 after correcting for each subject’s duration of drinking. Deletion carriers still have significantly, p < 0.05, higher median loading coefficients than insertion carriers or subjects with no variation.
Discussion
Recent interest in frequent CNVs and their contribution to several common diseases led us to investigate relationships between frequent CNVs, brain volume variations and AUD. As seen in Table 3, the frequency of CNVs varies from 1% to 54%. Recent studies (Boyko et al., 2008; Conrad et al., 2010) suggest that common CNVs may not be able to account for unexplained heritability of complex traits left in SNP genome-wide association studies. However, these previous studies have restricted their threshold to be greater than 10% frequency. By decreasing our threshold to 1% the number of CNVs present in our analysis is increased and previously unexplored variations may be captured. In addition to this we suggest that the structural impact of frequent CNVs may depend upon the prevalence of the disease in question. Alcohol abuse and dependence remains highly prevalent and disabling in the United States, with lifetime alcohol dependence estimated at 12.5% (Hasin, Stinson, Ogburn, & Grant, 2007). Because AUD is a complex behavior we do not exclude the possibility of different types of variation (SNP and CNV) affecting the same genetic function to similarly influence AUD. Our main focus here has been identifying CNVs influence on brain volume differences related to AUD.
The overall AUD severity component seen in Fig. 2 is consistent with previously reported AUD factors (Rist, Glöckner-Rist, & Demmel, 2009; Shevlin & Smith, 2007), where two factors, one representing alcohol related problems and the second direct alcohol use, were sufficient to explain the variance in the AUDIT assessment. These previous reports do not include ADS and ICS assessments, however our results suggest a single combined problem and use factor is sufficient to explain the majority of the variance contained in the combined assessments. This component is consistently produced over varying component numbers. Subjects with large weights in these AUD assessments also show small overall gray matter, cerebellar and caudate volumes as well as large white matter and ventricle volumes with a correlation of 0.41, p < 0.05 corrected. This volumetric variation association with alcohol use disorder is in accord with previously reported results (Durazzo et al., 2011; Fein et al., 2002; Mattson et al., 1996; Sullivan et al., 2000). While overall gray and white matter volume variations can be considered a gross measure of structural differences we focus more attention on the cerebellar, caudate and ventricle regions as they may prove more useful for potential future research. For example, specific decreases in cerebella volumes have also been associated with alcohol dependence and schizophrenia (Varnas et al., 2007) and malnutrition (Nicolás et al., 2000).
Deletion carriers at chromosome 11 q14.2 have significantly higher AUD severity and brain volume loading coefficients as seen in Figs. 4 and 5, than insertion carriers or subjects with no variation. The significant negative slope associated with these loading coefficients suggests there may be a possible dosage effect in present. However, previous reports of allelic deletions or duplications affecting gene dosage have only focused on the homozygous case (Schuster-Böckler, Conrad, & Bateman, 2010) and there are no homozygous insertion carriers in this region. However, larger loadings seen in insertion carriers translate into lower AUD severity or larger cerebella and caudate volumes as well as smaller 5th ventricle volume seen in Fig. 2 or Fig. 3. Genetic duplications have previously been indicated in decreasing the susceptibility to HIV/ AIDS (Gonzalez et al., 2005). This previous result coupled with our findings that the markedly lower AUD severity loadings are in subjects with insertions at chromosome 11 q14.2 suggests that insertions may have a positive influence on mitigating the effect of some behaviors or diseases. Similarly, deletion carriers in this region have significantly higher median loading coefficients. CNV deletions have previously been shown to have a general deleterious effect on variations in intelligence (Yeo, Gangestad, Gasparovic et al., 2011; Yeo, Gangestad, Liu et al., 2011) as well as autism risk (Pinto et al., 2010) and other neuropsychiatric diseases (Durand et al., 2007). The identified CNV region at chromosome 11 q14.2 corresponds to the ME3 gene malic enzyme which catalyzes malate to pyruvate and is involved in the glycolysis metabolic pathway. Several associations between ME3 malic enzyme 3 NADP(+)-dependent mitochondrial isoform and both schizophrenia and AIDS progression (Hendrickson et al., 2010; Martins-de-Souza et al., 2010) have recently been made. Similarly, polymorphisms in this gene have also been indicated as a factor in initiating tobacco use (Vink et al., 2009). This candidate region did not pass a Bonferroni corrected significance threshold. However, considering CNV’s relative infrequency (between 1 and 10%) in general populations (Kato et al., 2010), this is not surprising given the number of subjects included in this study.
Because of smoking’s high co-morbidity with alcohol use (Meyerhoff et al., 2006) and the previous association between the ME3 gene and tobacco use (Vink et al., 2009), we used an unbalanced one way ANOVA to detect any associations between CNVs at chromosome 11 q14.2 and regular tobacco use. Of the 283 subjects included in this analysis, 149 subjects reported regular tobacco use. Here we define regular tobacco use as using tobacco at least once per day. No significant association, p < 0.05 was found between tobacco use and CNVs at chromosome 11 q14.2. However, our sample was significantly smaller (n = 283) than in the previous report (n = 1777) (Vink et al., 2009). This may account for the absence of association between CNVs at chromosome 11 q14.2 and tobacco use in our sample.
Aging clearly plays a role in brain volume variation (Fotenos, Mintun, Snyder, Morris, & Buckner, 2008). Because of this we use a comparison with 75 healthy control subjects as a method to quantify brain volume variations associated with AUD. From Fig. 6 we see the percent change in component weights between subjects with AUD and control subjects. There are significant differences between the groups in overall white matter, cerebella and caudate as well as 5th ventricle volume. Differences from zero indicate larger or smaller volumes versus controls. Interestingly, there is little change in overall gray matter between the two groups indicating that smaller overall gray matter volumes may largely be attributed to normal aging effects. The differences in cerebellar, caudate, white matter and 5th ventricle volumes however, indicate there is significant variation seen in the subjects with AUD not present in the control subjects. This is a largely heuristic comparison; however it does indicate that the variation in regional volumes is not due to normal aging.
There is a strong correlation between the brain volume component and duration of drinking. A previously reported study (Pfefferbaum et al., 1998) demonstrated a significantly faster deterioration of brain tissue in alcohol dependent subjects than healthy controls. Similar gray matter and ventricle changes were also reported in Harper and Kril (1989), Jernigan et al. (1991), de la Monte (1988), Pfefferbaum et al. (1995). Another study (Bartzokis et al., 2000) demonstrated similar results in cocaine dependent subjects. In light of these results, it is not surprising that we also observed a strong connection between duration of drinking and brain volume variation associated with alcohol use disorder severity. However, after accounting for co-variation with duration of drinking, Fig. 7 the brain volume variations we observe still show a significant difference between deletion carriers, insertion carriers and subjects with no variation at chromosome 11 q14.2. This is consistent with our initial model, Fig. 1 which includes contributions to brain volume variation from both CNVs and alcohol dependent behavior. Duration of drinking is also highly correlated (0.44) with the alcohol use disorder severity component in Fig. 2. This is also consistent with our expectation that duration of drinking can partially co-vary with AUD severity. Certainly, a subject’s brain volume is associated with duration of drinking and possible neurotoxicity effects, however a significant portion of brain volume variation is also associated with CNVs chromosome 11 q14.2.
The results of this study suggest that specific CNVs play a role in brain volume variations and drinking behavior, however there are several limitations. First, the subject sample size included in this study is relatively small given CNV’s infrequency. Other exploratory studies which have found statistically significant results using CNVs (Pinto et al., 2010) have included significantly larger sample sizes (approximately 1000). We partially mitigate this effect by introducing brain volume as an intermediate phenotype to gain statistical power. However, we have conducted a genome wide search for CNVs and by including such a large number of CNVs in the study, the statistical power is further limited. Finally, the results presented here are only statistical relations between variables. They need to be further validated by cellular studies of the genetic function at the identified CNV region.
However, even given the above mentioned limitations we were able to use parallel ICA factorization to identify brain volume variations associated with AUD severity. Increased hazardous alcohol use is significantly associated with smaller cerebellar and caudate volumes along with larger ventricle volumes. Using this intermediate brain phenotype we identified one CNV region at chromosome 11 q14.2 in a genome-wide copy number analysis that was marginally associated with brain volume variations. Deletion carriers in this region show significantly smaller cerebellar and caudate volumes and larger 5th ventricle volumes than insertion carriers or subjects with no variation in this region. They also show significantly higher alcohol use disorder severity loading coefficients than insertion carriers or subjects with no variation. The results presented here suggest that CNVs and in particular the CNV at chromosome 11 q14.2 corresponding to the ME3 gene may have an impact in cerebral volume variation as well as upon hazardous drinking behavior.
Acknowledgments
We are grateful for the help of the MRN Genetics’ Lab provided in collecting the genetic data. This work was supported by grant 1R21DA027626 from the National Institutes of Health.
References
- Akaike H. A new look at the statistical model identification. IEEE Transactions on Automatic Control. 1974;19(6):716–723. [Google Scholar]
- Barry KL, Fleming MF. The alcohol use disorders identification test (audit) and the smast-13: predictive validity in a rural primary care sample. Alcohol and Alcoholism. 1993;28(1):33–42. [PubMed] [Google Scholar]
- Bartzokis G, Beckson M, Lu PH, Edwards N, Rapoport R, Wiseman E, et al. Age-related brain volume reductions in amphetamine and cocaine addicts and normal controls: implications for addiction research. Psychiatry Research. 2000;98(2):93–102. doi: 10.1016/s0925-4927(99)00052-9. [DOI] [PubMed] [Google Scholar]
- Bell AJ, Sejnowski TJ. An information-maximization approach to blind separation and blind deconvolution. Neural Computation. 1995;7(6):1129–1159. doi: 10.1162/neco.1995.7.6.1129. [DOI] [PubMed] [Google Scholar]
- Boyko AR, Williamson SH, Indap AR, Degenhardt JD, Hernandez RD, Lohmueller KE, et al. Assessing the evolutionary impact of amino acid mutations in the human genome. PLoS Genetics. 2008;4(5):e1000083. doi: 10.1371/journal.pgen.1000083. [DOI] [PMC free article] [PubMed] [Google Scholar]
- Chen J, Jingyu L, Boutte D, Calhoun VD. A pipeline for copy number variation detection based on principal component analysis. Paper presented at the Engineering in Medicine and Biology Society, EMBC, 2011 Annual International Conference of the IEEE; 2011. [DOI] [PMC free article] [PubMed] [Google Scholar]
- Claus ED, Ewing SWF, Filbey FM, Sabbineni A, Hutchison KE. Identifying neurobiological phenotypes associated with alcohol use disorder severity. Neuropsychopharmacology. 2011;36(10):2086–2096. doi: 10.1038/npp.2011.99. [DOI] [PMC free article] [PubMed] [Google Scholar]
- Conrad DF, Pinto D, Redon R, Feuk L, Gokcumen O, Zhang Y, et al. Origins and functional impact of copy number variation in the human genome. Nature. 2010;464(7289):704–712. doi: 10.1038/nature08516. [DOI] [PMC free article] [PubMed] [Google Scholar]
- Cook EH, Jr, Scherer SW. Copy-number variations associated with neuropsychiatric conditions. Nature. 2008;455(7215):919–923. doi: 10.1038/nature07458. [DOI] [PubMed] [Google Scholar]
- Dale AM, Fischl B, Sereno MI. Cortical surface-based analysis: I. Segmentation and surface reconstruction. NeuroImage. 1999;9(2):179–194. doi: 10.1006/nimg.1998.0395. [DOI] [PubMed] [Google Scholar]
- Dick DM, Foroud T. Candidate genes for alcohol dependence: a review of genetic evidence from human studies. Alcoholism, Clinical and Experimental Research. 2003;27(5):868–879. doi: 10.1097/01.ALC.0000065436.24221.63. [DOI] [PubMed] [Google Scholar]
- Durand CM, Betancur C, Boeckers TM, Bockmann J, Chaste P, Fauchereau F, et al. Mutations in the gene encoding the synaptic scaffolding protein shank3 are associated with autism spectrum disorders. Nature Genetics. 2007;39(1):25–27. doi: 10.1038/ng1933. [DOI] [PMC free article] [PubMed] [Google Scholar]
- Durazzo TC, Tosun D, Buckley S, Gazdzinski S, Mon A, Fryer SL, et al. Cortical thickness, surface area, and volume of the brain reward system in alcohol dependence: relationships to relapse and extended abstinence. Alcoholism, Clinical and Experimental Research. 2011;35(6):1187–1200. doi: 10.1111/j.1530-0277.2011.01452.x. [DOI] [PMC free article] [PubMed] [Google Scholar]
- Estivill X, Armengol L. Copy number variants and common disorders: filling the gaps and exploring complexity in genome-wide association studies. PLoS Genetics. 2007;3(10):e190. doi: 10.1371/journal.pgen.0030190. [DOI] [PMC free article] [PubMed] [Google Scholar]
- Fein G, Di Sclafani V, Cardenas VA, Goldmann H, Tolou-Shams M, Meyerhoff DJ. Cortical gray matter loss in treatment-naïve alcohol dependent individuals. Alcoholism, Clinical and Experimental Research. 2002;26(4):558–564. [PMC free article] [PubMed] [Google Scholar]
- Filbey FM, Ray L, Smolen A, Claus ED, Audette A, Hutchison KE. Differential neural response to alcohol priming and alcohol taste cues is associated with drd4 vntr and oprm1 genotypes. Alcoholism, Clinical and Experimental Research. 2008;32(7):1113–1123. doi: 10.1111/j.1530-0277.2008.00692.x. [DOI] [PMC free article] [PubMed] [Google Scholar]
- Fischl B, Sereno MI, Dale AM. Cortical surface-based analysis: II: inflation, flattening, and a surface-based coordinate system. NeuroImage. 1999;9(2):195–207. doi: 10.1006/nimg.1998.0396. [DOI] [PubMed] [Google Scholar]
- Fotenos AF, Mintun MA, Snyder AZ, Morris JC, Buckner RL. Brain volume decline in aging: evidence for a relation between socioeconomic status, preclinical Alzheimer disease, and reserve. Archives of Neurology. 2008;65(1):113–120. doi: 10.1001/archneurol.2007.27. [DOI] [PubMed] [Google Scholar]
- Gonzalez E, Kulkarni H, Bolivar H, Mangano A, Sanchez R, Catano G, et al. The influence of ccl3l1 gene-containing segmental duplications on hiv-1/aids susceptibility. Science. 2005;307(5714):1434–1440. doi: 10.1126/science.1101160. [DOI] [PubMed] [Google Scholar]
- Han X, Jovicich J, Salat D, van der Kouwe A, Quinn B, Czanner S, et al. Reliability of mri-derived measurements of human cerebral cortical thickness: the effects of field strength, scanner upgrade and manufacturer. NeuroImage. 2006;32(1):180–194. doi: 10.1016/j.neuroimage.2006.02.051. [DOI] [PubMed] [Google Scholar]
- Harper C, Kril J. Patterns of neuronal loss in the cerebral cortex in chronic alcoholic patients. Journal of the Neurological Sciences. 1989;92(1):81–89. doi: 10.1016/0022-510x(89)90177-9. [DOI] [PubMed] [Google Scholar]
- Hasin DS, Stinson FS, Ogburn E, Grant BF. Prevalence, correlates, disability, and comorbidity of dsm-iv alcohol abuse and dependence in the United States: results from the national epidemiologic survey on alcohol and related conditions. Archives of General Psychiatry. 2007;64(7):830–842. doi: 10.1001/archpsyc.64.7.830. [DOI] [PubMed] [Google Scholar]
- Heather N, Tebbutt JS, Mattick RP, Zamir R. Development of a scale for measuring impaired control over alcohol consumption: a preliminary report. Journal of Studies on Alcohol. 1993;54(6):700–709. doi: 10.15288/jsa.1993.54.700. [DOI] [PubMed] [Google Scholar]
- Heinz A, Siessmeier T, Wrase J, Hermann D, Klein S, Grüsser-Sinopoli SM, et al. Correlation between dopamine d2 receptors in the ventral striatum and central processing of alcohol cues and craving. American Journal of Psychiatry. 2004;161(10):1783–1789. doi: 10.1176/appi.ajp.161.10.1783. [DOI] [PubMed] [Google Scholar]
- Heinzen E, Need A, Hayden K, Chiba-Falek O, Roses A, Strittmatter W, et al. Genome-wide scan of copy number variation in late-onset Alzheimer’s disease. Journal of Alzheimer’s Disease. 2009 doi: 10.3233/JAD-2010-1212. [DOI] [PMC free article] [PubMed] [Google Scholar]
- Hendrickson SL, Lautenberger JA, Chinn LW, Malasky M, Sezgin E, Kingsley LA, et al. Genetic variants in nuclear-encoded mitochondrial genes influence aids progression. PLoS ONE. 2010;5(9):e12862. doi: 10.1371/journal.pone.0012862. [DOI] [PMC free article] [PubMed] [Google Scholar]
- Hill SY, Muddasani S, Prasad K, Nutche J, Steinhauer SR, Scanlon J, et al. Cerebellar volume in offspring from multiplex alcohol dependence families. Biological Psychiatry. 2007;61(1):41–47. doi: 10.1016/j.biopsych.2006.01.007. [DOI] [PMC free article] [PubMed] [Google Scholar]
- Hill SY, Wang S, Carter H, Tessner K, Holmes B, McDermott M, et al. Cerebellum volume in high-risk offspring from multiplex alcohol dependence families: association with allelic variation in gabra2 and bdnf. Psychiatry Research. 2011;194(3):304–313. doi: 10.1016/j.pscychresns.2011.05.006. [DOI] [PMC free article] [PubMed] [Google Scholar]
- Hutchison KE. Alcohol dependence: neuroimaging and the development of translational phenotypes. Alcoholism, Clinical and Experimental Research. 2008;32(7):1111–1112. doi: 10.1111/j.1530-0277.2008.00691.x. [DOI] [PMC free article] [PubMed] [Google Scholar]
- Jacob T, Waterman B, Heath A, True W, Bucholz KK, Haber R, et al. Genetic and environmental effects on offspring alcoholism: new insights using an offspring-of-twins design. Archives of General Psychiatry. 2003;60(12):1265–1272. doi: 10.1001/archpsyc.60.12.1265. [DOI] [PubMed] [Google Scholar]
- Jernigan TL, Butters N, DiTraglia G, Schafer K, Smith T, Irwin M, et al. Reduced cerebral grey matter observed in alcoholics using magnetic resonance imaging. Alcoholism, Clinical and Experimental Research. 1991;15(3):418–427. doi: 10.1111/j.1530-0277.1991.tb00540.x. [DOI] [PubMed] [Google Scholar]
- Jingyu L, Demirci O, Calhoun VD. A parallel independent component analysis approach to investigate genomic influence on brain function. IEEE Signal Processing Letters. 2008;15:413–416. doi: 10.1109/LSP.2008.922513. [DOI] [PMC free article] [PubMed] [Google Scholar]
- Kato M, Kawaguchi T, Ishikawa S, Umeda T, Nakamichi R, Shapero MH, et al. Population-genetic nature of copy number variations in the human genome. Human Molecular Genetics. 2010;19(5):761–773. doi: 10.1093/hmg/ddp541. [DOI] [PMC free article] [PubMed] [Google Scholar]
- Lichtermann D, Hranilović D, Trixler M, Franke P, Jernej B, Delmo CD, et al. Support for allelic association of a polymorphic site in the promoter region of the serotonin transporter gene with risk for alcohol dependence. American Journal of Psychiatry. 2000;157(12):2045–2047. doi: 10.1176/appi.ajp.157.12.2045. [DOI] [PubMed] [Google Scholar]
- Liu J, Calhoun VD, Chen J, Claus ED, Hutchison KE. Effect of homozygous deletions at 22q13.1 on alcohol dependence severity and cue-elicited bold response in the precuneus. Addiction Biology. 2011;70(6):537–544. doi: 10.1111/j.1369-1600.2011.00393.x. [DOI] [PMC free article] [PubMed] [Google Scholar]
- Liu J, Pearlson G, Windemuth A, Ruano G, Perrone-Bizzozero NI, Calhoun V. Combining fmri and snp data to investigate connections between brain function and genetics using parallel ica. Human Brain Mapping. 2009;30(1):241–255. doi: 10.1002/hbm.20508. [DOI] [PMC free article] [PubMed] [Google Scholar]
- Martins-de-Souza D, Maccarrone G, Wobrock T, Zerr I, Gormanns P, Reckow S, et al. Proteome analysis of the thalamus and cerebrospinal fluid reveals glycolysis dysfunction and potential biomarkers candidates for schizophrenia. Journal of Psychiatric Research. 2010;44(16):1176–1189. doi: 10.1016/j.jpsychires.2010.04.014. [DOI] [PubMed] [Google Scholar]
- Mattson SN, Riley EP, Sowell ER, Jernigan TL, Sobel DF, Jones KL. A decrease in the size of the basal ganglia in children with fetal alcohol syndrome. Alcoholism, Clinical and Experimental Research. 1996;20(6):1088–1093. doi: 10.1111/j.1530-0277.1996.tb01951.x. [DOI] [PubMed] [Google Scholar]
- Meyerhoff DJ, Tizabi Y, Staley JK, Durazzo TC, Glass JM, Nixon SJ. Smoking comorbidity in alcoholism: neurobiological and neurocognitive consequences. Alcoholism, Clinical and Experimental Research. 2006;30(2):253–264. doi: 10.1111/j.1530-0277.2006.00034.x. [DOI] [PubMed] [Google Scholar]
- de la Monte SM. Disproportionate atrophy of cerebral white matter in chronic alcoholics. Archives of Neurology. 1988;45(9):990–992. doi: 10.1001/archneur.1988.00520330076013. [DOI] [PubMed] [Google Scholar]
- Nicolás JM, Fernández-Solà J, Robert J, Antúnez E, Cofán M, Cardenal C, et al. High ethanol intake and malnutrition in alcoholic cerebellar shrinkage. Quarterly Journal of Medicine. 2000;93(7):449–456. doi: 10.1093/qjmed/93.7.449. [DOI] [PubMed] [Google Scholar]
- Olshen AB, Venkatraman ES, Lucito R, Wigler M. Circular binary segmentation for the analysis of array-based DNA copy number data. Biostatistics. 2004;5(4):557–572. doi: 10.1093/biostatistics/kxh008. [DOI] [PubMed] [Google Scholar]
- Pfefferbaum A, Sullivan EV, Mathalon DH, Shear PK, Rosenbloom MJ, Lim KO. Longitudinal changes in magnetic resonance imaging brain volumes in abstinent and relapsed alcoholics. Alcoholism, Clinical and Experimental Research. 1995;19(5):1177–1191. doi: 10.1111/j.1530-0277.1995.tb01598.x. [DOI] [PubMed] [Google Scholar]
- Pfefferbaum A, Sullivan EV, Rosenbloom MJ, Mathalon DH, Lim KO. A controlled study of cortical gray matter and ventricular changes in alcoholic men over a 5-year interval. Archives of General Psychiatry. 1998;55(10):905–912. doi: 10.1001/archpsyc.55.10.905. [DOI] [PubMed] [Google Scholar]
- Pinto D, Pagnamenta AT, Klei L, Anney R, Merico D, Regan R, et al. Functional impact of global rare copy number variation in autism spectrum disorders. Nature. 2010;466(7304):368–372. doi: 10.1038/nature09146. [DOI] [PMC free article] [PubMed] [Google Scholar]
- Reuter M, Rosas HD, Fischl B. Highly accurate inverse consistent registration: a robust approach. NeuroImage. 2010;53(4):1181–1196. doi: 10.1016/j.neuroimage.2010.07.020. [DOI] [PMC free article] [PubMed] [Google Scholar]
- Rist F, Glöckner-Rist A, Demmel R. The alcohol use disorders identification test revisited: establishing its structure using nonlinear factor analysis and identifying subgroups of respondents using latent class factor analysis. Drug and Alcohol Dependence. 2009;100(1–2):71–82. doi: 10.1016/j.drugalcdep.2008.09.008. [DOI] [PubMed] [Google Scholar]
- Schuckit MA, Mazzanti C, Smith TL, Ahmed U, Radel M, Iwata N, et al. Selective genotyping for the role of 5-ht2a, 5-ht2c, and gabaα6 receptors and the serotonin transporter in the level of response to alcohol: a pilot study. Biological Psychiatry. 1999;45(5):647–651. doi: 10.1016/s0006-3223(98)00248-0. [DOI] [PubMed] [Google Scholar]
- Schuster-Böckler B, Conrad D, Bateman A. Dosage sensitivity shapes the evolution of copy-number varied regions. PLoS ONE. 2010;5(3):e9474. doi: 10.1371/journal.pone.0009474. [DOI] [PMC free article] [PubMed] [Google Scholar]
- Sebat J, Lakshmi B, Troge J, Alexander J, Young J, Lundin P, et al. Large-scale copy number polymorphism in the human genome. Science. 2004;305(5683):525–528. doi: 10.1126/science.1098918. [DOI] [PubMed] [Google Scholar]
- Segall JM, Turner JA, van Erp TGM, White T, Bockholt HJ, Gollub RL, et al. Voxel-based morphometric multisite collaborative study on schizophrenia. Schizophrenia Bulletin. 2009;35(1):82–95. doi: 10.1093/schbul/sbn150. [DOI] [PMC free article] [PubMed] [Google Scholar]
- Ségonne F, Dale AM, Busa E, Glessner M, Salat D, Hahn HK, et al. A hybrid approach to the skull stripping problem in mri. NeuroImage. 2004;22(3):1060–1075. doi: 10.1016/j.neuroimage.2004.03.032. [DOI] [PubMed] [Google Scholar]
- Shevlin M, Smith GW. The factor structure and concurrent validity of the alcohol use disorder identification test based on a nationally representative UK sample. Alcohol and Alcoholism. 2007;42(6):582–587. doi: 10.1093/alcalc/agm045. [DOI] [PubMed] [Google Scholar]
- Skinner HA, Allen BA. Alcohol dependence syndrome: measurement and validation. Journal of Abnormal Psychology. 1982;91(3):199–209. doi: 10.1037//0021-843x.91.3.199. [DOI] [PubMed] [Google Scholar]
- Sullivan EV, Deshmukh A, Desmond JE, Mathalon DH, Rosenbloom MJ, Lim KO, et al. Contribution of alcohol abuse to cerebellar volume deficits in men with schizophrenia. Archives of General Psychiatry. 2000;57(9):894–902. doi: 10.1001/archpsyc.57.9.894. [DOI] [PubMed] [Google Scholar]
- Uddin M, Sturge M, Rahman P, Woods MO. Autosome-wide copy number variation association analysis for rheumatoid arthritis using the wtccc high-density snp genotype data. Journal of Rheumatology. 2011;38(5):797–801. doi: 10.3899/jrheum.100758. [DOI] [PubMed] [Google Scholar]
- Varnas K, Okugawa G, Hammarberg A, NesvÅG R, Rimol LM, Franck J, et al. Cerebellar volumes in men with schizophrenia and alcohol dependence. Psychiatry and Clinical Neurosciences. 2007;61(3):326–329. doi: 10.1111/j.1440-1819.2007.01661.x. [DOI] [PubMed] [Google Scholar]
- Vink JM, Smit AB, de Geus EJC, Sullivan P, Willemsen G, Hottenga JJ, et al. Genome-wide association study of smoking initiation and current smoking. American Journal of Human Genetics. 2009;84(3):367–379. doi: 10.1016/j.ajhg.2009.02.001. [DOI] [PMC free article] [PubMed] [Google Scholar]
- Wang K, Li M, Hadley D, Liu R, Glessner J, Grant SFA, et al. Penncnv: an integrated hidden markov model designed for high-resolution copy number variation detection in whole-genome snp genotyping data. Genome Research. 2007;17(11):1665–1674. doi: 10.1101/gr.6861907. [DOI] [PMC free article] [PubMed] [Google Scholar]
- Yasseen B, Kennedy JL, Zawertailo LA, Busto UE. Comorbidity between bipolar disorder and alcohol use disorder: association of dopamine and serotonin gene polymorphisms. Psychiatry Research. 2010;176(1):30–33. doi: 10.1016/j.psychres.2008.12.009. [DOI] [PubMed] [Google Scholar]
- Yeo RA, Gangestad SW, Gasparovic C, Liu J, Calhoun VD, Thoma RJ, et al. Rare copy number deletions predict individual variation in human brain metabolite concentrations in individuals with alcohol use disorders. Biological Psychiatry. 2011;70(6):537–544. doi: 10.1016/j.biopsych.2011.04.019. [DOI] [PMC free article] [PubMed] [Google Scholar]
- Yeo RA, Gangestad SW, Liu J, Calhoun VD, Hutchison KE. Rare copy number deletions predict individual variation in intelligence. PLoS ONE. 2011;6(1):e16339. doi: 10.1371/journal.pone.0016339. [DOI] [PMC free article] [PubMed] [Google Scholar]