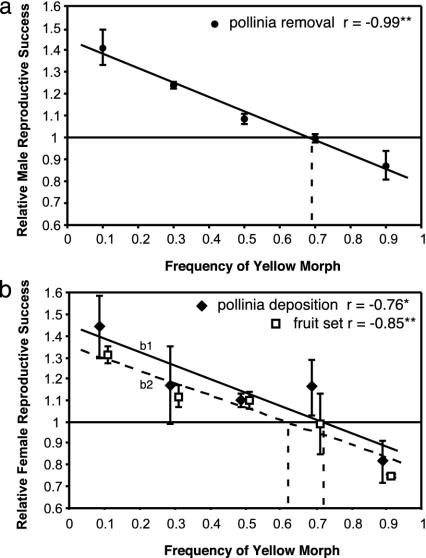
EVOLUTION. For the article “Negative frequency-dependent selection maintains a dramatic flower color polymorphism in the rewardless orchid Dactylorhiza sambucina (L.) Soò,” by Luc D. B. Gigord, Mark R. Macnair, and Ann Smithson, which appeared in issue 11, May 22, 2001, of Proc. Natl. Acad. Sci. USA (98, 6253–6255; first published May 15, 2001; 10.1073/pnas.111162598), the authors note that the labels for the symbols in the graph of Fig. 3b were switched. The open square should have been labeled “fruit set r = -0.85,” and the solid diamond should have been labeled “pollinia deposition r = -0.76.” The corrected figure and its legend appear below.
Fig. 3.
Relative male (a) and female (b) reproductive success of the yellow morph as a function of the relative frequency of the yellow morph in each array. Male reproductive success for a morph was quantified as the average proportion of pollinia removed from plants within each array (n = 5 to 45 plants) (•). Female reproductive success was measured as the average proportion of stigmas receiving pollen (♦) and setting fruits (□) for plants within each array. Relative reproductive success was calculated as described in Materials and Methods. Each data point represents the mean of two arrays per frequency, with bars showing one SEM. Statistics were calculated by using all values. r is the Spearman correlation coefficient (Pearson correlation coefficients were identical). *, P < 0.05; **, P < 0.01. The slopes given are the lines fitted in regression analysis: (a) y = -0.66x + 1.452; (b1, solid line for pollinia deposition) y = - 0.63x + 1.454, and (b2, broken line for fruit set) y = -0.59x + 1.354. The horizontal line corresponds to equal reproductive success between the two morphs. The intersection between regression lines and the horizontal line gives the value of predicted morph frequencies at equilibrium (represented by vertical dotted lines).


