

Abstract
The hamstring muscles frequently suffer injury during high-speed running, though the factors that make an individual more susceptible to injury remain poorly understood. The goals of this study were to measure the musculotendon dimensions of the biceps femoris long head (BFlh) muscle, the hamstring muscle injured most often, and to use computational models to assess the influence of variability in the BFlh’s dimensions on internal tissue strains during high-speed running. High-resolution magnetic resonance (MR) images were acquired over the thigh in 12 collegiate athletes, and musculotendon dimensions were measured in the proximal free tendon/aponeurosis, muscle and distal free tendon/aponeurosis. Finite element meshes were generated based on the average, standard deviation and range of BFlh dimensions. Simulation boundary conditions were defined to match muscle activation and musculotendon length change in the BFlh during high-speed running. Muscle and connective tissue dimensions were found to vary between subjects, with a coefficient of variation (CV) of 17 ± 6% across all dimensions. For all simulations peak local strain was highest along the proximal myotendinous junction, which is where injury typically occurs. Model variations showed that peak local tissue strain increased as the proximal aponeurosis width narrowed and the muscle width widened. The aponeurosis width and muscle width variation models showed that the relative dimensions of these structures influence internal muscle tissue strains. The results of this study indicate that a musculotendon unit’s architecture influences its strain injury susceptibility during high-speed running.
Keywords: Acute strain injury, Hamstrings, Athletes, Finite element model simulation, Active lengthening
1. Introduction
Athletes participating in a wide range of high-speed sports commonly suffer acute hamstring strain injury (Alonso et al., 2012; Brooks et al., 2006; Elliott et al., 2011; Hagglund et al., 2013). Previous research studies attempting to associate acute muscle strain injury with a variety of factors have been inconsistent and inconclusive (Opar et al., 2012; Zvijac et al., 2013). Systematic reviews of the literature found that previous studies have focused primarily on external measurements such as strength and flexibility (Foreman et al., 2006; Opar et al., 2012), but no study has assessed the intrinsic structure of the hamstring musculotendon unit and how the variability in structure dimensions influences strain injury susceptibility during high-speed running.
Previous experimental and computational studies have established the importance of hamstring musculotendon architecture to strain injury susceptibility. Dynamic magnetic resonance imaging (MRI) of the biceps femoris long head (BFlh), the hamstring injured most often (Koulouris and Connell, 2003), showed that internal hamstring morphology can play a key role in determining internal muscle tissue strain magnitude (Fiorentino et al., 2012). These experiments, however, were performed inside a MR scanner where bore size limits joint range of motion, musculotendon length change and muscle activation. Computational models provide local tissue strain predictions where experiments are not able to provide direct measurements. Previous finite element (FE) model simulations of active lengthening in the BFlh demonstrated the importance of aponeurosis (i.e., muscle fiber attachment site) dimensions to internal muscle tissue strains (Rehorn and Blemker, 2010). These simulations, however, represented a single, non-physiological variation in aponeurosis width and were not representative of muscle activations and musculotendon length changes experienced during sprinting.
The BFlh’s muscle fibers have been qualitatively described as originating on a relatively narrow proximal aponeurosis and inserting on a broader distal aponeurosis (Woodley and Mercer, 2005). Anatomical studies have primarily been based on cadaveric specimens and reported the length of BFlh muscle and tendon dimensions (Friederich and Brand, 1990; Kellis et al., 2010; Ward et al., 2009; Woodley and Mercer, 2005). To date, anatomical studies have not reported the relative width and thickness dimensions of the fiber attachment sites (i.e., the proximal aponeurosis and distal aponeurosis) in the BFlh. Furthermore, to what extent variability in musculotendon dimensions affects BFlh function during high-speed running has not been explored.
The purpose of this project was to determine the influence of musculotendon variability in the oft-injured BFlh on internal tissue strains during high-speed running. First, the musculotendon dimensions of collegiate athletes were measured with high resolution MR imaging. Second, finite element computational meshes were generated based on the average musculotendon dimensions of athletes and over the ranges measured in the muscle and proximal aponeurosis width. Third, to explore the influence of musculotendon variability on muscle tissue strains and strain injury susceptibility, local tissue strains were predicted for muscle activations/length changes derived from experiments during running at maximum speed.
2. Methods
2.1. Subjects
Twelve University of Virginia track and field athletes (eight male) signed informed consent to participate in an Institutional Review Board approved study. All athletes competed in sprinting or jumping events and comprised a range of heights (168–183 cm) and masses (62–82 kg). Athletes were participating fully in practice and events at the time of scanning and filled out a questionnaire about previous injury. Six athletes had no self-reported history of acute muscle strain injury, and six athletes had self-reported symptoms corresponding to a grade I or II injury at any point during their past. Any athlete who was recruited for the study but had suffered a grade II or more severe injury and missed multiple practices or an event due to the injury was excluded from the study. All injuries were at least six months prior to image acquisition and were not severe enough to warrant diagnosis by a clinician. Previously injured athletes and athletes without a history of injury were grouped together because a multivariate ANOVA statistical test did not reveal a significant difference (p < 0.05) between the two groups when comparing all of the measured dimensions.
2.2. MR image acquisition
Subjects were imaged in the prone position with a 3T Siemens Trio magnetic resonance (MR) scanner (Erlangen, Germany). A MR-compatible foam pad was placed under the hips and torso to flex the hips and knees to 15–20°. Axial-plane MR images were acquired from the biceps femoris long head’s origin at the hip to its insertion below the knee. A Dixon pulse sequence was used to account for the chemical shift artifact that could interfere with fine musculotendon measurements (TR 7 ms, TE 2.45 ms, flip angle 9°, 5-mm slice thickness, field-of-view 375 × 500 mm2, imaging matrix 504 × 672, Navg 2) (Dixon, 1984). The Dixon sequence yields images with high spatial resolution (0.7 × 0.7 mm2) and high contrast between muscle, fat and connective tissue.
2.3. Muscle and tendon measurements
The proximal and distal tendons of the BFlh have two parts—a thick and relatively narrow free tendon that originates or inserts onto bone and a thin and relatively wide aponeurosis on which muscle fibers originate and insert at the myotendinous junction (MTJ). The dimension of the proximal tendon, muscle and distal tendon were assessed on high-resolution MR images using image analysis software OsiriX (Rosset et al., 2004). The muscle and tendon measurements were made manually using the curvilinear measurement tool with OsiriX, and OsiriX software performed the calculation for width and thickness dimensions. Length dimensions were derived from the center of regions of interest and calculated with Microsoft Excel. Muscle and tendon dimensions measured on MR images, described in detail below, defined the geometry of the finite-element computational mesh (Table 1).
Table 1.
Musculotendon measurements for the BFlh. Biceps femoris long head (BFlh) musculotendon measurements were made on high-resolution MR images for track and field athletes. Measurements reported as average (standard deviation).
| Structure | Location | Dimensions | [cm] |
|---|---|---|---|
| Proximal free tendon | Superior | Width | 0.8 (0.1) |
| Thickness | 0.2 (0.1) | ||
| Middle | Width | 0.6 (0.1) | |
| Thickness | 0.2 (0.1) | ||
| Inferior | Width | 0.7 (0.2) | |
| Thickness | 0.2 (0.1) | ||
| n/a | Length | 7.0 (1.0) | |
| Proximal aponeurosis | Superior | Width | 0.7 (0.1) |
| Thickness | 0.2 (0.0) | ||
| Middle | Width | 1.8 (0.3) | |
| Thickness | 0.1 (0.0) | ||
| Inferior | Width | 1.7 (0.4) | |
| Thickness | 0.1 (0.0) | ||
| n/a | Length | 17.9 (1.6) | |
| Muscle | Superior taper | Width | 2.3 (0.4) |
| Thickness | 1.6 (0.2) | ||
| Distal aponeurosis end | Width | 4.8 (0.5) | |
| Thickness | 3.1 (0.5) | ||
| Middle | Width | 5.2 (0.4) | |
| Thickness | 3.6 (0.6) | ||
| Proximal aponeurosis end | Width | 4.7 (0.5) | |
| Thickness | 4.0 (0.5) | ||
| Inferior | Width | 3.6 (0.5) | |
| Thickness | 2.3 (0.4) | ||
| n/a | Length | 28.6 (2.1) | |
| Distal aponeurosis | Superior | Width | 5.8 (0.6) |
| Thickness | 0.2 (0.0) | ||
| Middle | Width | 6.3 (0.7) | |
| Thickness | 0.2 (0.0) | ||
| Inferior | Width | 0.9 (0.2) | |
| Thickness | 0.1 (0.0) | ||
| n/a | Length | 18.7 (2.2) | |
| Distal free tendon | Superior | Width | 0.7 (0.1) |
| Thickness | 0.2 (0.1) | ||
| Middle | Width | 0.7 (0.1) | |
| Thickness | 0.2 (0.1) | ||
| Inferior | Width | 0.8 (0.2) | |
| Thickness | 0.2 (0.1) | ||
| n/a | Length | 11.1 (1.7) |
To account for the variable width and thickness over the BFlh (Kellis et al., 2010), we chose six measurement locations along the tendon/aponeurosis and five locations along the muscle. For the tendon/aponeurosis, the six locations were: (i) the origin/insertion of the musculotendon unit (i.e., where the free tendon meets the bone), (ii) halfway between the origin/insertion and the last image on which no muscle was present, (iii) the last image where no muscle was present, (iv) the first image on which muscle was present, (v) halfway between the first image on which muscle was present and the end of the aponeurosis and (vi) the end of the aponeurosis. (See Fig. 1 for a visual representation of measurement locations and example measurements.) For the free tendon, we defined width as the curvilinear distance corresponding to the long axis of the cross section and through the center of the cross section (Fig. 1). For aponeurosis, we defined width as the curvilinear distance in the circumferential direction with respect to the center of the muscle’s cross section. Because of variable thickness over the width of connective tissue structures, thickness was defined as the area divided by the width measurement. This approach yielded a more reliable measurement for thickness than arbitrarily choosing a point for thickness measurement, which, for the proximal aponeurosis especially, was considerably variable over its width.
Fig. 1.

BFlh musculotendon measurements and FE mesh. The dimensions of FE computational meshes were based on musculotendon measurements on MR images. Width measurements for the tendon and muscle are indicated as dashed lines on the three cropped MR images. The solid line on the middle cropped MR image indicates the muscle thickness measurement. The FE mesh has three materials: proximal tendon/aponeurosis, muscle and distal tendon/aponeurosis. Measurement locations for each material are indicated with a line and are numbered according to the description in the text. Representative muscle fibers were mapped through the FE mesh to define initial fiber direction at each element and calculate spatially varying local tissue strain (Blemker and Delp, 2005). MR: magnetic resonance. ST: semitendinosus. GMax: gluteus maximus. BFlh: biceps femoris long head. Fib: fibula.
Muscle width and thickness were assessed at five locations: (i) halfway between the most superior image on which muscle was present and the end of the distal aponeurosis, (ii) the end of the distal aponeurosis, (iii) halfway between the most superior and most inferior images on which muscle was present, (iv) the end of the proximal aponeurosis and (v) halfway between the end of the proximal aponeurosis and the distal most image on which muscle was present. (See Fig. 1 for a visual representation of measurement locations and example measurements.) We defined muscle thickness as the curvilinear distance between the middle of aponeuroses and through the center of the cross section (Fig. 1). We defined muscle width as the curvilinear line through the center of the cross section and the points in the muscle furthest away from the center. This was usually the most anterior and posterior points in the muscle. At the measurement locations for muscle thickness and muscle width, the center of the cross section was identified by outlining the muscle and calculating the centroid of the outlined shape. For muscle and connective tissue, the centroid of the segmentation outlines was used to calculate the length of the structure, which was found by summing the linear distance between centroids along the structure’s length.
2.4. Computational mesh generation and sprinting simulations
The process for building the finite element (FE) computational meshes and simulating sprinting has been described previously (Fiorentino et al., 2013). Briefly, FE meshes were generated with TrueGrid software (XYZ Scientific Applications) and included 3900 hexahedral elements and 5262 nodes (Fig. 1). The mesh consisted of three materials – proximal free tendon/aponeurosis, muscle and distal aponeurosis/free tendon – connected rigidly by coincident nodes. Muscle and connective tissue were modeled as transversely isotropic, hyperelastic and quasi-incompressible materials (Blemker et al., 2005; Criscione et al., 2001; Weiss et al., 1996). The constitutive formulation has previously been described in detail (Blemker et al., 2005). Simulations were run with the nonlinear implicit solver Nike3D (Puso et al., 2002) and qualitatively analyzed with PostView software (Maas et al., 2010). Boundary conditions for the FE simulation were defined based on a previous study of 19 athletes running on a treadmill at maximum speed (8.64 m/s) (Chumanov et al., 2007). The previous study generated BFlh muscle activation (up to 60%) and musculotendon unit length change, (up to 8% strain) which, in this study, were applied to muscle tissue and to the inferior end of the distal tendon while holding the superior end fixed, respectively (see Fig. 2 for time-varying curves). Simulations ran from mid-swing to foot contact, or from 70% of the sprinting gait cycle to 100%, which is when BFlh injury has been predicted to occur in treadmill running studies (Heiderscheit et al., 2005; Schache et al., 2009).
Fig. 2.

Model boundary conditions and material parameters. Boundary conditions for the simulation were defined based on measured kinematics and forward dynamic simulations of sprinting in a previous study (Chumanov et al., 2007). The musculotendon unit was fixed at the proximal end and displaced at the distal end. Activation was applied to the muscle tissue. Muscle and connective tissue constitutive relationships and material parameters definitions have been published previously (Blemker et al., 2005). P1: along-fiber extension multiplicative modulus. P2: along-fiber extension exponential modulus. λofl: along-fiber stretch at optimal fiber length. λ*: stretch at which stress–strain relationship becomes linear. Ao: exponential shear modulus (Sharafi et al., 2011). Gaf: along-fiber shear modulus. Gcf: cross-fiber shear modulus. K: bulk modulus. σmax: peak isometric stress.
2.5. Strain analysis
To quantify muscle fiber strain and local strain, 76 points along 324 representative muscle fibers were tracked throughout the simulation and used to define 75 intra-fiber segment lengths (Blemker and Delp, 2005). Local fiber strain was defined as the difference between the intra-fiber segment length at each point in the simulation and the original segment length divided by the original segment length. Local fiber strain is an engineering strain definition. Peak local strain refers to the largest local strain for each fiber. Maximum peak local strain refers to the largest peak local strain achieved by any fiber at any point in the simulation.
2.6. Model variations
Finite-element meshes were generated based on the average dimensions of athletes and variability in proximal aponeurosis width and muscle width. The dimensions for the model variations are listed in Table 2. Proximal aponeurosis width and muscle width were varied from the average based on the range and standard deviation of measurements for all athletes and included the minimum, minus one standard deviation from the average, plus one standard deviation from the average and the maximum.
Table 2.
Dimensions of model variations. The model of the average athletes’ dimensions was varied to investigate the effects of proximal aponeurosis width and muscle width on internal muscle tissue strain. For proximal aponeurosis width and muscle width variations, width was varied at each superior–inferior location and over the range of measurements. Widths were set to the minimum dimensions, the average minus one standard deviation, the average plus one standard deviation and the maximum dimensions. The average model corresponds to the average dimensions across all athletes. All other dimensions in the model variations remained at the values listed in Table 1. apo: aponeurosis.
| Aponeurosis width model variations
|
||||||
|---|---|---|---|---|---|---|
| Minimum | Average minus standard deviation | Average | Average plus standard deviation | Maximum | ||
| Proximal aponeurosis width dimensions (cm) | 0.6 | 0.6 | 0.7 | 0.8 | 0.9 | Superior |
| 1.3 | 1.5 | 1.8 | 2.1 | 2.4 | Middle | |
| 1.2 | 1.3 | 1.7 | 2.1 | 2.5 | Inferior | |
| Muscle width model variations
|
||||||
|---|---|---|---|---|---|---|
| Minimum | Average minus standard deviation | Average | Average plus standard deviation | Maximum | ||
| Muscle width dimensions (cm) | 1.9 | 1.9 | 2.3 | 2.7 | 2.9 | Superior taper |
| 4.2 | 4.3 | 4.8 | 5.3 | 6.0 | Distal apo. end | |
| 4.4 | 4.8 | 5.2 | 5.7 | 5.7 | Middle | |
| 3.8 | 4.2 | 4.7 | 5.2 | 5.3 | Proximal apo. end | |
| 2.8 | 3.1 | 3.6 | 4.1 | 4.4 | Inferior taper | |
2.7. Comparison of model predictions and dynamic imaging
A previous study showed that the FE modeling framework used here was able to accurately predict strain measurements in dynamic magnetic resonance (MR) imaging experiments (Fiorentino et al., 2013). The model in the previous study predicted first principal strains in BFlh muscle tissue during active lengthening and passive lengthening experiments from a previous study (Fiorentino et al., 2012). Model predictions of local muscle tissue strain adjacent to the proximal MTJ were within the standard deviation of measurements during both passive lengthening (0.13 for the model vs. 0.13 ± 0.06 for MR experiments) and active lengthening (0.22 for the model vs. 0.19 ± 0.09 for MR experiments) (Fiorentino et al., 2013), where the standard deviation is variability across imaging subjects.
3. Results
Musculotendon dimensions of track and field athletes were variable between subjects (Table 1). To report variability across multiple structures and/or locations that can vary in size by an order of magnitude or more, the coefficient of variation was calculated (CV) as the percentage of the standard deviation divided by the mean. The CV across all dimensions and measurement locations was 17 ± 6%. For the proximal aponeurosis, the CV was 18 ± 5% over all superior–inferior locations, and the CV for muscle width was 12 ± 4%. Width dimensions for aponeuroses and muscle were variable along their length, with smaller widths in regions where the structure narrows as it approaches the free tendon. Musculotendon measurements of track and field athletes were generally within the range of values reported in cadaver and in vivo studies of the BFlh (Table 3), especially when length dimensions were expressed relative to the musculotendon unit length. For example, the proximal tendon length was 7 cm for the current study and 5 cm for a previous cadaver study (Kellis et al., 2012), and the proximal tendon length relative to musculotendon length was 15% and 13%, respectively. When comparing athletes who had sustained a previous injury to those who had never suffered an acute strain injury, measurements were not significantly different.
Table 3.
Comparison to literature values. Musculotendon measurements for the BFlh were compared to select studies in the literature. If more than one measurement was reported in a literature source, the numbers were averaged. If more than one measurement location was available for the model or literature source (e.g., superior, middle, inferior), the numbers were averaged and the standard deviation is listed. When provided, percentage of the musculotendon unit length is listed in conjunction with the measurements. For the in vivo muscle volume comparison, the BFlh was outlined on all MR images, and muscle volume was calculated as the segmentation area times the slice thickness summed over the muscle’s length (Handsfield et al., 2013). Pennation angle measurements were averaged for the proximal aponeurosis (i.e., deep aponeurosis) and the distal aponeurosis (i.e., superficial aponeurosis). MR: magnetic resonance.
| [cm] | Current study | Literature | Type | Source |
|---|---|---|---|---|
| Musculotendon length | 46.7 (100%) | 38.9 (100%) | Cadaver | Kellis et al. (2012) |
| 39.8 (100%) | Cadaver | Kellis et al. (2010) | ||
| 43.8 (100%) | Cadaver | Woodley and Mercer (2005) | ||
| Muscle length | 28.6 (61%) | 29.6 (75%) | Cadaver | Kellis et al. (2012) |
| 34.7 | Cadaver | Ward et al. (2009) | ||
| Proximal tendon length | 7.0 (15%) | 5.0 (13%) | Cadaver | Kellis et al. (2012) |
| 6.5 (15%) | Cadaver | Woodley and Mercer (2005) | ||
| Proximal aponeurosis length | 17.9 (38%) | 19.1 (48%) | Cadaver | Kellis et al. (2010) |
| 20.6 (47%) | Cadaver | Woodley and Mercer (2005) | ||
| 17.8 | In vivo | Rehorn and Blemker (2010) | ||
| Distal aponeurosis length | 18.7 (40%) | 18.3 (46%) | Cadaver | Kellis et al. (2010) |
| 18.3 (41%) | Cadaver | Woodley and Mercer (2005) | ||
| 15.6 | In vivo | Rehorn and Blemker (2010) | ||
| Distal tendon length | 11.1 (24%) | 5.3 (14%) | Cadaver | Kellis et al. (2012) |
| 9.2 (21%) | Cadaver | Woodley and Mercer (2005) | ||
| Proximal aponeurosis width | 1.4 ± 0.6 | 0.6 | In vivo | Fiorentino et al. (2012) |
| 0.8 | In vivo | Rehorn and Blemker (2010) | ||
| Distal aponeurosis width | 4.3 ± 3.0 | 4.0 | In vivo | Rehorn and Blemker (2010) |
| Muscle thickness | 2.9 ± 0.9 | 2.0 ± 0.6 | Cadaver | Kellis et al. (2010) |
| Muscle volume (cm3) | 266.6 | 251.8 | In vivo | MR image segmentation |
| 138.5 | Cadaver | Friederich and Brand (1990) | ||
| Fiber length | 10.7 ± 0.3 | 6.5 ± 0.4 | Cadaver | Kellis et al. (2010) |
| 6.5 | In vivo | Potier et al. (2009) | ||
| 11.5 | In vivo | Chleboun et al. (2001) | ||
| 13.1 | In vivo | Blackburn and Pamukoff (2014) | ||
| Fiber to muscle length ratio | 0.37 | 0.27 | Cadaver | Kellis et al. (2012) |
| 0.28 | Cadaver | Ward et al. (2009) | ||
| 0.25 | Cadaver | Wickiewicz et al. (1983) | ||
| Pennation angle (°) | 20.5 ± 2.4 | 20.3 ± 2.6 | Cadaver | Kellis et al. (2010) |
| 11.6 | Cadaver | Ward et al. (2009) | ||
| 15.6 | In vivo | Potier et al. (2009) | ||
| 11.0 | In vivo | Chleboun et al. (2001) |
Finite element results of the model with the average athletes’ musculotendon dimensions found highest along-fiber strain in muscle tissue near the proximal aponeurosis (Fig. 3). For the BFlh model variations of proximal aponeurosis width, peak local strain increased with narrower aponeurosis widths (Fig. 4). For the BFlh model variations of muscle width, peak local strain increased with wider muscle width (Fig. 5). The maximum peak local strain increased for models with relatively narrower proximal aponeurosis widths and wider muscle widths (Fig. 6). The range of maximum peak local strain was larger for the proximal aponeurosis width model variations (0.51–0.62) than for the muscle width model variations (0.55–0.60). Relative to the average model (0.57 maximum peak local strain), the minimum aponeurosis width model increased maximum strain by 9%, and the maximum muscle width model increased maximum strain by 5%. To directly compare maximum peak local strain for the aponeurosis width and muscle width models, maximum peak local strain was plotted as a function of the ratio of aponeurosis width to muscle width. Maximum peak local strain was found to increase for a smaller ratio of proximal aponeurosis width to muscle width.
Fig. 3.
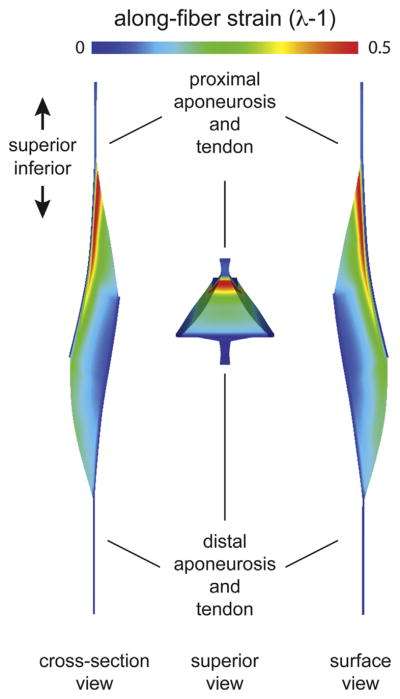
FE results. Finite element (FE) results were viewed and qualitatively analyzed with PostView post processing software (Maas et al., 2010). Along-fiber strain was largest along the proximal aponeurosis, or near the proximal myotendinous junction (MTJ), and decreased with distance to the distal aponeurosis. Views are of a longitudinal cross section (cross-section view), from superior of the musculotendon unit (superior view) and from the outside surface (surface view). The superior view shows how the muscle cross-section narrows from the center of the muscle to the proximal aponeurosis.
Fig. 4.

Aponeurosis width variation results. The proximal aponeurosis width was varied at each superior–inferior location over a physiological range and included the minimum, the average minus one standard deviation, the average plus one standard deviation and the maximum dimensions. (Dimensions listed in Table 2.) The average model results correspond to the average dimensions across all athletes. Peak local along-fiber strain plots show the temporal variation from mid-swing to foot contact, where each line represents a single representative fiber. Plots demonstrate decreasing maximum peak local along-fiber strain with wider proximal aponeurosis width. MS: mid-swing. FC: foot contact.
Fig. 5.

Muscle width variation results. The muscle width was varied at each superior–inferior location over a physiological range and included the minimum, the average minus one standard deviation, the average plus one standard deviation and the maximum dimensions. (Dimensions listed in Table 2.) The average model results correspond to the average dimensions across all athletes. Peak local along-fiber strain plots show the temporal variation from mid-swing to foot contact, where each line represents a single representative fiber. Plots demonstrate increasing maximum peak local along-fiber strain with wider muscle width. MS: mid-swing. FC: foot contact.
Fig. 6.
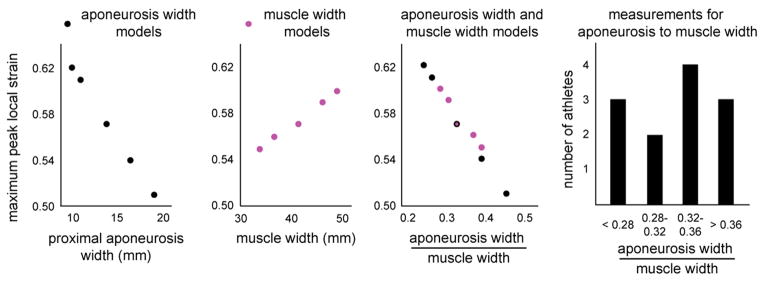
Maximum peak local strain results. Maximum peak local strain was plotted for proximal aponeurosis width and muscle width model variations. The width variations results were combined by plotting maximum peak local strain versus the ratio of proximal aponeurosis width to muscle width. The combined plot demonstrates a decreased maximum peak local strain for an increasing ratio of aponeurosis width to muscle width and the larger range of maximum peak local strain for aponeurosis width models than muscle width models. The histogram shows that the athletes’ ratios for aponeurosis width to muscle width measurements span the range of ratios used in the models.
4. Discussion
The primary goals of this study were to perform in vivo measurements for muscle and tendon dimensions over a range of subjects and to assess what impact measured physiological variability has on local tissue strain during sprinting using FE simulations. The motivation for this work is the unexplained high injury rates for the biceps femoris long head (BFlh) despite decades of inquiry into causation and individual factors. Our modeling results predict that an individual’s musculotendon dimensions contribute to strain injury susceptibility, where a larger muscle and/or narrower proximal aponeurosis make an individual more susceptible to injury by increasing peak local muscle tissue strain (Fig. 6).
Higher strains for narrower proximal aponeuroses have also been observed in the BFlh during active lengthening MR experiments (Fiorentino et al., 2012). A wider muscle was also shown to increase local tissue strains in FE simulations, though to a lesser extent than aponeurosis width over the physiological range of musculotendon measurements. A smaller ratio of aponeurosis width to muscle width resulted in larger maximum peak local strains for all model variations tested in our study, which includes ratios of 0.24, 0.26, 0.28, 0.30, 0.33, 0.37, 0.39 and 0.45 (Fig. 6). These ratios were similar to ratios measured in athletes (average: 0.32 and range 0.22–0.42). The results of the muscle width and aponeurosis width model variations demonstrate that musculotendon variability has the potential to influence internal muscle tissue strains and strain injury susceptibility during sprinting.
Modeling results found the largest peak local strain in muscle tissue adjacent to the proximal aponeurosis (Fig. 3). Previous post-injury MR studies have shown the muscle tissue adjacent to the proximal aponeurosis (i.e., myotendinous junction) suffers acute strain injury more often than other regions within the muscle (Askling et al., 2007; Silder et al., 2008). Higher strain closer to the BFlh’s proximal aponeurosis has also been observed in experimental MR studies of active lengthening in the BFlh (Silder et al., 2010). Larger strain in muscle tissue near the proximal aponeurosis was the result of the BFlh’s longitudinal cross section converging from the middle of the muscle (between the aponeuroses) into the proximal MTJ (see superior view in Fig. 3). Because the muscle’s cross sectional area is larger in the middle between the two aponeuroses and smaller adjacent to the proximal aponeurosis, a given amount of muscle activation generates more stress in the middle than near the proximal MTJ. To balance the difference in stress, the muscle tissue near the proximal MTJ must stretch more than adjacent tissue.
Computational models in the BFlh have previously demonstrated increased local tissue strain and strain injury susceptibility at faster running speeds as well (Fiorentino et al., 2013). The previous study showed an increase from 70% to 100% of maximum speed increased local tissue strain by 29%, which is only slightly greater than the increase over the range of aponeurosis widths in the current study (21%, from 0.51 to 0.62). Because faster running speeds are known to increase injury susceptibility (Lysholm and Wiklander, 1987), the comparable increase in local tissue strain over the range of aponeurosis widths suggests that the effects of musculotendon variability is almost on par with the effect of increasing speed. Animal models of injury have also found musculotendon architecture and muscle activation to influence strain injury susceptibility (Garrett et al., 1987, 1988). Furthermore, local tissue strain measurements in an animal musculotendon unit lengthening experiments found injury to occur reliably at an axial strain of 0.61 (Best et al., 1995), which is at the higher end of local tissue strain predictions in the current study. The animal experiments, however, were performed on fusiform musculotendon units (as opposed to pennate musculotendon units like the BFlh) and without muscle activation.
Biceps femoris long head musculotendon measurements were generally within the range of values reported in previous cadaveric and in vivo studies (Table 3). As would be expected when comparing a group of athletes to a cadaveric population, the magnitude of measurements was generally larger for athletes than for cadavers. When length measurements were expressed relative to the MTU length, the values reported in this study matched more closely the values from cadaver measurements. The largest deviations from previous research were muscle volume and the fiber length to muscle length ratio. The current study’s ratio, which is based on fascicle lengths derived from models, was 0.37 and a recent cadaver study found a fiber length to muscle length ratio of 0.27 (Kellis et al., 2012). Ratio differences between this in vivo study and cadaveric specimens could be attributed to the difference in posture when measurements were acquired (Schache et al., 2013), given that cadavers are typically embalmed in anatomically neutral – the hips and knees fully extended (0°) –and the hips and knees of athletes in this study were flexed to 15–20° in the MR scanner. Furthermore, longer fascicle lengths have been measured for sprinters as compared to height-matched non-sprinters (Lee and Piazza, 2009), which would help explain why the fascicle length ratio derived from models in this study is relatively longer than cadavers.
Modeling results have shown that the BFlh’s musculotendon architecture influences its strain injury susceptibility by altering the magnitude of local muscle tissue strains during sprinting. Animal models have provided the most comprehensive and direct measurements of muscle strain injury and strain injury susceptibility, given that large local tissue strain has been found to correlate directly with location of injury (Best et al., 1995) and the magnitude of strain correlates with the extent of injury (Lieber and Friden, 1993). Assuming a linear relationship between strain increase and strain injury susceptibility, the musculotendon dimension variations in humans that resulted in larger local tissue strain were considered to be more susceptible to strain injury. Therefore, an individual’s muscle and tendon dimensions should be taken into account in combination with other factors when assessing athletes’ strain injury susceptibility.
Strain injury susceptibility is likely a confluence of factors (Bahr and Holme, 2003), and a number of factors should be considered in addition to muscle and tendon dimensions. Previous injury and age have garnered the most support as factors that increase strain injury susceptibility (Opar et al., 2012); however, the cause-effect relationships between strain injury susceptibility and post-injury changes and age have yet to be determined. Future modeling work could provide insight into this question by simulating the effect of musculotendon variability in injured and non-injured athletes. Post-injury muscular changes such as atrophy, edema and strength deficits, which were recently measured at the time of return-to-sport and/or six months after injury (Sanfilippo et al., 2013), likely contribute to strain injury susceptibility as well.
The model variation results reported here motivate future work to track how musculotendon dimensions are altered after injury, disuse or training. It is possible that aponeuroses dimensions remodel at the same rate as muscular dimensions, thereby reducing (or not increasing) strain injury susceptibility by compensating for a bigger muscle with a wider aponeurosis width. In addition, muscle hypertrophy may be accompanied by reductions in muscle activation, because a larger muscle will require less muscle activation to produce the same amount of force. Furthermore, given that musculotendon dimensions varied considerably, as evidenced by the 17% coefficient of variation across all subjects and dimensions, future work is necessary to deduce why some individuals have musculotendon dimensions that make them more susceptible to injury and others do not.
Limitations to the current modeling approach include the lack of force-velocity effects and viscoelasticity in the constitutive formulation. Adding these complexities might change the magnitude of local tissue strain and possibly the relative changes with variable musculotendon dimensions. However, the general trends with narrower aponeurosis width and wider muscle width would remain, because the convergence of the longitudinal cross section rationale behind higher muscle tissue strain near the proximal MTJ is unchanged by force-velocity and viscoelasticity. In addition, the boundary conditions for the model simulations in this study are based on forward dynamic simulations of sprinting in the literature and not based on direct measurements of activation and length change in the current study’s athletes. The forward dynamic simulations in the previous study did generate motions that matched experimental marker trajectories during sprinting for 19 athletes (Chumanov et al., 2007). Additionally, future FE simulation studies could compare additional musculotendon dimensions to gain a more complete understanding of the influence of musculotendon variability.
The modeling results in the current study have a wide range of implications for the high injury rates observed in the BFlh. The idea that the musculotendon’s architecture (i.e., the relative dimensions of the muscle and aponeuroses) influences its strain injury susceptibility could help explain why certain athletes are injured and not others. More investigation, including a prospective study, is required to ascertain the deterministic capability of measuring an individual’s musculotendon dimensions. In the meantime, the modeling results of this study demonstrate the influence of the BFlh’s musculotendon dimensions on internal muscle tissue strains during sprinting, and, as such, the BFlh’s structure should be taken into consideration when trying to understand, explain and reduce the high injury rates observed in the BFlh muscle.
Acknowledgments
This work was supported by funding from the National Institutes of Health R01 AR056201. The authors also acknowledge the Achievement Rewards for College Scientists Foundation for their support. The authors thank Elizabeth Chumanov and Darryl Thelen for providing the muscle activation and musculotendon length data during high-speed running. Natalie Kramer and Christopher Herb are thanked for their assistance in recruiting track and field athletes at the University of Virginia.
Footnotes
Conflict of interest statement
The authors have no conflicts of interest to disclose.
References
- Alonso J, Edouard P, Fischetto G, Adams B, Depiesse F, Mountjoy M. Determination of future prevention strategies in elite track and field: analysis of Daegu 2011 IAAF Championships injuries and illnesses surveillance. Br J Sports Med. 2012;46:505–514. doi: 10.1136/bjsports-2012-091008. [DOI] [PMC free article] [PubMed] [Google Scholar]
- Askling CM, Tengvar M, Saartok T, Thorstensson A. Acute first-time hamstring strains during high-speed running: a longitudinal study including clinical and magnetic resonance imaging findings. Am J Sports Med. 2007;35:197–206. doi: 10.1177/0363546506294679. [DOI] [PubMed] [Google Scholar]
- Bahr R, Holme I. Risk factors for sports injuries—a methodological approach. Br J Sports Med. 2003;37:384–392. doi: 10.1136/bjsm.37.5.384. [DOI] [PMC free article] [PubMed] [Google Scholar]
- Best T, McElhaney J, Garrett W, Myers B. Axial strain measurements in skeletal muscle at various strain rates. J Biomech Eng. 1995;117:262–265. doi: 10.1115/1.2794179. [DOI] [PubMed] [Google Scholar]
- Blackburn JT, Pamukoff DN. Geometric and architectural contributions to hamstring musculotendinous stiffness. Clin Biomech (Bristol, Avon) 2014;29:105–110. doi: 10.1016/j.clinbiomech.2013.10.011. [DOI] [PubMed] [Google Scholar]
- Blemker SS, Delp SL. Three-dimensional representation of complex muscle architectures and geometries. Ann Biomed Eng. 2005;33:661–673. doi: 10.1007/s10439-005-1433-7. [DOI] [PubMed] [Google Scholar]
- Blemker SS, Pinsky PM, Delp SL. A 3D model of muscle reveals the causes of nonuniform strains in the biceps brachii. J Biomech. 2005;38:657–665. doi: 10.1016/j.jbiomech.2004.04.009. [DOI] [PubMed] [Google Scholar]
- Brooks JHM, Fuller CW, Reddin DB. Incidence, risk, and prevention of hamstring muscle injuries in professional rugby union. Am J Sports Med. 2006;34:1297–1306. doi: 10.1177/0363546505286022. [DOI] [PubMed] [Google Scholar]
- Chleboun GS, France AR, Crill MT, Braddock HK, Howell JN. In vivo measurement of fascicle length and pennation angle of the human biceps femoris muscle. Cells Tissues Organs. 2001;169:401–409. doi: 10.1159/000047908. [DOI] [PubMed] [Google Scholar]
- Chumanov ES, Heiderscheit BC, Thelen DG. The effect of speed and influence of individual muscles on hamstring mechanics during the swing phase of sprinting. J Biomech. 2007;40:3555–3562. doi: 10.1016/j.jbiomech.2007.05.026. [DOI] [PubMed] [Google Scholar]
- Criscione JC, Douglas AS, Hunter WC. Physically based strain invariant set for materials exhibiting transversely isotropic behavior. J Mech Phys Solids. 2001;49:871–897. [Google Scholar]
- Dixon W. Simple proton spectroscopic imaging. Radiology. 1984;153:189–194. doi: 10.1148/radiology.153.1.6089263. [DOI] [PubMed] [Google Scholar]
- Elliott MCCW, Zarins B, Powell JW, Kenyon CD. Hamstring muscle strains in professional football players a 10-year review. Am J Sports Med. 2011;39:843–850. doi: 10.1177/0363546510394647. [DOI] [PubMed] [Google Scholar]
- Fiorentino NM, Rehorn MR, Chumanov ES, Thelen DG, Blemker SS. Computation models predict larger muscle tissue strains at faster sprinting speeds. Med Sci Sports Exercise. 2013 doi: 10.1249/MSS.0000000000000172. (Accepted) [DOI] [PMC free article] [PubMed] [Google Scholar]
- Fiorentino NM, Epstein FH, Blemker SS. Activation and aponeurosis morphology affect in vivo muscle tissue strains near the myotendinous junction. J Biomech. 2012;45:647–652. doi: 10.1016/j.jbiomech.2011.12.015. [DOI] [PMC free article] [PubMed] [Google Scholar]
- Foreman TK, Addy T, Baker S, Burns J, Hill N, Madden T. Prospective studies into the causation of hamstring injuries in sport: a systematic review. Phys Ther Sport. 2006;7:101–109. [Google Scholar]
- Friederich JA, Brand RA. Muscle-fiber architecture in the human lower-limb. J Biomech. 1990;23:91–95. doi: 10.1016/0021-9290(90)90373-b. [DOI] [PubMed] [Google Scholar]
- Garrett WE, Nikolaou PK, Ribbeck BM, Glisson RR, Seaber AV. The effect of muscle architecture on the biomechanical failure properties of skeletal muscle under passive extension. Am J Sports Med. 1988;16:7–12. doi: 10.1177/036354658801600102. [DOI] [PubMed] [Google Scholar]
- Garrett WE, Safran MR, Seaber AV, Glisson RR, Ribbeck BM. Biomechanical comparison of stimulated and nonstimulated skeletal muscle pulled to failure. Am J Sports Med. 1987;15:448–454. doi: 10.1177/036354658701500504. [DOI] [PubMed] [Google Scholar]
- Hagglund M, Walden M, Ekstrand J. Risk factors for lower extremity muscle injury in professional soccer the UEFA injury study. Am J Sports Med. 2013;41:327–335. doi: 10.1177/0363546512470634. [DOI] [PubMed] [Google Scholar]
- Handsfield GG, Meyer CH, Hart JM, Abel MF, Blemker SS. Relationships of 35 lower limb muscles to height and body mass quantified using MRI. J Biomech. 2013 doi: 10.1016/j.jbiomech.2013.12.002. (In press) [DOI] [PubMed] [Google Scholar]
- Heiderscheit BC, Hoerth DM, Chumanov ES, Swanson SC, Thelen BJ, Thelen DG. Identifying the time of occurrence of a hamstring strain injury during treadmill running: a case study. Clin Biomech. 2005;20:1072–1078. doi: 10.1016/j.clinbiomech.2005.07.005. [DOI] [PubMed] [Google Scholar]
- Kellis E, Galanis N, Natsis K, Kapetanos G. Muscle architecture variations along the human semitendinosus and biceps femoris (long head) length. (Official Journal of the International Society of Electrophysiological Kinesiology) J Electromyogr Kinesiol. 2010;20:1237–1243. doi: 10.1016/j.jelekin.2010.07.012. [DOI] [PubMed] [Google Scholar]
- Kellis E, Galanis N, Kapetanos G, Natsis K. Architectural differences between the hamstring muscles. J Electromyogr Kinesiol. 2012;22:520–526. doi: 10.1016/j.jelekin.2012.03.012. [DOI] [PubMed] [Google Scholar]
- Koulouris G, Connell D. Evaluation of the hamstring muscle complex following acute injury. Skelet Radiol. 2003;32:582–589. doi: 10.1007/s00256-003-0674-5. [DOI] [PubMed] [Google Scholar]
- Lee SSM, Piazza SJ. Built for speed: musculoskeletal structure and sprinting ability. J Exp Biol. 2009;212:3700–3707. doi: 10.1242/jeb.031096. [DOI] [PubMed] [Google Scholar]
- Lieber RL, Friden J. Muscle damage is not a function of muscle force but active muscle strain. J Appl Physiol. 1993;74:520–526. doi: 10.1152/jappl.1993.74.2.520. [DOI] [PubMed] [Google Scholar]
- Lysholm J, Wiklander J. Injuries in runners. Am J Sports Med. 1987;15:168–171. doi: 10.1177/036354658701500213. [DOI] [PubMed] [Google Scholar]
- Maas S, Rawlins D, Weiss J. PostView Finite Element Post Processing. Musculoskeletal Research Laboratories. 2010 < http://mrl.sci.utah.edu/software/postview>.
- Opar DA, Williams MD, Shield AJ. Hamstring strain injuries factors that lead to injury and re-injury. Sports Med. 2012;42:209–226. doi: 10.2165/11594800-000000000-00000. [DOI] [PubMed] [Google Scholar]
- Potier TG, Alexander CM, Seynnes OR. Effects of eccentric strength training on biceps femoris muscle architecture and knee joint range of movement. Eur J Appl Physiol. 2009;105:939–944. doi: 10.1007/s00421-008-0980-7. [DOI] [PubMed] [Google Scholar]
- Puso MA, Maker BN, Ferencz RM, Hallquist JO. Nike3d: A Nonlinear, Implicit, Three-dimensional Finite Element Code for Solid and Structural Mechanics. 2002. UCRL-MA-105268. [Google Scholar]
- Rehorn MR, Blemker SS. The effects of aponeurosis geometry on strain injury susceptibility explored with a 3D muscle model. J Biomech. 2010;43:2574–2581. doi: 10.1016/j.jbiomech.2010.05.011. [DOI] [PMC free article] [PubMed] [Google Scholar]
- Rosset A, Spadola L, Ratib O. OsiriX: an open-source software for navigating in multidimensional DICOM images. J Digit Imaging. 2004;17:205–216. doi: 10.1007/s10278-004-1014-6. [DOI] [PMC free article] [PubMed] [Google Scholar]
- Sanfilippo JL, Silder A, Sherry MA, Tuite MJ, Heiderscheit BC. Hamstring strength and morphology progression after return to sport from injury. Med Sci Sports Exerc. 2013;45:448–454. doi: 10.1249/MSS.0b013e3182776eff. [DOI] [PMC free article] [PubMed] [Google Scholar]
- Schache AG, Ackland DC, Laurence F, Koulouris G, Pandy MG. Three-dimensional geometry of the human biceps femoris long head measured in vivo using magnetic resonance imaging. Clin Biomech. 2013 doi: 10.1016/j.clinbiomech.2012.12.010. (In press) [DOI] [PubMed] [Google Scholar]
- Schache AG, Wrigley TV, Baker R, Pandy MG. Biomechanical response to hamstring muscle strain injury. Gait Posture. 2009;29:332–338. doi: 10.1016/j.gaitpost.2008.10.054. [DOI] [PubMed] [Google Scholar]
- Sharafi B, Ames EG, Holmes JW, Blemker SS. Strains at the myotendinous junction predicted by a micromechanical model. J Biomech. 2011;44:2795–2801. doi: 10.1016/j.jbiomech.2011.08.025. [DOI] [PMC free article] [PubMed] [Google Scholar]
- Silder A, Heiderscheit BC, Thelen DG, Enright T, Tuite MJ. MR observations of long-term musculotendon remodeling following a hamstring strain injury. Skelet Radiol. 2008;37:1101–1109. doi: 10.1007/s00256-008-0546-0. [DOI] [PMC free article] [PubMed] [Google Scholar]
- Silder A, Reeder SB, Thelen DG. The influence of prior hamstring injury on lengthening muscle tissue mechanics. J Biomech. 2010;43:2254–2260. doi: 10.1016/j.jbiomech.2010.02.038. [DOI] [PMC free article] [PubMed] [Google Scholar]
- Ward SR, Eng CM, Smallwood LH, Lieber RL. Are current measurements of lower extremity muscle architecture accurate? Clin Orthop Relat Res. 2009;467:1074–1082. doi: 10.1007/s11999-008-0594-8. [DOI] [PMC free article] [PubMed] [Google Scholar]
- Weiss JA, Maker BN, Govindjee S. Finite element implementation of incompressible, transversely isotropic hyperelasticity. Comput Meth Appl Mech Eng. 1996;135:107–128. [Google Scholar]
- Wickiewicz TL, Roy RR, Powell PL, Edgerton VR. Muscle architecture of the human lower-limb. Clin Orthop Relat Res. 1983:275–283. [PubMed] [Google Scholar]
- Woodley SJ, Mercer S. Hamstring muscles: architecture and innervation. Cells Tissues Organs. 2005;179:125–141. doi: 10.1159/000085004. [DOI] [PubMed] [Google Scholar]
- Zvijac JE, Toriscelli TA, Merrick S, Kiebzak GM. Isokinetic concentric quadriceps and hamstring strength variables from the NFL Scouting Combine are not predictive of hamstring injury in first-year professional football players. Am J Sports Med. 2013;41:1511–1518. doi: 10.1177/0363546513487983. [DOI] [PubMed] [Google Scholar]