Abstract
Purpose
Obesity may be associated with lower prostate-specific antigen (PSA) through hemodilution. We examined the relationship between body mass index (BMI) and PSA by age in men without prostate cancer from a longitudinal aging study to determine whether PSA needs to be adjusted for BMI.
Materials and Methods
The study population included 994 men (4937 observations) without prostate cancer in the Baltimore Longitudinal Study of Aging. Mixed effects models were used to examine the relationship between PSA and BMI (kg/m2) by age. Separate models were explored in men with prostate cancer censored at diagnosis, for percent body fat measurements, for weight changes with time, and adjusting for initial prostate size in 483 men (2523 observations) with pelvic MRI measurements.
Results
In men without prostate cancer, BMI was not significantly associated with PSA after adjusting for age (p=0.06). A 10 point BMI increase was associated with a PSA difference of −0.03 ng/ml (95% CI, −0.40–0.49). Results were similar when men with prostate cancer were included, when percent body fat was substituted for BMI, and after adjusting for prostate volume. Longitudinal weight changes also had no significant association with PSA.
Conclusions
Consistent with prior studies, we found an inverse relationship between obesity and serum PSA levels. However, the magnitude of the difference was small. Thus, adjusting PSA for BMI does not appear warranted.
Keywords: PSA, prostate cancer, BMI, obesity, hemodilution
INTRODUCTION
Prostate cancer and obesity are prevalent conditions among the aging male population. Data from the National Health and Nutrition Examination Survey indicated that in 2001–2002, 65.7% of U.S. adults were overweight or obese, defined as a body mass index (BMI) of 25.0–29.9, and ≥30 kg/m2, respectively.1 Among men aged ≥60 years, 73.9% had a BMI ≥ 25 kg/m2. Also, approximately 1 in 6 men will be diagnosed with prostate cancer during his lifetime.2 Numerous groups have investigated the relationship between obesity and prostate cancer, and several studies have demonstrated a significant relationship of increased BMI with more aggressive pathological features and worse treatment outcomes.3, 4
A growing body of evidence suggests that obese men may have lower serum prostate-specific antigen (PSA) levels. This pattern was reported in population-based studies of men without prostate cancer5 and in prostate cancer patients.6
A proposed mechanism for the relationship between obesity with a lower PSA is through hemodilution. Specifically, Baňez et al. reported that among men undergoing prostatectomy at multiple institutions, the adjusted mean PSA concentration significantly decreased with increasing BMI category (p≤0.02 for all).6 Alternatively, obesity may affect PSA through endocrine changes, such as its association with lower serum testosterone levels.7
If obesity does indeed lead to a clinically significant reduction in PSA, this would suggest that perhaps the thresholds used in daily clinical practice should be adjusted based upon BMI.8 By contrast, if the difference is not of sufficient magnitude, no adjustment would be necessary.
We further examined the association between BMI and PSA levels in men with and without prostate cancer in an aging study. Also, due to the longitudinal nature of our study, we sought to characterize the relationship between weight changes over time with serum PSA, and to correct for prostate volume in a subset of men.
MATERIALS AND METHODS
Study Cohort
The Baltimore Longitudinal Study of Aging (BLSA) is a prospective cohort study initiated in 1958 by the National Institute on Aging. Details of the study protocol have been previously described.9 Briefly, participants undergo comprehensive medical examinations at two year intervals. The study was approved by the Med Star Institutional Review Boards and the Institutional Review Boards of the Johns Hopkins Medical Institutions, and written informed consent was provided by all participants.
Each participant visit included a measurement of height and weight by a nurse or technician, from which body mass index (BMI) was calculated in kg/m2. For participant visits before 1991, PSA levels were retrospectively measured using frozen serum samples stored at −70°C. Beginning in 1991, PSA and DRE were also performed at each visit for male participants for prostate cancer screening. The Tandem-R assay (Hybritech Inc., CA) was used for all PSA measurements. Prostate biopsy was recommended for a PSA level >4 ng/ml or suspicious DRE findings. PSA kinetics were not used as a trigger for biopsy.
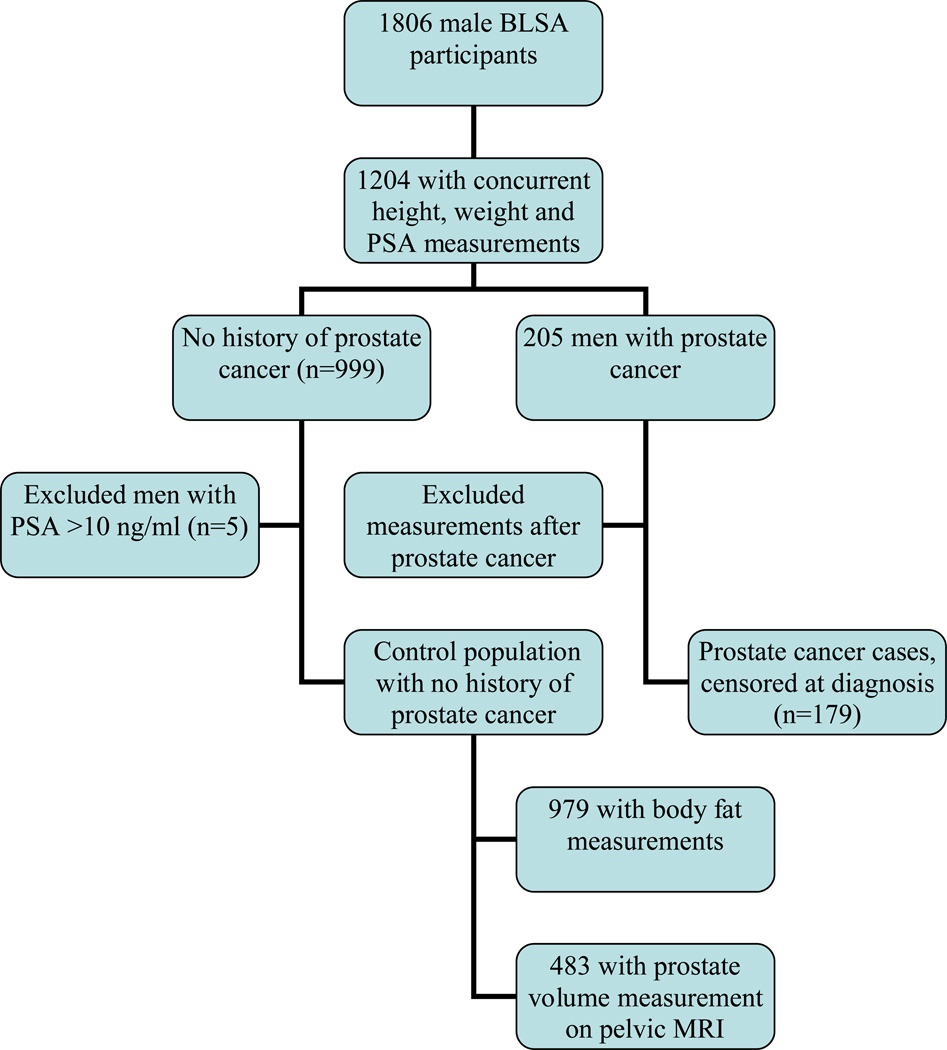
Figure 1 shows the selection of the study population. First we identified all male BLSA participants with concurrent PSA, height and weight measurements, including 999 men with no history of prostate cancer. After excluding men with a PSA level >10 ng/ml (due to the relatively high likelihood of undiagnosed prostate cancer increasing the potential for misclassification), the final control population included 994 men with a total of 4937 observations. The mean number of BMI measurements per subject was 4.96 (range, 1 to 18).
Figure 1.
Consort diagram of cohort selection.
In a subset of 979 BLSA participants (4610 observations), anthropometric measurements were also available. To examine an alternate metric for adiposity, the body fat mass (in kilograms) was calculated as follows: 0.39 (weight (kg) −0.13 height (cm) + 0.74 sagittal/waist diameter (cm) + 4.81 ln triceps skinfold thickness (cm) − 3.78.10 Calculations based upon this formula have previously been shown to correlate well (r=0.93) with estimates from dual x-ray absorptiometry.10
Concurrent PSA and BMI measurements were also available for 205 men diagnosed with prostate cancer. We excluded measurements after diagnosis, leaving 179 men with height, weight, and PSA measurements prior to a prostate cancer diagnosis.
Prostate Volume Measurement
Beginning in 1993, pelvic magnetic resonance imaging (MRI) was performed in men without prostate cancer to further examine the association of aging and prostate growth. Prostate volume was measured from the T2 axial images using a semi-automated image analysis system, as previously described.11 In the current study population, a subset of 483 men (2523 observations) also had a prostate volume measurement from MRI.
Testosterone Measurements
Sex hormone data was available for 713 men (2771 observations) from the current study population. These levels were measured between 7:00 and 9:30 a.m. following an overnight fast, as previously described.12 We then calculated the free testosterone index as the molar ratio of testosterone to sex hormone binding globulin.
Plasma volume calculation
Direct plasma volume measurements were not available in the BLSA. Accordingly, plasma volume (PV) was estimated indirectly based on the following formula13: PV (L) = body surface area (BSA) × 1.670, wherein BSA (m2) = body weight (kg) 0.425 × height (m) 0.725 × 0.2025. We also examined the interrelationship among PSA, BMI, and hematocrit as a potential alternate surrogate for intravascular volume.
Statistical Analysis
First, mixed effects models were used to examine the regression of PSA on BMI while controlling for initial age, time from the initial evaluation and date of evaluation. Mixed effects models are flexible models that can be used to deal with multiple data collected from individuals, as seen with longitudinal and repeated measures14. All models had the following form: Log(Yij +1)= (β0+bj0)+ β1*initial agej+( β2+ bj2 )*time from initial.ageij +(β3+bj3)*BMI + + β4*dateij+ eij with Yij being PSA for the ith evaluation and jth subject and bj0 , bj2, and bj3 being the random effects for the intercept, slope over time and slope for BMI for subject j.
In addition, in some models fixed terms were added for interactions between BMI with initial age, and BMI with time from initial age. Models were compared sequentially with the addition of terms to a baseline model containing initial age, time from initial age and date with the random intercept using likelihood ratio tests. Similar models were developed for the body fat measure. Another mixed effects model was used to examine the association between PSA and plasma volume. In addition, separate mixed effects models were performed with adjustment for initial prostate size in the subset of participants with prostate volume measurements on MRI, and adjusting for testosterone in the subset with sex hormone data.
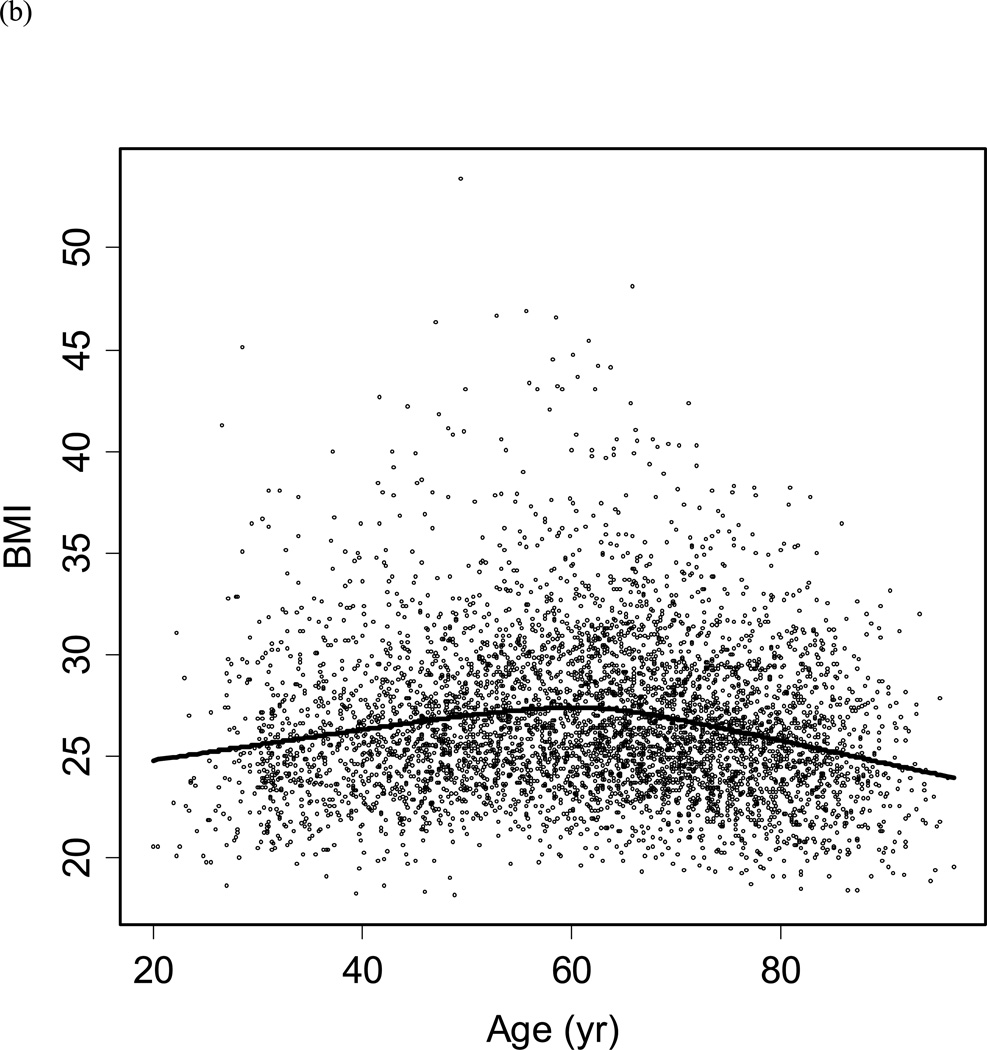
Finally, we examined the association between PSA with weight changes over time for participants with at least 2 concurrent PSA and weight measurements. For these models, we first plotted BMI versus age. Based upon this distribution, we divided the population into men aged <60 years and ≥60 years. Within these groups, mixed effects models were used to examine the association between changes in PSA (ng/ml/year) with changes in weight (kg/year) with random effects for subject and time. Separate mixed effects models were used to examine the relationship between PSA changes with longitudinal changes in BMI in the overall population adjusting for age and age squared. Similar models were also used to examine the relationship between longitudinal PSA measurements with changes in percent body fat and plasma volume. All statistical models were tested using the package lme4 in R (R. Development CoreTeam, http://www.R-project.org, version 2.9.0).
RESULTS
Table 1 shows the demographics of the primary study population (n=994), including the men without prostate cancer.
Table 1.
Demographics of the cancer-free study population (n=994) at the initial visit. (SD= standard deviation)
| Mean (SD) | Median (Range) | |
|---|---|---|
| Age (years) | 52.0 (16.3) | 51.4 (19.9–92.0) |
| Weight (kg) | 81.7 (13.0) | 80.1 (49.8–152.1) |
| Height (m) | 176.5 (7.0) | 176.3 (151.2–197.6) |
| BMI (kg/m2) | 26.2 (3.6) | 25.6 (18.2–43.0) |
| PSA (ng/ml) | 1.2 (1.3) | 0.7 (0–9.0) |
| # Observations per subject | 5.0 (3.3) | 4 (1–18) |
Relationship between PSA with BMI, Plasma Volume, and Hematocrit
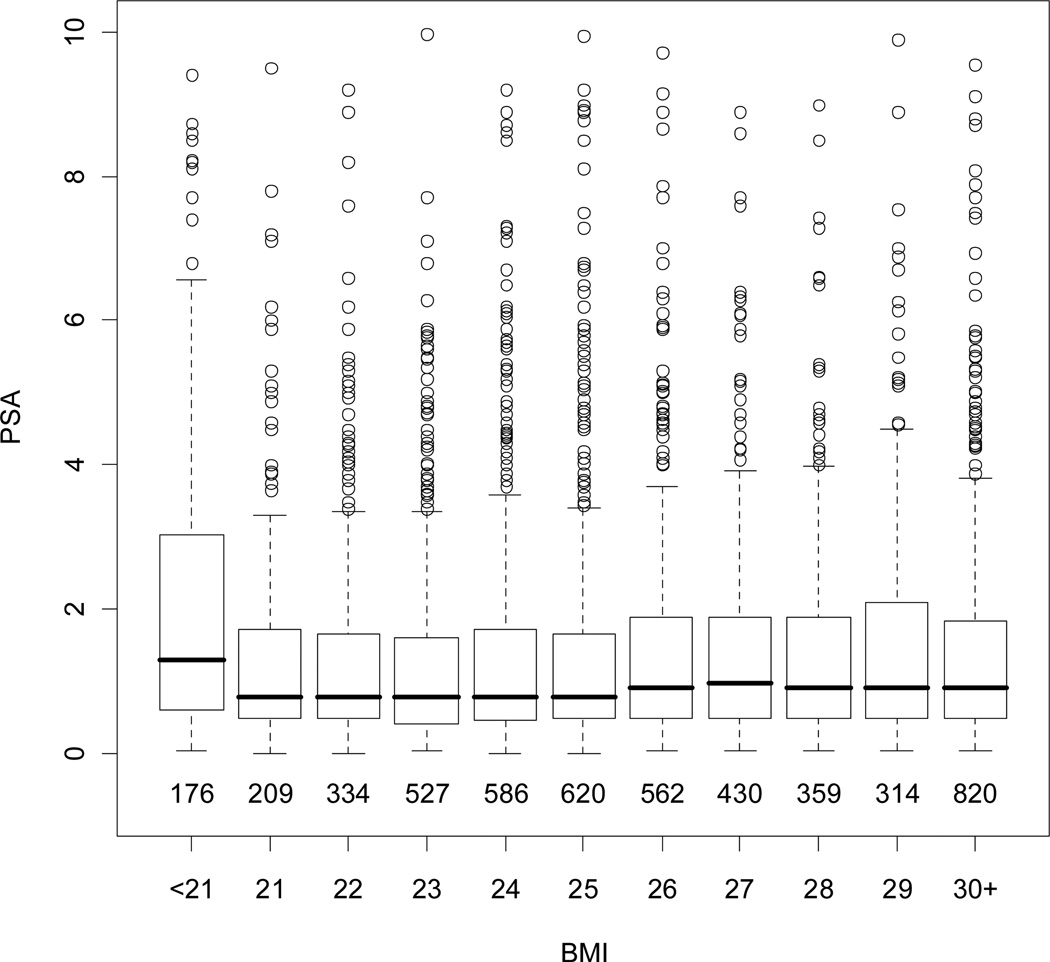
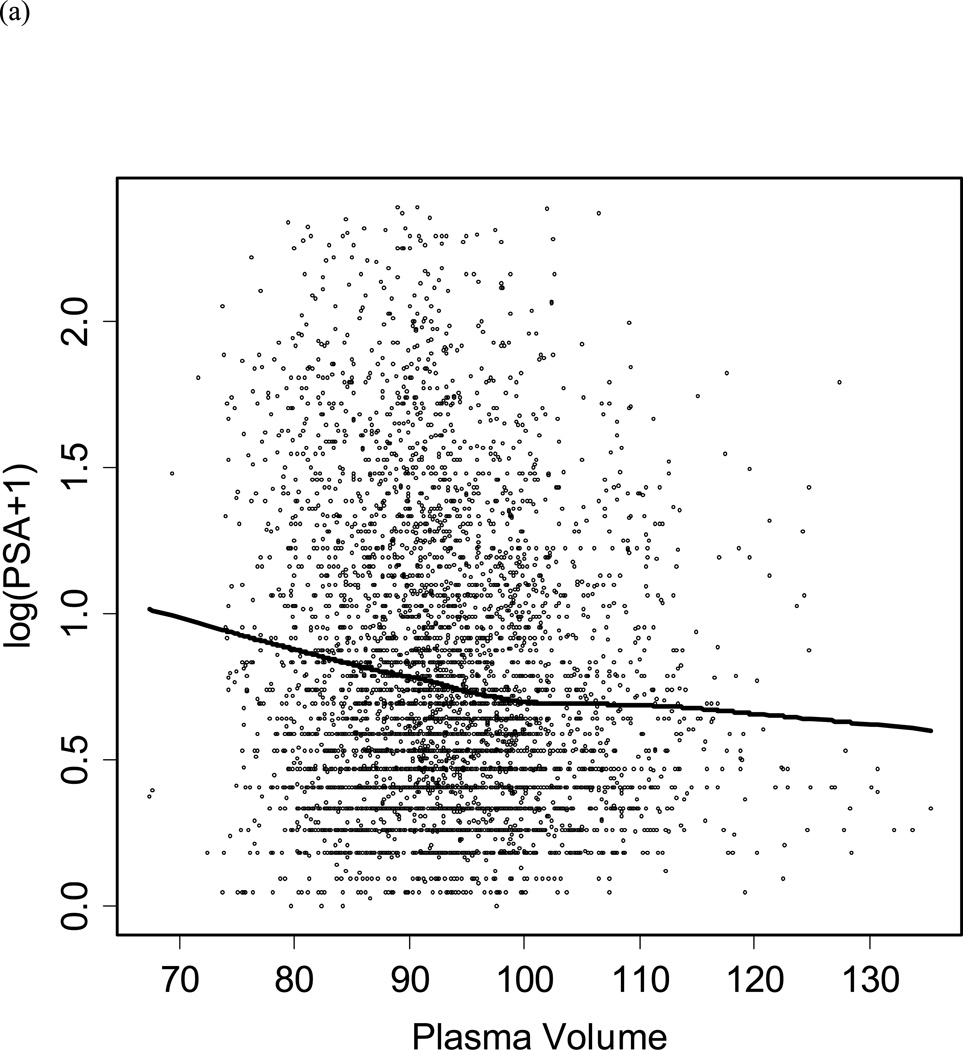
Figure 2 shows the relationship between BMI and PSA in healthy controls. Overall, BMI was not significantly associated with PSA after adjusting for age (p=0.06) within an individual over time. Based on our model, a 10 point increase in BMI would be associated with a decrease in PSA of −0.03 ng/ml (95%, CI −0.40 to 0.49). A model including PSA measurements from 179 men diagnosed with prostate cancer had similar results (data not shown). As shown in Figure 3a, there was a significant inverse relationship between PSA and plasma volume in controls (p=0.01). However, there was no significant relationship between age adjusted PSA and hematocrit. Adding hematocrit to the model did not affect the relationship between PSA and BMI, but when plasma volume plus hematocrit were included in the model the relationship between PSA and BMI was diminished (data not shown).
Figure 2.
Distribution of PSA by BMI among men without prostate cancer. Boxes represent interquartile range (IQR: 25th–75th percentiles) with the horizontal line indicating the median. The dashed vertical line represents 1.5 times the IQR and the circles represent outliers >1.5 times the IQR. The numbers below boxes represent the number of observations within each BMI grouping.
Figure 3.
Scatter plot of (a) log PSA by plasma volume, and (b) BMI by participant age. The line represents the Loess curve.
Relationship between PSA and Percent Body Fat
Next we performed mixed effects models using percent body fat rather than BMI as the measure for adiposity. Although percent body fat was significantly associated with PSA after adjusting for age in men without prostate cancer (p=0.000059), the magnitude of this effect was also modest. Per each 1% increase in percent body fat, the associated change in PSA was −0.0046 ng/ml. After considering the random effect for percent body fat, the PSA was 0.0044 ng/ml lower per percent increase in body fat (p=0.003).
Relationship between PSA and BMI considering prostate volume
Among the men with pelvic MRI measurements, the mean initial prostate volume was 32.6 ± 19.1. In this subset, there was no significant relationship between BMI and PSA by initial age and time, either before (p=0.61) or after (p=0.42) adjustment for prostate volume. The addition of an interaction term between body size and prostate volume did not improve the relationship (p=0.62). As expected, prostate volume was significantly related to PSA (p<0.0001) and remained significant when adjusted for BMI (p<0.0001).
Relationship between PSA and BMI considering testosterone
Among men with sex hormone measurements, the mean testosterone was 425 ± 104 ng/dl, and the mean free testosterone index was 6.2 ± 3.2 across all observations. In this subgroup, a significant relationship was observed between PSA and BMI (coefficient −0.011, t=−3.75, p=0.0002) when adjusted for initial age and time. With the addition of testosterone and free testosterone index to the model, the coefficient for BMI was −0.010 (t= −3.10).
Relationship between changes in PSA with changes in BMI, percent body fat, and plasma volume
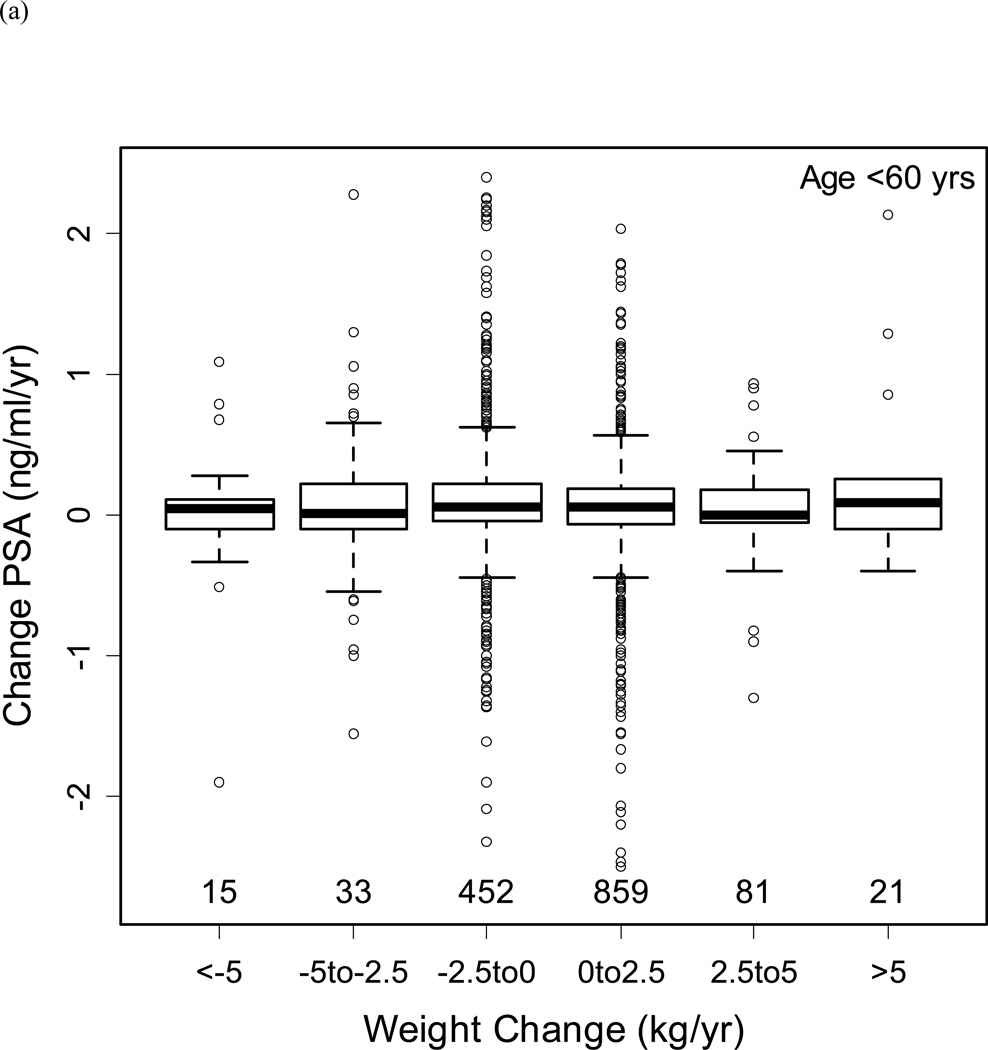
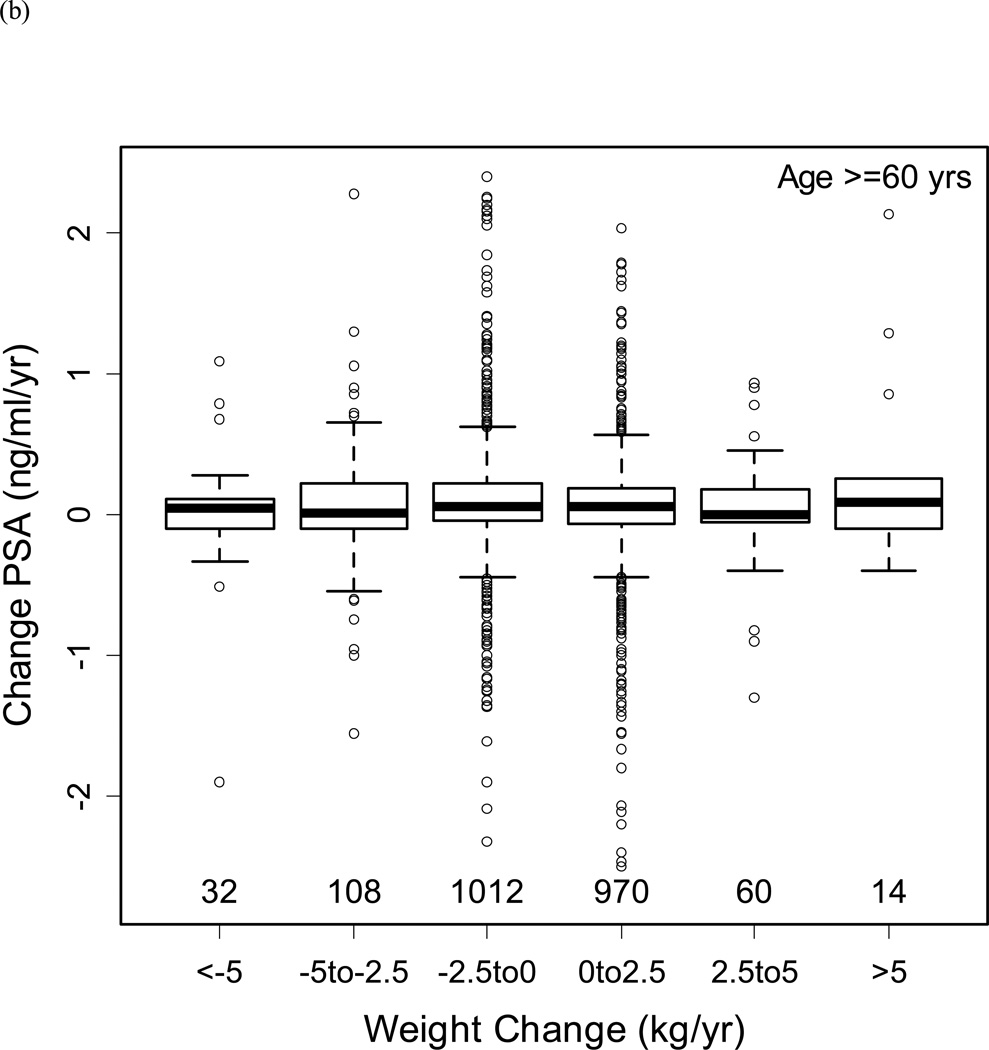
Figure 3b shows the distribution of BMI by age in men without prostate cancer. Based upon this distribution, the population was classified into men aged <60 and ≥60 years to examine the relationship between changes in BMI with changes in PSA (Figures 4a/b). Despite substantial variability in weight changes (with some participants gaining or losing more than 5 kg/year), there was no significant relationship with PSA changes in men aged <60 or ≥60 years.
Figure 4.
Changes in PSA by weight changes (a) for men below age 60 years, and (b) for men age 60 years and above. The boxes represent IQR, with the horizontal line within the box indicating the median. The vertical dashed lines represent 1.5 times the IQR, and circles represent outliers >1.5 times the IQR. Numbers above the x-axis represent the number of observations in each weight change category.
In the overall population, adjusting for age and age squared, changes in BMI had a marginally significant relationship with changes in PSA (coefficient −0.008, p=0.046). Similarly, changes in percent body fat were significantly associated with changes in PSA adjusting for age (coefficient −0.013, p=0.005). However, we did not find a significant association between plasma volume changes and PSA changes over time (coefficient −0.011, p=0.13).
DISCUSSION
Numerous prior studies have examined the relationship between PSA and BMI.5, 6, 15, 16 For example, Baillargeon et al. reported a significant inverse association between PSA and BMI in men from the San Antonio Center for Biomarkers of Risk (SABOR) for prostate cancer study.5 After adjustment for age and race, the mean PSA levels were 1.01, 0.95, 0.91, 0.81, and 0.69 ng/ml for men with a BMI <24.9, 25.0–29.9, 30.0–34.9, 35.0–39.9, and ≥40, respectively (p<0.0001).
Similar results were reported in men from the placebo group of the Prostate Cancer Prevention Trial.15 Specifically, Kristal et al. reported on 3441 men with no evidence of prostate cancer on empiric biopsies performed at the end of the 7 year study. The PSA level was approximately 0.21 ng/ml lower among participants with a BMI ≥35 compared to normal weight men (BMI <25 kg/cm2).
More recently, Bañez et al. reported significantly lower PSA levels in obese men, despite a similar mean adjusted PSA mass.6 Based on these results, they suggested that hemodilution may account for the consistent findings of a lower PSA level with increasing adiposity. Indeed, numerous studies have demonstrated higher intravascular volume in obese individuals, substantiating the biological plausibility of this observation.17
Finally, Chia et al. recently examined the association between BMI and PSA in Chinese male participants in Singapore Prostate Awareness Week.16 Among men with a BMI <18.5, 18.5–24.9, 25–29.9, and ≥30, the median PSA levels were 1.02, 1.01, 0.91, and 0.82 ng/ml.
In the current study, we similarly found a significant inverse relationship between PSA with percent body fat, and a trend toward lower PSA with increasing BMI (p=0.06). Moreover, as in the study by Bañez and colleagues6, we found a significant decrease in PSA with increasing plasma volume.
The notion of a lower PSA with increasing BMI has generated considerable interest in the urological community, in light of numerous studies demonstrating more aggressive prostate cancer in obese men.3, 4 Specifically, there is concern that lower PSA levels from obesity-related hemodilution may lead to ascertainment bias, whereby obese men are diagnosed with prostate cancer at a later stage with correspondingly worse outcomes.5 Accordingly, some groups have suggested investigation into the use of BMI-adjusted PSA cutpoints.8
However, statistical significance does not always translate into clinical significance. Indeed, the magnitude of the difference in PSA level with increasing BMI was small in our study. A substantial 10 point increase in BMI was associated with a PSA reduction of only 0.03 ng/ml in the current study. Similarly, each 1% increase in body fat was associated with a decrease in PSA of 0.004 ng/ml. Consistent with the conclusions of another study by Hutterer et al.18, these results suggest that adjustment of PSA for BMI may not be warranted.
A limitation of our study is that measurements of PSA, BMI, percent body fat, testosterone and prostate size were only available for a proportion of BLSA participants. A second limitation is that direct measurements of plasma volume were not performed in the BLSA. Although prior studies have estimated plasma volume based upon the body surface area, these methods of calculation may not be accurate particularly in obese men.19 As an alternate indicator of volume status, we also used models including hematocrit. Nevertheless, similar to others we could not directly address the true relationship between PSA and plasma volume directly.6 Another limitation is that the majority of BLSA participants were Caucasian. However, the SABOR study involving a multi-ethnic population-based sample did not find any evidence of effect modification by race (p=0.73) on the association between PSA and BMI.5
An important strength of our study is that height and weight were directly measured at participant visits, rather than relying upon self-reported data. Estimates based upon self-report tend to overestimate height and underestimate weight.20 In addition, percent body fat was available in the majority of participants, enabling an assessment of the relationship between PSA with other measurements of adiposity. Finally, due to the longitudinal nature of the BLSA, serial measurements of height, weight, and PSA were available for many participants, allowing us to examine changes over time.
CONCLUSIONS
Percent body fat had a significant inverse relationship with the serum PSA concentration and a trend toward decreasing PSA with increasing BMI, possibly related to hemodilution. Nevertheless, the magnitude of the PSA reduction is small, suggesting that adiposity-adjusted PSA thresholds are not warranted.
Acknowledgments
This research was supported by the Intramural Research Program of the National Institute of Health, National Institute on Aging.
REFERENCES
- 1.Hedley AA, Ogden CL, Johnson CL, Carroll MD, Curtin LR, Flegal KM. Prevalence of overweight and obesity among US children, adolescents, and adults, 1999–2002. Jama. 2004;291:2847. doi: 10.1001/jama.291.23.2847. [DOI] [PubMed] [Google Scholar]
- 2.American Cancer Society. [Accessed March 5, 2008];Cancer Facts and Figures. 2008 http://www.cancer.org/downloads/STT/2008CAFFfinalsecured.pdf.
- 3.Freedland SJ, Grubb KA, Yiu SK, Humphreys EB, Nielsen ME, Mangold LA, et al. Obesity and risk of biochemical progression following radical prostatectomy at a tertiary care referral center. J Urol. 2005;174:919. doi: 10.1097/01.ju.0000169459.78982.d7. [DOI] [PubMed] [Google Scholar]
- 4.Freedland SJ, Aronson WJ, Kane CJ, Presti JC, Jr, Amling CL, Elashoff D, et al. Impact of obesity on biochemical control after radical prostatectomy for clinically localized prostate cancer: a report by the Shared Equal Access Regional Cancer Hospital database study group. J Clin Oncol. 2004;22:446. doi: 10.1200/JCO.2004.04.181. [DOI] [PubMed] [Google Scholar]
- 5.Baillargeon J, Pollock BH, Kristal AR, Bradshaw P, Hernandez J, Basler J, et al. The association of body mass index and prostate-specific antigen in a population-based study. Cancer. 2005;103:1092. doi: 10.1002/cncr.20856. [DOI] [PubMed] [Google Scholar]
- 6.Banez LL, Hamilton RJ, Partin AW, Vollmer RT, Sun L, Rodriguez C, et al. Obesity-related plasma hemodilution and PSA concentration among men with prostate cancer. JAMA. 2007;298:2275. doi: 10.1001/jama.298.19.2275. [DOI] [PubMed] [Google Scholar]
- 7.Stanworth RD, Jones TH. Testosterone in obesity, metabolic syndrome and type 2 diabetes. Front Horm Res. 2009;37:74. doi: 10.1159/000176046. [DOI] [PubMed] [Google Scholar]
- 8.Barqawi AB, Golden BK, O'Donnell C, Brawer MK, Crawford ED. Observed effect of age and body mass index on total and complexed PSA: analysis from a national screening program. Urology. 2005;65:708. doi: 10.1016/j.urology.2004.10.074. [DOI] [PubMed] [Google Scholar]
- 9.Carter HB, Ferrucci L, Kettermann A, Landis P, Wright EJ, Epstein JI, et al. Detection of life-threatening prostate cancer with prostate-specific antigen velocity during a window of curability. J Natl Cancer Inst. 2006;98:1521. doi: 10.1093/jnci/djj410. [DOI] [PMC free article] [PubMed] [Google Scholar]
- 10.Fleg JL, Morrell CH, Bos AG, Brant LJ, Talbot LA, Wright JG, et al. Accelerated longitudinal decline of aerobic capacity in healthy older adults. Circulation. 2005;112:674. doi: 10.1161/CIRCULATIONAHA.105.545459. [DOI] [PubMed] [Google Scholar]
- 11.Williams AM, Simon I, Landis PK, Moser C, Christens-Barry W, Carter HB, et al. Prostatic growth rate determined from MRI data: age-related longitudinal changes. J Androl. 1999;20:474. [PubMed] [Google Scholar]
- 12.Parsons JK, Carter HB, Platz EA, Wright EJ, Landis P, Metter EJ. Serum testosterone and the risk of prostate cancer: potential implications for testosterone therapy. Cancer Epidemiol Biomarkers Prev. 2005;14:2257. doi: 10.1158/1055-9965.EPI-04-0715. [DOI] [PubMed] [Google Scholar]
- 13.Boer P. Estimated lean body mass as an index for normalization of body fluid volumes in humans. Am J Physiol. 1984;247:F632. doi: 10.1152/ajprenal.1984.247.4.F632. [DOI] [PubMed] [Google Scholar]
- 14.Pinheiro JC, Bates DM. Mixed-effects models in S and S-PLUS. New York: Springer; 2000. pp. 206–225. [Google Scholar]
- 15.Kristal AR, Chi C, Tangen CM, Goodman PJ, Etzioni R, Thompson IM. Associations of demographic and lifestyle characteristics with prostate-specific antigen (PSA) concentration and rate of PSA increase. Cancer. 2006;106:320. doi: 10.1002/cncr.21603. [DOI] [PubMed] [Google Scholar]
- 16.Chia SE, Lau WK, Chin CM, Tan J, Ho SH, Lee J, et al. Effect of ageing and body mass index on prostate-specific antigen levels among Chinese men in Singapore from a community-based study. BJU Int. 2008 doi: 10.1111/j.1464-410X.2008.08246.x. [DOI] [PubMed] [Google Scholar]
- 17.Thakur V, Richards R, Reisin E. Obesity, hypertension, and the heart. Am J Med Sci. 2001;321:242. doi: 10.1097/00000441-200104000-00005. [DOI] [PubMed] [Google Scholar]
- 18.Hutterer G, Perrotte P, Gallina A, Walz J, Jeldres C, Traumann M, et al. Body mass index does not predict prostate-specific antigen or percent free prostate-specific antigen in men undergoing prostate cancer screening. Eur J Cancer. 2007;43:1180. doi: 10.1016/j.ejca.2007.01.005. [DOI] [PubMed] [Google Scholar]
- 19.Sivanandam A, Siva S, Bhandari M, Menon M. Variance inflation in sequential calculations of body surface area, plasma volume, and prostate-specific antigen mass. BJU Int. 2008;102:1573. doi: 10.1111/j.1464-410X.2008.07883.x. [DOI] [PubMed] [Google Scholar]
- 20.Gorber SC, Tremblay M, Moher D, Gorber B. A comparison of direct vs. self-report measures for assessing height, weight and body mass index: a systematic review. Obes Rev. 2007;8:307. doi: 10.1111/j.1467-789X.2007.00347.x. [DOI] [PubMed] [Google Scholar]


