

Abstract
Background/Objectives
To determine if abdominal adipose tissue (AT) measurement site influences the association between baseline and change in abdominal subcutaneous (ASAT) and visceral adipose tissue (VAT), and metabolic risk factors in obese adolescents.
Methods
Fifty-five obese adolescents (14.9 ± 1.7 years; 51% male; 42% white) participated in an aerobic or resistance exercise intervention 3 times/week for 3 months. We compared the association between changes in abdominal AT area (spanning 5 cm below to 15 cm above L4–L5) and volume measured by magnetic resonance imaging with concomitant changes in metabolic risk.
Results
All AT areas were significantly (P<0.05) correlated with the respective volume at baseline and follow-up. Baseline VAT areas at 5 and 10 cm above L4–L5 were more strongly associated with VAT volume than VAT area at L4–L5 (P<0.05). After the intervention, changes in the area at 5 and 10 cm above L4–L5 were more strongly associated with changes in AT volumes than changes in L4–L5 (P<0.05). Changes in abdominal AT volumes were more strongly associated with insulin area under the curve than any single-slice abdominal AT area.
Conclusions
The measurement site for abdominal AT has significant influence on the relationships with total VAT or ASAT and metabolic risk factors in obese adolescents before and after an exercise intervention.
Keywords: adolescent, magnetic resonance imaging, abdominal fat, insulin, waist
INTRODUCTION
Magnetic resonance imaging (MRI) is considered the gold standard for measuring abdominal subcutaneous adipose tissue (ASAT) and visceral adipose tissue (VAT). Due to the high cost of using MRI, traditionally a single slice image at L4–L5 is often used as a surrogate measure of abdominal adipose tissue (AT) as opposed to the whole AT volume. However, in adults there is speculation as to whether the area at L4–L5 is indeed the single-slice MR image that is most predictive of AT volume and metabolic health risk (1–3), and changes in AT volume following weight loss (4, 5). Although there are a paucity of studies that have explored this association in youth, preliminary evidence suggests that the measurement site for VAT has a significant impact on the estimation of total VAT and its association with the metabolic syndrome in youth (6). No studies have attempted to determine which abdominal area is most predictive of changes in ASAT and VAT in obese youth following an exercise intervention. Therefore the purpose of this study was to determine if measurement site of abdominal AT influences the associations between VAT and ASAT, waist circumference (WC) and metabolic risk factors and changes therein following exercise intervention in obese adolescents.
METHODS
Subjects
Subjects consisted of 28 obese boys (14 blacks, 14 whites) (7) and 27 girls (18 blacks, 9 whites) (8), who participated in an exercise intervention (without calorie restriction) and who had complete baseline and follow-up for whole-body MRI. The MRI data has been previously published (7, 8). Participants were recruited from November, 2007 through October, 2012 via flyers posted near public transportation, posters placed on the University of Pittsburgh campus, as well as the Weight Management and Wellness Center at Children’s Hospital of Pittsburgh (CHP). Inclusion criteria required that the subjects be 12–18 years of age, obese BMI ≥ 95th percentile (9), pubertal Tanner Stages III-V (10), non-smokers, non-diabetic, and physically inactive (e.g., no participation in structured physical activity for the past three months except school physical education classes). Exclusion criteria included participation in structured exercise outside of physical education classes, recent significant weight change (BMI >2–3 kg/m2), endocrine disorders, syndromic obesity, psychiatric disorders and use of chronic medications that influence glucose metabolism and body composition. Girls with oral or injectable contraceptives were excluded. Participants self-identified as black or white. All participants underwent a complete physical examination by a certified nurse practitioner and routine haematological and biochemical tests at the Pediatric Clinical and Translational Research Center (PCTRC). The investigation was approved by the University of Pittsburgh Institutional Review Board. Parental informed consent and child assent were obtained from all participants before participation.
Exercise regimen
A detailed description of the exercise programs was reported previously (7, 8). Briefly, subjects in the aerobic exercise group exercised three times per week (60 minutes/session) using treadmills, ellipticals or stationary bikes at a target training intensity of 50%–75% of VO2peak. Subjects in the resistance group performed a series of 10 whole body exercises, three times per week, for 60 minutes/session. The resistance training program included 1–2 sets (8–12 repetitions) of leg press, leg extension, leg flexion, chest press, latissimus pull down, seated row, biceps curl and triceps extension using weight machines. In addition, a single set of push-ups and sit-ups were performed. All exercise sessions were by appointment and supervised by trained personnel. Exercise attendance was ≥95% for both aerobic and resistance exercise groups in boys and girls.
Anthropometric measurements
Body weight and height were measured to the nearest 0.1 kg and 0.1 cm. WC was measured at the last rib and the average of two measurements was used in the analyses.
Oral glucose tolerance test
Participants reported to the PCTRC after an overnight fast (approximately 10 hours) for a 2-hour oral glucose tolerance test (OGTT, 1.75 g/kg, max 75 g). Blood samples were obtained at −15, 0, 15, 30, 60, 90 and 120 minutes for determination of glucose and insulin levels. Glucose and insulin area under the curve (AUC) was determined using a trapezoid model (11).
MRI
Whole-body MRI data was obtained with a 3.0 Tesla MR scanner (Siemens, Magnetom TIM Trio) to quantify total adipose tissue (AT) and visceral and abdominal subcutaneous AT as reported previously (7, 8). Using the L4–L5 as the point of origin, transverse images (10 mm image thickness) were obtained every 40 mm from hand to foot. Abdominal AT was quantified using five axial images (10 mm thickness) extending from 5 cm below to 15 cm above L4–L5 (e.g., L4–L5−5 cm, L4–L5, L4–L5+5 cm, L4–L5+10 cm, L4–L5+15 cm) as shown previously (6). Once acquired, the MRI data were transferred electronically to a stand-alone computer for analysis using specially designed image analysis software (Tomovision, Montreal, Canada), the procedures for which are fully described elsewhere (12). The volume (cm3) of VAT and ASAT for each image was calculated by multiplying the VAT or ASAT tissue area (cm2) by the slice thickness (10 mm). The volume of VAT and ASAT for the space (40 mm) between two consecutive images was calculated by using a mathematical algorithm given elsewhere (12). Adipose tissue volume was converted to mass units (kg) by multiplying the volumes by the assumed constant density for adipose tissue (0.92 kg/L) (13).
Statistical Analyses
We did not include adolescents who were in the non-exercising control group in our analyses as we sought to determine the relationships between changes in abdominal AT area and volume with changes in WC and metabolic risk in response to exercise intervention. Alpha was considered statistically significant at P<0.05. Differences in subject characteristics between pre and post intervention were assessed with paired t-tests. There were no significant interactions between abdominal areas and sex or ethnicity (P>0.05), or between any metabolic risk factors and sex or ethnicity (P>0.05), so the analyses were conducted collapsed across sex and ethnicity. Pearson partial correlations adjusted for sex and ethnicity were performed to determine the associations at baseline and changes between: 1) AT volume and each regional area; 2) AT volume and area and WC; and 3) AT volume and area and the metabolic risk factors. The differences between the strength of the correlations relative to L4–L5 were assessed with Hotelling t-tests and Bonferroni adjustments were used for multiple comparisons (P<0.0124 when comparing the correlations between AT volume and each regional area, and P<0.01 when comparing the correlations between AT volume/area and waist circumference, and the correlations between AT volume/area and the metabolic risk factors). All statistical analyses were performed with SAS version 9.3.
RESULTS
Subject characteristics are presented in Table 1. There were significant decreases in BMI percentile, WC, insulin AUC, and all ASAT and VAT measures (both total volume and areas) after a 3 month exercise intervention (P<0.05).
Table 1.
Baseline and change characteristics of 55 adolescents who underwent an exercise intervention
| Characteristics | Baseline | Change | P |
|---|---|---|---|
| Age (years) | 14.9 ± 1.7 | NA | |
| Sex (% male) | 50.9 | NA | |
| Ethnicity (% white) | 41.8 | NA | |
| BMI percentile (%) | 98.7 ± 1.1 | −0.2 ± 0.5 | < 0.001 |
| Total AT (kg) | 46.1 ± 11.1 | −2.3 ± 3.0 | < 0.001 |
| Waist Circumference (cm) | 100.3 ± 10.3 | −2.2 ± 2.7 | < 0.001 |
| Fasting Glucose (mg/dl) | 88.5 ± 7.0 | 0.7 ± 6.6 | 0.26 |
| Glucose AUC (mg/dL) | 15100.6 ± 1742.1 | −242.1 ± 1592.4 | 0.26 |
| Fasting insulin (µU/mL) | 31.3 ± 17.7 | −2.3 ± 23.8 | 0.48 |
| Insulin AUC (µU/mL) | 21665.4 ± 14120.4 | −3501.1 ± 11470.3 | 0.03 |
| ASAT | |||
| Total volume (kg) | 7.4 ± 2.1 | −0.4 ± 0.6 | < 0.001 |
| −5 (cm2) | 472.2 ± 133.6 | −17.3 ± 44.9 | < 0.001 |
| L4–L5 (cm2) | 484.5 ± 145.7 | −13.8 ± 43.9 | < 0.001 |
| +5 (cm2) | 390.8 ± 115.6 | −12.1 ± 38.5 | < 0.01 |
| +10 (cm2) | 289.0 ± 98.8 | −8.4 ± 31.1 | < 0.001 |
| + 15 (cm2) | 235.3 ± 86.0 | −8.1 ± 23.8 | < 0.001 |
| VAT | |||
| Total volume (kg) | 1.3 ± 0.6 | −0.2 ± 0.2 | < 0.001 |
| −5 (cm2) | 51.8 ± 21.0 | −5.8 ± 14.4 | < 0.001 |
| L4–L5 (cm2) | 67.4 ± 25.9 | −4.4 ± 14.8 | < 0.001 |
| +5 (cm2) | 73.9 ± 32.3 | −7.4 ± 15.0 | < 0.001 |
| +10 (cm2) | 75.1 ± 40.3 | −7.5 ± 21.1 | < 0.001 |
| +15 (cm2) | 49.0 ± 32.0 | −5.5 ± 18.3 | < 0.001 |
AT = adipose tissue; AUC = area under the curve; ASAT = abdominal subcutaneous adipose tissue; VAT = visceral adipose tissue.
Association between ASAT volume and each regional ASAT area at baseline and follow-up
The relationships between ASAT volume and areas at different measurement sites before and after the intervention are shown in Figure 1A. At baseline, ASAT volume was significantly associated with each regional ASAT area (P<0.001). The association between ASAT volume and the area at L4–L5 (r = 0.98) was significantly stronger than the association with the ASAT measure at 5 cm below (r = 0.90, P<0.0001) and 15 cm above L4–L5 (r = 0.93) (P<0.0001). Change in ASAT volume in response to exercise intervention was significantly associated with changes in each regional ASAT area (P< 0.05). Specifically, change in ASAT area at L4–L5 (r = 0.73) was more weakly associated with the change in ASAT volume compared to the change in ASAT area at 5 cm (r = 0.87; P = 0.003) and 10 cm (r = 0.85; P = 0.01) above L4–L5.
Figure 1.
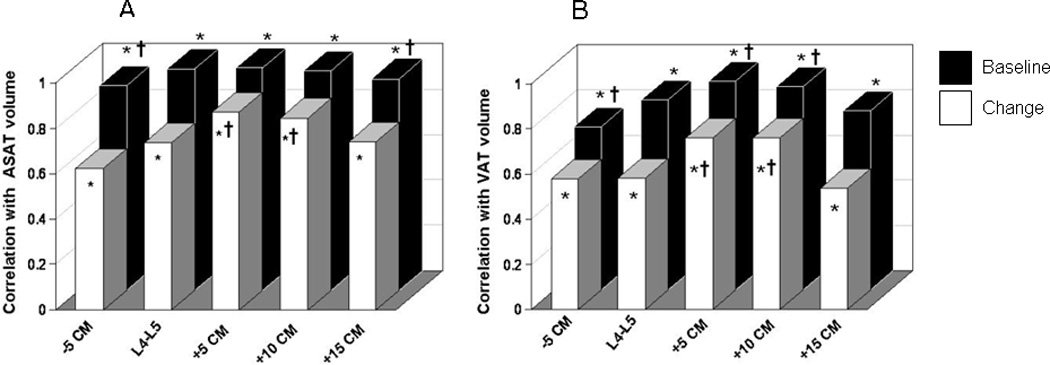
Correlations between AT volume and each regional abdominal area for A) ASAT, and B) VAT. * = significant correlation with ASAT volume (P<0.05). † = significantly different correlation with ASAT volume relative to L4–L5 (P<0.05). AT = adipose tissue; ASAT = abdominal subcutaneous adipose tissue; VAT = visceral adipose tissue.
Associations between VAT volume and each regional VAT area at baseline and follow-up
The relationships between VAT volume and areas at different measurement sites before and after the intervention are shown in Figure 1B. At baseline, VAT volume was significantly associated with each regional VAT area (P<0.001). VAT area at L4–L5 (r = 0.84) was more strongly associated with baseline VAT volume than the area at 5 cm below L4–L5 (r = 0.72; P = 0.01) and more weakly associated compared to VAT areas at 5 cm (r = 0.93; P = 0.006) and 10 cm above L4–L5 (r = 0.90; P = 0.009). Changes in VAT volume in response to the exercise intervention were significantly associated with changes in each regional VAT area (P<0.001). Change in VAT at L4–L5 (r = 0.58) was more weakly associated with the change in VAT volume compared to the change in areas at 5 cm (r = 0.85; P = 0.003) and 10 cm (r = 0.76; P = 0.01) above L4–L5.
Associations between WC and ASAT volume and area at baseline and follow-up
At baseline, WC was significantly associated with ASAT volume and each regional ASAT area (Figure 2A, P<0.05). The association between WC and ASAT area at L4–L5 (r = 0.81) was stronger than the association between WC and ASAT at 5 cm below L4–L5 (r = 0.72; P<0.01), whereas total volume (r = 0.86; P= 0.001) and the areas at 10 cm (r = 0.87; P= 0.02) and 15 cm (r = 0.87; P<0.001) above L4–L5 were more strongly associated with WC than L4–L5. Change in WC in response to the exercise intervention was associated with a significant change in ASAT volume and each ASAT area (Figure 2A, P<0.05). The strength of the correlation between WC and the area at L4–L5 did not differ from the total volume or any of the other ASAT areas (P>0.01).
Figure 2.
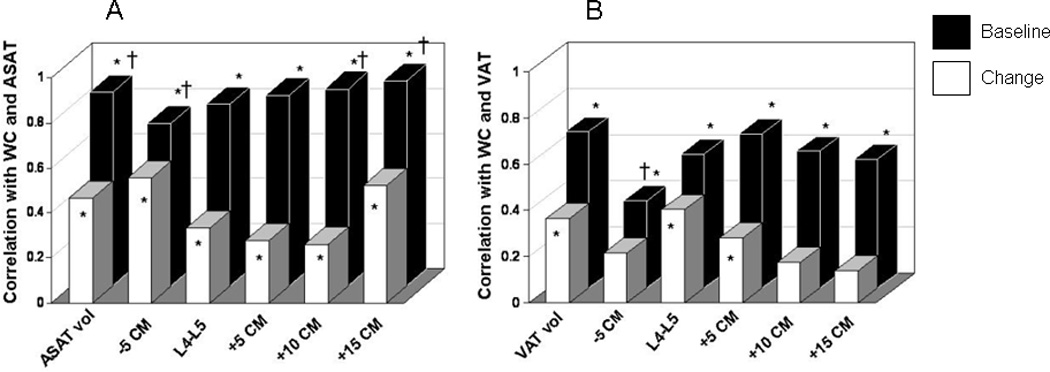
Correlations between waist circumference and AT volume and each regional abdominal area for A) ASAT and B) VAT. * = significant correlation with waist circumference (P<0.05). † = significantly different correlation with waist circumference relative to L4–L5 (P<0.05). AT = adipose tissue; ASAT = abdominal subcutaneous adipose tissue; VAT = visceral adipose tissue.
Associations between WC and VAT volume and area at baseline and follow-up
At baseline, WC was significantly associated with total VAT volume and each VAT area (Figure 2B, P<0.05). The association between WC and VAT area at L4–L5 (r = 0.58) was significantly stronger than at 5 cm below L4–L5 (r = 0.38; P = 0.006). Change in WC in response to the exercise intervention was significantly associated with the change in VAT volume (r = 0.36), area at L4–L5 (r = 0.40), and area 5 cm above L4–L5 (r = 0.28) (Figure 2B, P<0.01). The strength of the association between change in WC and change in VAT at L4–L5 did not differ from the association with total volume or the other VAT areas (P>0.01).
Associations between abdominal AT and metabolic risk factors
Baseline ASAT and VAT volume and all respective AT areas except ASAT at 5 cm below L4–L5 were significantly associated with baseline insulin AUC (P<0.05) (Table 2). Change in ASAT volume and areas at 5 and 10 cm above L4–L5 were significantly associated with change in glucose AUC and insulin AUC (P<0.05). Changes in VAT volume and areas at L4–L5 and 5 cm below L4–L5 were significantly associated with change in insulin AUC (P<0.05) (Table 2). There was no association between ASAT or VAT and blood pressure, glucose, cholesterol or triglycerides, either at baseline or after the intervention (P> 0.05).
Table 2.
Associations between ASAT and VAT with insulin AUC
| Volume | −5 cm | L4–L5 | +5 cm | +10 cm | +15 cm | |
|---|---|---|---|---|---|---|
| ASAT | ||||||
| Baseline | 0.29* | 0.10† | 0.26* | 0.30* | 0.34* | 0.39* |
| Change | 0.32* | 0.21 | 0.21 | 0.28* | 0.26* | 0.24 |
| VAT | ||||||
| Baseline | 0.42* | 0.37* | 0.34* | 0.34* | 0.37* | 0.39* |
| Change | 0.33* | 0.28* | 0.32* | 0.26 | 0.21 | 0.03 |
= significant correlation with insulin AUC (P<0.05).
= significantly different association with insulin AUC relative to L4–L5 (P<0.05).
ASAT = abdominal subcutaneous adipose tissue; VAT = visceral adipose tissue; AUC = area under the curve.
DISCUSSION
In this study, we examined whether measurement site of abdominal AT influences the associations between VAT and ASAT, WC, and metabolic risk factors and changes therein in response to exercise training in obese adolescents. Our findings demonstrate the following: 1) the areas at 5 cm or 10 cm above L4–L5 were more strongly associated with baseline and change in total ASAT and VAT as compared with L4–L5, 2) WC was significantly associated with baseline and change in ASAT and VAT volume and most regional AT areas, and 3) changes in total ASAT and VAT volume were more consistently associated with insulin AUC than any single-slice abdominal AT area. These findings suggest that the traditionally measured abdominal AT area at L4–L5 may not be the most predictive of changes in total abdominal AT or metabolic risk factors in obese adolescents, particularly in response to exercise intervention.
Although a single-slice image at L4–L5 is often used as a surrogate measure for VAT volume, several studies in adults have shown that the VAT area in the upper abdominal region (e.g., L2–L3) is a better predictor of total VAT volume than VAT area at L4–L5 (3, 14–16). In youth, it has been shown that VAT area at 5 cm above L4–L5 is a better proxy measure of total VAT volume in black youth, while VAT areas at L4–L5, and 5 and 10 cm above L4–L5 are all similarly correlated with total VAT volume in white youth (6). In the present study, we observed that the pattern of association between changes in abdominal AT volume and area was similar for boys and girls, and between white and black youth in response to exercise intervention.
Several studies have proposed that change in the VAT area at L4–L5 following weight loss may not be the best predictor of change in total VAT volume in obese adults (3, 17, 18). For example, the VAT area 5–6 cm above L4–L5 was shown to be the best single-slice predictor of change in VAT volume in obese men (17, 18), and changes in the area at L1–L2 and L2–L3 were reported to have stronger associations with changes in VAT volume than measure at L4–L5 in obese women (3). We extend these findings to obese adolescents and demonstrate that although change in VAT area at L4–L5 is correlated with change in VAT volume, the changes in VAT areas in the upper abdominal regions (e.g., 5 cm and 10 cm above L4–L5) are stronger correlates of changes in total VAT as compared to L4–L5. Similar results have been reported in obese adults (3,4). Therefore, the most time and cost efficient method for assessing changes in VAT may be to obtain single-slice images at either 5 cm or 10 cm above L4–L5.
The optimal ASAT measurement site is not as commonly examined as VAT, likely due to its weaker observed association with health risk than VAT in both adults (5) and adolescents (6, 19). We observed that ASAT areas at L4–L5, and 5 cm and 10 cm above L4–L5 are all similarly correlated with total ASAT volume in obese adolescents at baseline. Similar to VAT, the changes in ASAT area at 5 cm and 10 cm above L4–L5 were more strongly associated with change in ASAT volume as compared to L4–L5 in response to exercise intervention. These findings suggest that the association between abdominal AT volume and area is similar for ASAT and VAT in obese adolescents.
WC is often used to predict ASAT and VAT and related metabolic risk in adults. However, studies are divided as to whether WC is a good predictor of total VAT in children and adolescents (20–23). Similar to our previous observation (23), the present study reports that WC is strongly associated with VAT volume and all VAT areas at baseline. Furthermore, we demonstrate that the change in WC following 3 months of regular exercise was significantly associated with changes in VAT volume and areas at L4–L5 and 5 cm above L4–L5. These observations suggest that WC can be used as an indicator of visceral adiposity in obese adolescents both cross-sectionally and changes therein.
Although single slice AT areas at all levels of the abdomen have been reported to be associated with metabolic syndrome (5) and individual metabolic syndrome components in adults (1, 24), in the present study only insulin AUC, and no other risk factors, were associated with baseline and change in VAT and ASAT. We observed that insulin AUC at baseline was significantly associated with ASAT and VAT volume and most abdominal AT areas. These results are similar to others (25–27) reporting significant associations between fasting insulin and abdominal AT in youth. We extend these previous observations by demonstrating that during a 3-month exercise intervention, changes in insulin AUC during an OGTT are significantly associated with changes in total ASAT and VAT volume in obese adolescents. However, ASAT and VAT areas were not as consistent in their association with baseline and changes in insulin AUC, and there was no best single-slice MR image for predicting insulin AUC at baseline or changes with intervention. Thus, when examining obesity-related health risk, assessment of the total AT volume may be the most ideal. However, if only one single slice image is to be used as a proxy measure for total volume, then our results indicate that 5 cm or 10 cm above L4–L5 is the best predictor of baseline and change in total ASAT and VAT volume.
A major strength of this study is that it is the first to examine which single-slice images are most predictive of changes in ASAT and VAT and metabolic variables in obese adolescents. Limitations of this study also warrant mention. Although we did not observe any sex or ethnic differences in these associations, this may be due to our small sample size. In addition, only white and black adolescents were assessed, and thus we cannot extend these results to other ethnicities. Further, we did not employ contiguous MRI images to assess abdominal AT distribution, but used a well-established abdominal MRI protocol (12). Finally, our sole intervention modality was exercise, and therefore we are unsure if the associations we observed would be similar with other interventions, such as diet or pharmacological intervention.
In conclusion, the measurement site for abdominal AT has significant influence on the relationships with total VAT or ASAT and metabolic risk factors in obese adolescents before and after an exercise intervention. The ASAT and VAT areas in the upper abdominal regions (e.g., 5 cm and 10 cm above L4–L5) are more strongly associated with baseline and change in total ASAT and VAT as compared with AT areas at L4–L5. However, total ASAT and VAT volumes were more consistently associated with insulin AUC than any single-slice image before and after an exercise intervention. Thus, measurement of total AT volume may be the most optimal approach for assessing abdominal obesity and obesity-related health risk. However, additional studies with larger sample sizes are needed to confirm these findings.
What is already known about this subject.
Visceral adipose tissue is associated with metabolic risk factors in adults and adolescents
The abdominal adipose tissue area at L4–L5 is often used as a surrogate measure of total abdominal adiposity
There is speculation as to whether the area at L4–L5 is the most predictive of total abdominal adipose tissue volume, or metabolic risk factors, in adults
What this study adds
The areas 5 cm and 10 cm above L4–L5 are more strongly associated with total abdominal subcutaneous adipose tissue volume and visceral adipose tissue volume than the area at L4–L5 before and after an exercise intervention in obese adolescents
Changes in abdominal subcutaneous adipose tissue and visceral adipose tissue volumes are more strongly associated with insulin area under the curve than any single-slice adipose tissue area in obese adolescents
ACKNOWLEDGEMENTS
This research was funded by the American Diabetes Association (7-08-JF-27), NIH (1R21DK083654-01A1 and UL1 RR024153 CTSA), Department of Defense (FA7014-02-2-001), Cochrane-Weber Foundation and Renziehausen Fund at Children’s Hospital of Pittsburgh of UPMC (to S Lee). SL conceived and carried out experiments and analyzed data. RB performed statistical analyses. All authors were involved in writing the paper and had final approval of the submitted and published versions.
Footnotes
CONFLICT OF INTEREST
All authors have no conflicts of interest to declare.
REFERENCES
- 1.Demerath EW, Reed D, Rogers N, et al. Visceral adiposity and its anatomical distribution as predictors of the metabolic syndrome and cardiometabolic risk factor levels. Am J Clin Nutr. 2008;88:1263–1271. doi: 10.3945/ajcn.2008.26546. [DOI] [PMC free article] [PubMed] [Google Scholar]
- 2.Shen W, Punyanitya M, Wang Z, et al. Visceral adipose tissue: relations between single-slice areas and total volume. Am J Clin Nutr. 2004;80:271–278. doi: 10.1093/ajcn/80.2.271. [DOI] [PMC free article] [PubMed] [Google Scholar]
- 3.Kuk JL, Church TS, Blair SN, Ross R. Measurement site and the association between visceral and abdominal subcutaneous adipose tissue with metabolic risk in women. Obesity (Silver Spring) 2010;18:1336–1340. doi: 10.1038/oby.2009.414. [DOI] [PubMed] [Google Scholar]
- 4.Shen W, Chen J, Gantz M, Velasquez G, Punyanitya M, Heymsfield SB. A single MRI slice does not accurately predict visceral and subcutaneous adipose tissue changes during weight loss. Obesity. 2012;20:2458–2463. doi: 10.1038/oby.2012.168. [DOI] [PMC free article] [PubMed] [Google Scholar]
- 5.Kuk JL, Church TS, Blair SN, Ross R. Does measurement site for visceral and abdominal subcutaneous adipose tissue alter associations with the metabolic syndrome? Diabetes Care. 2006;29:679–684. doi: 10.2337/diacare.29.03.06.dc05-1500. [DOI] [PubMed] [Google Scholar]
- 6.Lee S, Kuk JL, Kim Y, Arslanian Sa. Measurement site of visceral adipose tissue and prediction of metabolic syndrome in youth. Pediatr Diabetes. 2011;12:250–257. doi: 10.1111/j.1399-5448.2010.00705.x. [DOI] [PMC free article] [PubMed] [Google Scholar]
- 7.Lee S, Bacha F, Hannon T, Kuk JL, Boesch C, Arslanian S. Effects of aerobic versus resistance exercise without caloric restriction on abdominal fat, intrahepatic lipid, and insulin sensitivity in obese adolescent boys: a randomized controlled trial. Diabetes. 2012;61:2787–2795. doi: 10.2337/db12-0214. [DOI] [PMC free article] [PubMed] [Google Scholar]
- 8.Lee S, Deldin AR, White D, et al. Aerobic exercise but not resistance exercise reduces intrahepatic lipid content and visceral fat and improves insulin sensitivity in obese adolescent girls. Am J Physiol Endocrinol Metab. 2013;305:E1222–E1229. doi: 10.1152/ajpendo.00285.2013. [DOI] [PMC free article] [PubMed] [Google Scholar]
- 9.Kuczmarski RJ, Ogden CL, Guo SS, et al. 2000 CDC Growth Charts for the United States: methods and development. Vital Heal Stat. 2002;11:1–190. [PubMed] [Google Scholar]
- 10.Tanner JM. Growth and maturation during adolescence. Nutr Rev. 1981;39:43–55. doi: 10.1111/j.1753-4887.1981.tb06734.x. [DOI] [PubMed] [Google Scholar]
- 11.Allison DB, Paultre F, Maggio C, Mezzitis N, Pi-Sunyer FX. The use of areas under curves in diabetes research. Diabetes Care. 1995;18:245–250. doi: 10.2337/diacare.18.2.245. [DOI] [PubMed] [Google Scholar]
- 12.Ross R, Rissanen J, Pedwell H, Clifford J, Shragge P. Influence of diet and exercise on skeletal muscle and visceral adipose tissue in men. J Appl Physiol. 1996;81:2445–2455. doi: 10.1152/jappl.1996.81.6.2445. [DOI] [PubMed] [Google Scholar]
- 13.Snyder W, Manssett E, Larhansen L, Howells G, Tipton I. Report of the task group on reference man. Oxford, United Kingdom: 1975. p. 480. [Google Scholar]
- 14.Maislin G, Ahmed MM, Gooneratne N, et al. Single slice vs. volumetric MR assessment of visceral adipose tissue: reliability and validity among the overweight and obese. Obesity. 2012;20:2124–2132. doi: 10.1038/oby.2012.53. [DOI] [PMC free article] [PubMed] [Google Scholar]
- 15.Han TS, Kelly IE, Walsh K, Greene RM, Lean ME. Relationship between volumes and areas from single transverse scans of intra-abdominal fat measured by magnetic resonance imaging. Int J Obes Relat Metab Disord. 1997;21:1161–1166. doi: 10.1038/sj.ijo.0800530. [DOI] [PubMed] [Google Scholar]
- 16.Demerath EW, Shen W, Lee M, et al. Approximation of total visceral adipose tissue with a single magnetic resonance image. Am J Clin Nutr. 2007;85:362–368. doi: 10.1093/ajcn/85.2.362. [DOI] [PMC free article] [PubMed] [Google Scholar]
- 17.So R, Sasai H, Matsuo T, et al. Visceral Adipose Tissue Volume Estimated at Imaging Sites 5–6 cm Above L4–L5 Is Optimal for Predicting Cardiovascular Risk Factors in Obese Japanese Men. Tohoku J Exp Med. 2012;227:297–305. doi: 10.1620/tjem.227.297. [DOI] [PubMed] [Google Scholar]
- 18.So R, Matsuo T, Sasai H, et al. Best single-slice measurement site for estimating visceral adipose tissue volume after weight loss in obese, Japanese men. Nutr Metab. 2012;9:56. doi: 10.1186/1743-7075-9-56. [DOI] [PMC free article] [PubMed] [Google Scholar]
- 19.Kim Ja, Park HS. Association of abdominal fat distribution and cardiometabolic risk factors among obese Korean adolescents. Diabetes Metab. 2008;34:126–130. doi: 10.1016/j.diabet.2007.10.012. [DOI] [PubMed] [Google Scholar]
- 20.Brambilla P, Bedogni G, Moreno La, et al. Crossvalidation of anthropometry against magnetic resonance imaging for the assessment of visceral and subcutaneous adipose tissue in children. Int J Obes. 2006;30:23–30. doi: 10.1038/sj.ijo.0803163. [DOI] [PubMed] [Google Scholar]
- 21.Springer F, Ehehalt S, Sommer J, et al. Predicting volumes of metabolically important whole-body adipose tissue compartments in overweight and obese adolescents by different MRI approaches and anthropometry. Eur J Radiol. 2012;81:1488–1494. doi: 10.1016/j.ejrad.2011.04.006. [DOI] [PubMed] [Google Scholar]
- 22.Siegel MJ, Hildebolt CF, Bae KT, Hong C, White NH. Total and Intraabdominal Fat Distribution in Preadolescents and Adolescents : Measurement with MR Imaging. Radiology. 2007;242:846–856. doi: 10.1148/radiol.2423060111. [DOI] [PubMed] [Google Scholar]
- 23.Lee S, Bacha F, Gungor N, Arslanian Sa. Waist circumference is an independent predictor of insulin resistance in black and white youths. J Pediatr. 2006;148:188–194. doi: 10.1016/j.jpeds.2005.10.001. [DOI] [PubMed] [Google Scholar]
- 24.Shen W, Punyanitya M, Chen J, et al. Visceral adipose tissue: relationships between single slice areas at different locations and obesity-related health risks. IJO. 2007;31:763–769. doi: 10.1038/sj.ijo.0803474. [DOI] [PMC free article] [PubMed] [Google Scholar]
- 25.Gutin B, Johnson MH, Humphries MC, et al. Relationship of visceral adiposity to cardiovascular disease risk factors in black and white teens. Obesity. 2007;15:1029–1035. doi: 10.1038/oby.2007.602. [DOI] [PubMed] [Google Scholar]
- 26.Gower BA, Nagy TR, Trowbridge CA, Dezenberg C, Goran MI. Fat distribution and insulin response in prepubertal African American and white children. Am J Clin Nutr. 1998;67:821–827. doi: 10.1093/ajcn/67.5.821. [DOI] [PubMed] [Google Scholar]
- 27.Owens S, Gutin B, Ferguson M, Allison J, Karp W, Le N-A. Visceral adipose tissue and cardiovascular risk factors in obese children. J Pediatr. 1998;133 doi: 10.1016/s0022-3476(98)70175-1. [DOI] [PubMed] [Google Scholar]