

Abstract
Melanoma-associated antigens (MAGE)-A9 has been reported to play important roles in the development of human cancers. However, the association between MAGE-A9 expression and the clinicopathological characteristics of hepatocellular carcinoma (HCC) is not well understood. The study was to detect the expression of MAGE-A9 in human HCC and investigate the association between its expression and the clinicopathological characteristics of HCC. Reverse transcription-polymerase chain reaction (RT-PCR), one-step quantitative -PCR (qPCR) and immunohistochemistry (IHC) analyses were performed to characterize the expression of MAGE-A9 in HCC cell lines and tissues. Kaplan-Meier survival and Cox regression analyses were employed to evaluate the prognosis of 100 HCC patients. The results showed that the expression of MAGE-A9 in HCC was significantly higher than that in non-cancerous cells and tissues. Moreover, the expression level of the MAGE-A9 protein in HCC was related to the pathological grade (p = 0.003), portal vein invasion (p = 0.001), distant metastasis (p = 0.022) and TNM stage (p = 0.005). Cox regression analysis further revealed that MAGE-A9 expression is an independent prognostic factor for disease-free survival (p = 0.006) and overall survival (p = 0.022). These data are the first to indicate that MAGE-A9 expression is a valuable prognostic biomarker for HCC and that high MAGE-A9 expression suggests unfavorable survival outcomes in HCC patients.
Hepatocellular carcinoma (HCC) is the fifth most common cancer and accounts for more than half a million deaths each year, making HCC the third leading cause of cancer death worldwide1. The lethality of HCC and the lack of effective treatments make HCC an enormous challenge. In China, for example, HCC patients account for half of the total global HCC cases, and the township of Qidong in Jiangsu Province of China is one of the highest endemic regions for HCC worldwide2,3. Although a growing number of therapy strategies, including liver transplantation, surgical resection, radiofrequency ablation and molecular therapy, have been developed, the overall survival of HCC is still poor and frustrating4,5. At present, alpha-fetoprotein (AFP) is the most acknowledged biomarker for early detection and the follow-up of HCC patients during treatment6. However, due to the existence of AFP-negative HCC patients, studies that focus on novel biomarkers to distinguish patients with poor prognosis or at high risk of early recurrence of HCC are urgently needed and of great importance.
Melanoma-associated antigens (MAGE) are a group of well-characterized members of the cancer/testis antigen (CTA) family, which represents a unique class of tumor antigens that are expressed in a wide variety of malignant tumors7,8. MAGE-A is a subfamily comprising MAGE and MAGE-A antigens that are highly tumor specific; MAGE-A genes are anomalously expressed cancers though rarely expressed in normal tissues9. Hence, MAGE-As are rationally identified as ideal targets for cancer immunotherapy, and several MAGE-A-based immunotherapy and targeted therapy strategies have been developed10,11,12.
In the case of MAGE-A9, the protein is frequently expressed in various human cancers, including melanoma, head and neck squamous cell carcinoma, non-small cell lung carcinoma (NSCLC) and multiple myeloma13. MAGE-A9 was also identified as having prognostic relevance in high-grade bladder cancer, revealing MAGE-A9 expression to be associated with tumor progression14. The expression of MAGE-A9 was found to be higher in more advanced stages of renal cancer and was correlated with tumor prognosis15. Thus, studies addressing whether the function of MAGE-A9 is analogous in HCC and whether MAGE-A9 can be utilized as a new biomarker for the diagnosis and treatment for HCC are important and of great interest.
This study was designed to detect the expression of MAGE-A9 by reverse transcription-polymerase chain reaction (RT-PCR) in HCC cells, one-step quantitative reverse transcription-PCR (qPCR) in fresh HCC samples and immunohistochemistry (IHC) in HCC tissue microarrays (TMA). Moreover, the relationship of MAGE-A9 expression with the clinicopathological attributes of HCC patients, especially its prognostic significance, was further evaluated.
Results
Summarization of clinical information of 100 HCC patients
The primary clinical information of 100 HCC patients are illustrated in Table 1. A total of 83 men and 17 women, of median age 54.01 years (range 27–73 years) were enrolled in this study. The AFP of 56 patients was high (≥13.2 μg/L), whereas that of the remaining 44 patients was low (<13.2 μg/L). 66 patients encountered Hepatitis B virus (HBV) infection and 42 patients experienced liver cirrhosis. Regarding the pathological grade, 11 patients were at grade 1, 71 were at grade 2, and 18 were at grade 3. Portal vein invasion was detected in 38 patients and 26 patients suffered lymph node metastasis while 6 patients endured distant metastasis. As for TNM stage, 39 patients were in stage I–II while the other 51 patients were in advanced stage III–IV.
Table 1. Relationship of high MAGE-A9 expression with clinicopathological characteristics in HCC.
| MAGE-A9 | |||||
|---|---|---|---|---|---|
| Groups | No. | + | % | χ2 | p value |
| Total | 100 | 55 | 55.0 | ||
| Gender | |||||
| Male | 83 | 44 | 53.0 | 0.78 | 0.377 |
| Female | 17 | 11 | 64.7 | ||
| Age (years) | |||||
| <60 | 76 | 41 | 53.9 | 0.14 | 0.707 |
| ≥60 | 24 | 14 | 58.3 | ||
| Tumor size (cm) | |||||
| >5 | 58 | 34 | 58.6 | 0.73 | 0.392 |
| ≤5 | 42 | 21 | 50.0 | ||
| α-fetoprotein (AFP) status | |||||
| High | 56 | 28 | 50.0 | 1.29 | 0.257 |
| Low | 44 | 27 | 61.4 | ||
| Hepatitis B virus infection | |||||
| Positive | 66 | 35 | 53.0 | 0.30 | 0.581 |
| Negative | 34 | 20 | 58.8 | ||
| Liver cirrhosis | |||||
| Positive | 42 | 21 | 50.0 | 0.73 | 0.392 |
| Negative | 58 | 34 | 58.6 | ||
| Pathological grade | |||||
| Grade 1 | 11 | 1 | 9.1 | 11.74 | 0.003* |
| Grade 2 | 71 | 41 | 57.7 | ||
| Grade 3 | 18 | 13 | 72.2 | ||
| Portal vein invasion | |||||
| Positive | 38 | 29 | 76.3 | 11.25 | 0.001* |
| Negative | 62 | 26 | 41.9 | ||
| Lymph node metastasis | |||||
| Positive | 26 | 18 | 69.2 | 2.87 | 0.090 |
| Negative | 74 | 37 | 50.0 | ||
| Distant metastasis | |||||
| Positive | 6 | 6 | 100.0 | 5.22 | 0.022* |
| Negative | 94 | 49 | 52.1 | ||
| TNM stage | |||||
| Stage I | 13 | 4 | 30.8 | 13.05 | 0.005* |
| Stage II | 36 | 15 | 41.7 | ||
| Stage III | 45 | 30 | 66.7 | ||
| Stage IV | 6 | 6 | 100.0 | ||
*p < 0.05.
Detection of MAGE-A9 expression in HCC cell lines by RT-PCR
MAGE-A9 mRNA expression were firstly examined in four HCC cell lines (BEL-7402, SMMC-7721, HepG2 and SK-HEP-1). Two non-cancerous cell lines (LO-2 and HUVEC) were employed as negative control. As shown in Figure 1, MAGE-A9 mRNA expression were detected in four HCC cell lines with high intensities compared with extremely low expression of MAGE-A9 in two non-cancerous cell lines.
Figure 1. MAGE-A9 expression in four hepatocellular carcinoma (HCC) cell lines and two non-cancerous cell lines.
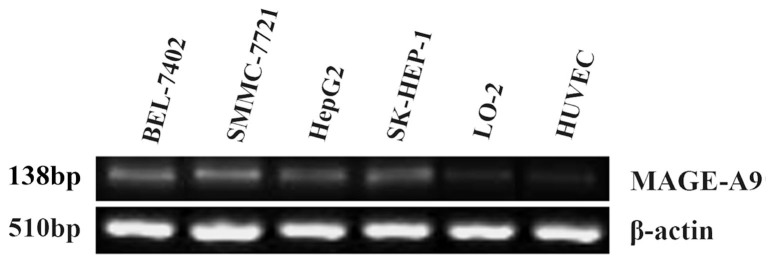
Reverse transcription-polymerase chain reaction (RT-PCR) analysis showed that MAGE-A9 mRNA expression in HCC cell lines (BEL-7402, SMMC-7721, HepG2 and SK-HEP-1) were detected with high intensities compared with low intensities of MAGE-A9 expression in human liver cell line LO-2 and human umbilical vein-derived endothelial cell line (HUVEC).
Detection of MAGE-A9 expression in HCC tissue samples by qPCR
Total RNA was extracted from 20 fresh HCC tissues and corresponding non-cancerous tissues to evaluate the MAGE-A9 mRNA expression by qPCR test. As is shown in Figure 2, the means of MAGE-A9 mRNA in HCC tissues (4.44 ± 0.342) were significantly higher than that of in corresponding non-cancerous tissues (1.73 ± 0.178) when normalized to glyceraldehyde 3-phosphate dehydrogenase (GAPDH) (p < 0.05).
Figure 2. MAGE-A9 expression in hepatocellular carcinoma (HCC) tissues and tumor adjacent non-cancerous tissues.

One-step quantitative real-time polymerase chain reaction (qPCR) demonstrated that the expression of MAGE-A9 in HCC tissues (4.44 ± 0.342) was significantly higher than that of in matched non-cancerous tissues (1.73 ± 0.178), when normalized to the GAPDH internal control. *p < 0.05.
Detection of MAGE-A9 expression in HCC TMA by IHC
IHC was executed to evaluate the MAGE-A9 protein expression. High MAGE-A9 expression was witnessed in 55 of 100 (55%) HCC tissue samples, whereas only 18 cases of 100 non-cancerous normal tissues (18%) exhibited positive MAGE-A9 expression. There was significant difference in high expression rate of MAGE-A9 protein between HCC tissues and non-cancerous tissues (p < 0.05). Positive staining was mainly localized in the membrane and cytoplasm of HCC cells and the representative IHC staining for MAGE-A9 protein expression in HCC are shown in Figure 3. The relationship between MAGE-A9 protein expression and clinicopathological parameters was elucidated in Table 1. High MAGE-A9 protein expression was correlated with pathological grade (p = 0.003), portal vein invasion (p = 0.001), distant metastasis (p = 0.022) and TNM stage (p = 0.005). In comparison, no significant correlation was discovered between MAGE-A9 expression and other clinical features, including gender, age, tumor diameter, AFP status, HBV infection, liver cirrhosis and lymph node metastasis.
Figure 3. Representative pattern of MAGE-A9 protein expression in HCC and corresponding non-cancerous tissues with tissue microarray (TMA).

A1, A2 and A3 High immunohistochemical (IHC) staining of MAGE-A9 in well differentiated HCC sample. Red arrow shows positive staining in the membrane and cytoplasm of cancer cells. B1, B2 and B3 High IHC staining of MAGE-A9 in moderately-poorly differentiated HCC sample. Green arrow shows positive staining in the membrane and cytoplasm of cancer cells. C1, C2 and C3 Negative IHC staining of MAGE-A9 in HCC sample as negative control. Yellow arrow shows negative staining of HCC cells. D1, D2 and D3 Negative IHC staining of MAGE-A9 in non-cancerous tissue sample. Orange arrow shows negative staining of non-cancerous cells. Original magnification ×40 in A1, B1, C1 and D1; ×200 in A2, B2, C2 and D2; ×400 in A3, B3, C3 and D3.
Survival analysis
According to a univariate analysis, several factors were correlated with the disease-free survival (DFS) of HCC patients, including MAGE-A9 expression (p = 0.001), tumor size (p = 0.031), pathological grade (p = 0.007), portal vein invasion (p = 0.001), lymph node metastasis (p = 0.001), distant metastasis (p = 0.035) and TNM stage (p = 0.001) (Table 2). All the above items, except for distant metastasis, were also associated with overall survival (OS) in 100 HCC patients (Table 3). By using a multivariate analysis with the Cox regression model, MAGE-A9 expression (p = 0.006) and lymph node metastasis (p = 0.008) indicated a poor DFS, whereas MAGE-A9 expression (p = 0.022) and portal vein invasion (p = 0.039) were identified as independent prognostic factors for OS (Table 2 and 3). Kaplan-Meier survival curves subsequently demonstrated that HCC patients with high MAGE-A9 expression presented a significantly unfavorable DFS time and OS time. In addition, HCC patients with lymph node metastasis and positive portal vein invasion experienced poor DFS and OS rates, respectively (Figure 4).
Table 2. Univariate and multivariate analysis of prognostic factors in HCC for disease-free survival.
| Univariate analysis | Multivariate analysis | |||||
|---|---|---|---|---|---|---|
| HR | p > |z| | 95% CI | HR | p > |z| | 95% CI | |
| MAGE-A9 expression | ||||||
| High versus Low | 3.39 | 0.001* | 1.898–6.046 | 2.54 | 0.006* | 1.299–4.954 |
| Gender | ||||||
| Male versus Female | 1.08 | 0.648 | 0.580–2.403 | |||
| Age (years) | ||||||
| <60 versus ≥60 | 1.66 | 0.146 | 0.838–3.285 | |||
| Tumour size (cm) | ||||||
| >5 versus ≤5 | 1.83 | 0.031* | 1.057–3.177 | 1.44 | 0.255 | 0.768–2.707 |
| α-fetoprotein status | ||||||
| High versus Low | 1.01 | 0.971 | 0.603–1.692 | |||
| Hepatitis B virus infection | ||||||
| Positive versus Negative | 1.21 | 0.486 | 0.699–2.128 | |||
| Liver cirrhosis | ||||||
| Positive versus Negative | 0.89 | 0.660 | 0.522–1.509 | |||
| Pathological grade | ||||||
| Grade 1 and 2 versus Grade 3 | 0.45 | 0.007* | 0.252–0.807 | 0.74 | 0.378 | 0.384–1.438 |
| Portal vein invasion | ||||||
| Positive versus Negative | 3.26 | 0.001* | 1.930–5.520 | 1.79 | 0.073 | 0.948–3.368 |
| Lymph node metastasis | ||||||
| Positive versus Negative | 2.67 | 0.001* | 1.548–4.605 | 2.29 | 0.008* | 1.238–4.229 |
| Distant metastasis | ||||||
| Positive versus Negative | 2.52 | 0.035* | 1.068–5.966 | 0.60 | 0.317 | 0.216–1.644 |
| TNM stage | ||||||
| Stage I-II versus Stage III-IV | 0.32 | 0.001* | 0.184–0.565 | 0.77 | 0.480 | 0.370–1.598 |
| MAGE-A9 expression+ α-fetoprotein status | ||||||
| Both high versus Others situations (High + Low or Low + High or Both low) | 1.60 | 0.093 | 0.925–2.785 | |||
*p < 0.05.
Table 3. Univariate and multivariate analysis of prognostic factors in HCC for overall survival.
| Univariate analysis | Multivariate analysis | |||||
|---|---|---|---|---|---|---|
| HR | p > |z| | 95% CI | HR | p > |z| | 95% CI | |
| MAGE-A9 expression | ||||||
| High versus Low | 3.22 | 0.001* | 1.804–5.737 | 2.17 | 0.022* | 1.121–4.205 |
| Gender | ||||||
| Male versus Female | 1.13 | 0.740 | 0.554–2.297 | |||
| Age (years) | ||||||
| <60 versus ≥60 | 1.72 | 0.121 | 0.867–3.396 | |||
| Tumour size (cm) | ||||||
| >5 versus ≤5 | 1.84 | 0.031* | 1.058–3.183 | 1.44 | 0.244 | 0.778–2.679 |
| α-fetoprotein status | ||||||
| High versus Low | 1.03 | 0.896 | 0.618–1.734 | |||
| Hepatitis B virus infection | ||||||
| Positive versus Negative | 1.19 | 0.539 | 0.682–2.078 | |||
| Liver cirrhosis | ||||||
| Positive versus Negative | 0.84 | 0.519 | 0.494–1.428 | |||
| Pathological grade | ||||||
| Grade 1 and 2 versus Grade 3 | 0.44 | 0.005* | 0.245–0.783 | 0.79 | 0.455 | 0.425–1.467 |
| Portal vein invasion | ||||||
| Positive versus Negative | 3.33 | 0.001* | 1.966–5.645 | 1.95 | 0.039* | 1.035–3.656 |
| Lymph node metastasis | ||||||
| Positive versus Negative | 2.42 | 0.001* | 1.408–4.159 | 1.74 | 0.066 | 0.964–3.133 |
| Distant metastasis | ||||||
| Positive versus Negative | 2.10 | 0.088 | 0.896–4.917 | |||
| TNM stage | ||||||
| Stage I-II versus Stage III-IV | 0.35 | 0.001* | 0.200–0.612 | 0.86 | 0.690 | 0.411–1.800 |
| MAGE-A9 expression + α-fetoprotein status | ||||||
| Both high versus Others situations (High + Low or Low + High or Both low) | 1.59 | 0.100 | 0.915–2.748 | |||
*p < 0.05.
Figure 4. Survival analysis of 100 HCC patients by Kaplan-Meier method.

(A) Disease-free survival rate in patients with high MAGE-A9 expression (green line) was significantly lower than that in patients with low MAGE-A9 expression (blue line). (B) Disease-free survival rate in patients with positive lymph node metastasis (green line) was significantly lower than that in patients with negative lymph node metastasis (blue line). (C) Overall survival rate in patients with high MAGE-A9 expression (green line) was significantly lower than that in patients with low MAGE-A9 expression (blue line). (D) Overall survival rate in patients with positive portal vein invasion (green line) was significantly lower than that in patients with negative portal vein invasion (blue line).
Discussion
MAGE-A antigens have recently been identified as promising immunotherapeutic targets for anticancer therapy, as they are strictly tumor specific and are shared by many types of tumors7,9,16. Several basic and clinical trials involving melanoma, esophagus cancer and lung cancer have utilized proteins and peptides derived from some of these antigens and have shown encouraging results10,11,12,17,18. Although the normal physiologic role of MAGE-A antigens remains unknown, their contribution to the development of cancers has been investigated recently. It is reported that MAGE expression is directly regulated by microRNAs, such as miR-34a, and that MAGE-A proteins can inhibit p53 function through direct and indirect mechanisms9,19,20. With regard to MAGE-A9, high protein expression has been detected in several human cancers13, MAGE-A9 also shows prognostic relevance in bladder cancer and renal cancer and is correlated with tumor progression14,15. Regardless, the detailed understanding of the function of MAGE-A9 in hepatocellular carcinoma, especially regarding prognostic characteristics, is limited.
In this study, we first investigated MAGE-A9 mRNA expression in cell lines by RT-PCR. The results showed elevated MAGE-A9 expression in four HCC cell lines compared to non-cancerous cell lines. Subsequently, the expression of MAGE-A9 mRNA in fresh HCC tissues and matched non-cancerous tissues was evaluated by qPCR. The results suggested a significantly higher level of MAGE-A9 expression in HCC tissue samples than in non-cancerous tissue samples. Moreover, TMA with HCC specimens was constructed, and an IHC analysis was performed to further prove that MAGE-A9 protein expression in HCC is also higher than in non-cancerous tissues, with statistical significance. In a report by Picard V et al, a high MAGE-A9 transcript level was found in superficial and invasive tumors, whereas no transcript was detected in normal urothelium21. These data are consistent with our results and support our findings. In addition, certain clinical parameters, including the pathological grade, portal vein invasion, distant metastasis and TNM stage, were correlated with MAGE-A9 protein expression. Similarly, in a panel of 493 primary bladder tumors, Bergeron et al described that MAGE-A9 was associated with a higher grade and tumor recurrence14.
For survival analysis, Cox proportional hazards regression models, in which the effect of covariates is to multiply the hazard function by a function of the explanatory covariates, have achieved widespread application in the analysis of time-to-event data, with censoring and covariates22. In the present study, a univariate analysis was firstly chosen to detect important factors that may influence the prognosis of HCC patients; a multivariate analysis was then performed to identify the authenticity and validity of the prognostic factors detected. Finally, we screened the valid prognostic factors (MAGE-A9 expression and lymph node metastasis status for DFS and MAGE-A9 expression and portal vein invasion status for OS), and the data demonstrated that high MAGE-A9 expression was associated with a poor prognosis in patients with HCC. Patients expressing high levels of MAGE-A9 exhibited unfavorable outcomes for both DFS and OS. These results were in line with previous studies in renal cell carcinoma15 and bladder cancer21. A Kaplan-Meier analysis also verified that HCC patients with high MAGE-A9 expression showed a significantly unfavorable life span, including DFS and OS.
The research to date concerning the role of MAGE-A9 in cancers has been unthorough and inadequate. However, a growing number of studies focusing on the MAGE-A family have indicated the critical role of different members of the MAGE-A family in cancer development, and MAGE-As have been identified as appealing targets for cancer immunotherapy or chemo-immunotherapy7,9,20,23,24. Accordingly, several MAGE-A-based immunotherapy therapeutics have been developed and showed positive results10,12. Our research team also constructed an anti-MAGE-A1 immunotoxin and verified its anti-tumor effectiveness11. Considering the oncogenic role of MAGE-A9 in cancer, the application of treatment targeting MAGE-A9 is anticipated, and a fully human anti-MAGE-A9 antibody is currently being generated by our research group.
However, there were some limitations to the present study. For example, we failed to collect the clinical information of HCV infection and alcohol consumption of the HCC patients, factors that are considered to be important elements of HCC etiology. We will consummate our studies in the future by improving the clinical data collection.
In summary, we conclude for the first time that MAGE-A9 can be recognized as a prognostic factor in HCC and that targeting MAGE-A9 may provide a promising therapeutic strategy for HCC treatment. Further studies that include more clinical samples of HCC are necessary to confirm our findings and to elucidate the possible mechanisms of MAGE-A9 characteristics in HCC.
Methods
Cell lines and cell culture
Four HCC cell lines (BEL-7402, SMMC-7721, HepG2 and SK-HEP-1), human liver cell line LO-2, and human umbilical vein-derived endothelial cell line (HUVEC) were obtained from the cell bank of the Chinese Academy of Science (Shanghai, China). All the cells were cultured routinely by our laboratory in DMEM medium (Gibco, Invitrogen, Carlsbad, California, USA) supplemented with 10% fetal bovine serum (FBS; Gibco), penicillin (100 U/mL) and streptomycin (100 lg/mL).
Patients and tissue samples
A total of 100 formalin-fixed, paraffin-embedded HCC tissues and 100 matched tumor-adjacent normal tissues were obtained from the Affiliated Hospital of Nantong University from 2003 and 2010. Before surgical therapy, none of the patients had received neoadjuvant chemotherapy, radiation therapy or immunotherapy. Related original clinical data, including gender, age, tumor size, AFP status, HBV infection, liver cirrhosis, pathological grade, portal vein invasion, lymph node metastasis, distant metastasis and TNM stage, were also collected simultaneously. Clinical staging was performed according to the 2002 American Joint Committee on Cancer/International Union Against Cancer TNM staging system25. A panel of 20 fresh HCC tissues and corresponding adjacent non-cancerous tissues, obtained from the Department of Pathology, the Affiliated Hospital of Nantong University were also enrolled in this study. Written informed consent was accomplished from the patients for publication of this study. Study protocol was approved by the Ethics Committee of Nanjing Medical University and all experimental methods were carried out in accordance with approved guidelines of Nanjing Medical University.
RT-PCR and qPCR analysis
Total RNA was extracted from cell lines and 20 fresh HCC tissues and corresponding adjacent non-cancerous tissues using the Trizol reagent (Life Technologies, Inc., Grand Island, NY) according to the manufacturer's guidelines for performing RT-PCR and qPCR analysis, respectively. The prepared RNA (5 μg) was mixed with oligo-dT primers and reverse-transcribed with MMLV reverse transcriptase (Promega, United States). The primers for MAGE-A9 were as follows: forward primer 5′- CAC TGT ATG TCA TCT CTG -3′; reverse primer 5′- ACT ACT GTC ATT CAT TAA CT -3′. For RT-PCR, the transcription levels of β-actin served as a loading control and the primers for β-actin were as follows: forward 5′- CTC CAT CCT GGC CTC GCT GT-3′, reverse 5′- GCT GCT ACC TTC ACC GTT CC-3′. For qPCR, the glyceraldehyde 3-phosphate dehydrogenase (GAPDH) mRNA level was used to standardize the measurements of the target gene and the primers for GAPDH were as follows: forward primer 5′-TGC ACC ACC AAC TGC TTA GC-3′ and reverse primer 3′-GGC ATG GAC TGT GGT CAT GAG-5′. PCR amplification was executed in 20 μL using a thermocycler (Biometra, Germany). A SensiMixTM One-Step Kit (Quantace, Berlin, Germany) was employed to carry out qPCR analysis with a Real Time PCR system (Bio-Rad Laboratories, Hercules, CA) according to the standard protocol. Total RNA extraction, amplification conditions, RT-PCR and one-step qPCR procedure were described in our previous publication26,27.
TMA construction and IHC analysis
100 HCC tissues and matched non-cancerous tissues were prepared and TMA was produced by Alenabio Biotech Co., Ltd (Xi'an, China). Core tissue biopsies (2 mm in diameter) were taken from individual paraffin-embedded sections and arranged in the new recipient paraffin blocks. The TMA was cut into 4 μm sections and placed on super frost charged glass microscope slides. IHC analysis was performed as described previously1,26. TMA sections were incubated with a primary monoclonal mouse anti-MAGE-A9 antibody (1:250, Abcam, England) in phosphate-buffered saline (PBS) and then incubated with horseradish peroxidase-conjugated antibody (Santa Cruz Biotechnology, Santa Cruz, CA, USA) after washing. Negative controls were included by replacement of the primary antibody with PBS.
MAGE-A9 immunostaining was scored by two independent pathologists according to intensity and percentage of MAGE-A9-positive cells. Staining intensity was scored as follows: 0 (negative), 1 (weakly positive), 2 (moderately positive), and 3 (strongly positive). The percentage of MAGE-A9-positive cells was also scored according to 4 categories, in which 1 was given for 0–10%, 2 for 11–50%, 3 for 51–80%, and 4 for 81–100%. The product of the intensity and percentage scores gave rise to the final staining score. The degree of MAGE-A9 staining was quantified using a two-level grading system as follows: <3 indicates low or no expression while 3–9 indicates high expression. The cutoff point for the MAGE-A9 expression score that was statistically significant in terms of survival was set using the X-tile software program (The Rimm Lab at Yale University; http://www.tissuearray.org/rimmlab) as described previously28.
Statistical analysis
The MAGE-A9 mRNA expression in fresh HCC tissues compared with matched non-cancerous tissues was analyzed with the Wilcoxon signed rank nonparametric test. The significance of MAGE-A9 protein expression on clinical parameters of HCC was detected by chi-square test. Univariate and multivariate analyses were performed using Cox proportional hazards regression models to identify important factors that statistically associated with disease-free survival and overall survival status. The Kaplan-Meier method was employed to explore the associations between MAGE-A9 expression and the outcome of HCC patients. For all tests, the significance level for statistical analysis was set at p < 0.05. All the statistical analyses were conducted by using STATA Version 12.0 (Stata Corporation, College Station, TX, USA) and SPSS 16.0 (SPSS Inc, Chicago, IL).
Author Contributions
Y.M. and J.Z. designed the study; X.F.G., M.Y.F., Z.J.G. and F.Z. collected the tissue samples; Y.M., F.Z., X.J.T., X.F.G. and M.Y.F. executed the RT-PCR and qPCR test; L.X., J.L. and L.Q. performed and evaluated the IHC analysis; Z.J.G., Y.Q.D., H.H.N., W.Z. and Y.F.Z. collected clinical data and participated in the evaluation of the IHC data; Y.M. drafted the manuscript; Y.M. and J.Z. supervised the study. All authors read and approved the final manuscript.
Acknowledgments
This work is supported by the grants from the National Natural Science Foundation for Youth of China (No.81301951).
References
- Fu M. et al. High expression of inositol polyphosphate phosphatase-like 1 associates with unfavorable survival in hepatocellular carcinoma. Int. J. Clin. Exp. Pathol. 6, 2515–2522 (2013). [PMC free article] [PubMed] [Google Scholar]
- Xie C. et al. Interferon-beta gene-modified human bone marrow mesenchymal stem cells attenuate hepatocellular carcinoma through inhibiting AKT/FOXO3a pathway. Br. J. Cancer 109, 1198–1205 (2013). [DOI] [PMC free article] [PubMed] [Google Scholar]
- Guo X., Jin Y., Qian G. & Tu H. Sequential accumulation of the mutations in core promoter of hepatitis B virus is associated with the development of hepatocellular carcinoma in Qidong, China. J. Hepatol. 49, 718–725 (2008). [DOI] [PubMed] [Google Scholar]
- Poon D. et al. Management of hepatocellular carcinoma in Asia: consensus statement from the Asian Oncology Summit 2009. Lancet Oncol. 10, 1111–1118 (2009). [DOI] [PubMed] [Google Scholar]
- Siegel R., Naishadham D. & Jemal A. Cancer statistics, 2013. CA Cancer J. Clin. 63, 11–30 (2013). [DOI] [PubMed] [Google Scholar]
- Marrero J. A. & El-Serag H. B. Alpha-fetoprotein should be included in the hepatocellular carcinoma surveillance guidelines of the American Association for the Study of Liver Diseases. Hepatology 53, 1060–1061; author reply 1061–1062 (2011). [DOI] [PubMed] [Google Scholar]
- Sang M., Lian Y., Zhou X. & Shan B. MAGE-A family: attractive targets for cancer immunotherapy. Vaccine 29, 8496–8500 (2011). [DOI] [PubMed] [Google Scholar]
- Chung F. Y. et al. Differential gene expression profile of MAGE family in taiwanese patients with colorectal cancer. J. Surg. Oncol. 102, 148–153 (2010). [DOI] [PubMed] [Google Scholar]
- Meek D. W. & Marcar L. MAGE-A antigens as targets in tumour therapy. Cancer Lett. 324, 126–132 (2012). [DOI] [PubMed] [Google Scholar]
- Cameron B. J. et al. Identification of a Titin-derived HLA-A1-presented peptide as a cross-reactive target for engineered MAGE A3-directed T cells. Sci. Transl. Med. 5, 197ra103 (2013). [DOI] [PMC free article] [PubMed] [Google Scholar]
- Lin H. et al. Selection and characterization of human anti-MAGE-A1 scFv and immunotoxin. Anticancer Agents Med. Chem. 13, 1259–1266 (2013). [DOI] [PubMed] [Google Scholar]
- Straetemans T. et al. TCR gene transfer: MAGE-C2/HLA-A2 and MAGE-A3/HLA-DP4 epitopes as melanoma-specific immune targets. Clin. Dev. Immunol. 2012, 586314 (2012). [DOI] [PMC free article] [PubMed] [Google Scholar]
- Hamai A. et al. Expression of MAGE-A antigens is frequent in triple-negative breast cancers but does not correlate with that of basal-like markers. Ann. Oncol. 22, 986–987 (2011). [DOI] [PubMed] [Google Scholar]
- Bergeron A. et al. High frequency of MAGE-A4 and MAGE-A9 expression in high-risk bladder cancer. Int. J. Cancer 125, 1365–1371 (2009). [DOI] [PubMed] [Google Scholar]
- Hatiboglu G. et al. Prognostic value of melanoma-associated antigen A9 in renal cell carcinoma. Scand J Urol 47, 311–322 (2013). [DOI] [PubMed] [Google Scholar]
- Tsai J. R. et al. Differential expression profile of MAGE family in non-small-cell lung cancer. Lung Cancer 56, 185–192 (2007). [DOI] [PubMed] [Google Scholar]
- Forghanifard M. M. et al. Cancer-testis gene expression profiling in esophageal squamous cell carcinoma: identification of specific tumor marker and potential targets for immunotherapy. Cancer Biol. Ther. 12, 191–197 (2011). [DOI] [PubMed] [Google Scholar]
- Mellstedt H., Vansteenkiste J. & Thatcher N. Vaccines for the treatment of non-small cell lung cancer: investigational approaches and clinical experience. Lung Cancer 73, 11–17 (2011). [DOI] [PubMed] [Google Scholar]
- Nardiello T. et al. MAGE-A inhibits apoptosis in proliferating myeloma cells through repression of Bax and maintenance of survivin. Clin. Cancer. Res. 17, 4309–4319 (2011). [DOI] [PMC free article] [PubMed] [Google Scholar]
- Marcar L., Maclaine N. J., Hupp T. R. & Meek D. W. Mage-A cancer/testis antigens inhibit p53 function by blocking its interaction with chromatin. Cancer Res. 70, 10362–10370 (2010). [DOI] [PubMed] [Google Scholar]
- Picard V., Bergeron A., Larue H. & Fradet Y. MAGE-A9 mRNA and protein expression in bladder cancer. Int. J. Cancer 120, 2170–2177 (2007). [DOI] [PubMed] [Google Scholar]
- Fisher L. D. & Lin D. Y. Time-dependent covariates in the Cox proportional-hazards regression model. Annu. Rev. Public Health 20, 145–157 (1999). [DOI] [PubMed] [Google Scholar]
- Kim S. H. et al. Expression of cancer-testis antigens MAGE-A3/6 and NY-ESO-1 in non-small-cell lung carcinomas and their relationship with immune cell infiltration. Lung 187, 401–411 (2009). [DOI] [PubMed] [Google Scholar]
- Lin J. et al. Melanoma-associated antigens in esophageal adenocarcinoma: identification of novel MAGE-A10 splice variants. Clin. Cancer. Res. 10, 5708–5716 (2004). [DOI] [PubMed] [Google Scholar]
- Varotti G. et al. Comparison between the fifth and sixth editions of the AJCC/UICC TNM staging systems for hepatocellular carcinoma: multicentric study on 393 cirrhotic resected patients. Eur. J. Surg. Oncol. 31, 760–767 (2005). [DOI] [PubMed] [Google Scholar]
- Fu M. et al. Elevated expression of SHIP2 correlates with poor prognosis in non-small cell lung cancer. Int. J. Clin. Exp. Pathol. 6, 2185–2191 (2013). [PMC free article] [PubMed] [Google Scholar]
- Mao Y. et al. Alpha B-crystallin is a new prognostic marker for laryngeal squamous cell carcinoma. J. Exp. Clin. Cancer Res. 31, 101 (2012). [DOI] [PMC free article] [PubMed] [Google Scholar]
- Huang J. et al. VCAM1 expression correlated with tumorigenesis and poor prognosis in high grade serous ovarian cancer. Am J Transl Res 5, 336–346 (2013). [PMC free article] [PubMed] [Google Scholar]