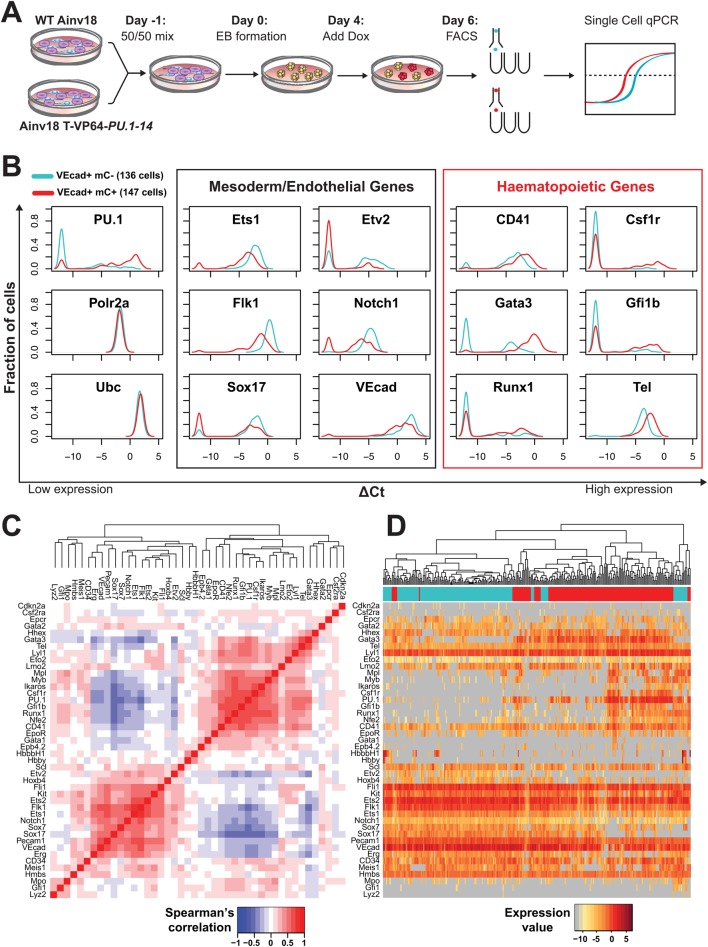
Fig. 3.
Single-cell analysis of TALE-mediated PU.1 expression in haematopoietic precursors. (A) Strategy for single-cell gene expression analysis of TALE-mediated perturbations. Wild-type (WT) Ainv18 and T-VP64-PU.1-14-targeted ESCs were passaged once as a 1:1 mix before EB formation. Dox was added at day 4 and EBs disaggregated at day 6. Single VEcad+ cells (mCherry+ and mCherry− sorted as T-VP64-PU.1-14-expressing and WT, respectively) were sorted into lysis buffer. Single-tube reverse transcription and targeted pre-amplification were undertaken, followed by multiplexed qPCR gene expression analysis using the Fluidigm Biomark platform. (B) Density plots of gene expression in day 6 EB VEcad+ mCherry− (136 WT Ainv18; cyan) and VEcad+ mCherry+ (147 T-VP64-PU.1-14 expressing; red) cells. The density indicates the fraction of cells at each expression level, relative to housekeeping genes (Polr2a and Ubc). Cells with non-detected gene expression were set to –12. See supplementary material Fig. S3 for density plots for all 48 genes analysed in these two populations. (C) Hierarchical clustering of Spearman rank correlations between all pairs of genes (excluding housekeepers) from all 283 VEcad+ cells (red, positive correlation; blue, negative correlation). (D) Hierarchical clustering of the 283 VEcad+ cells according to gene expression, with genes ordered according to C (dark red, highly expressed; grey, non-expressed). Top bar indicates cell type: cyan, mCherry−; red, mCherry+.

