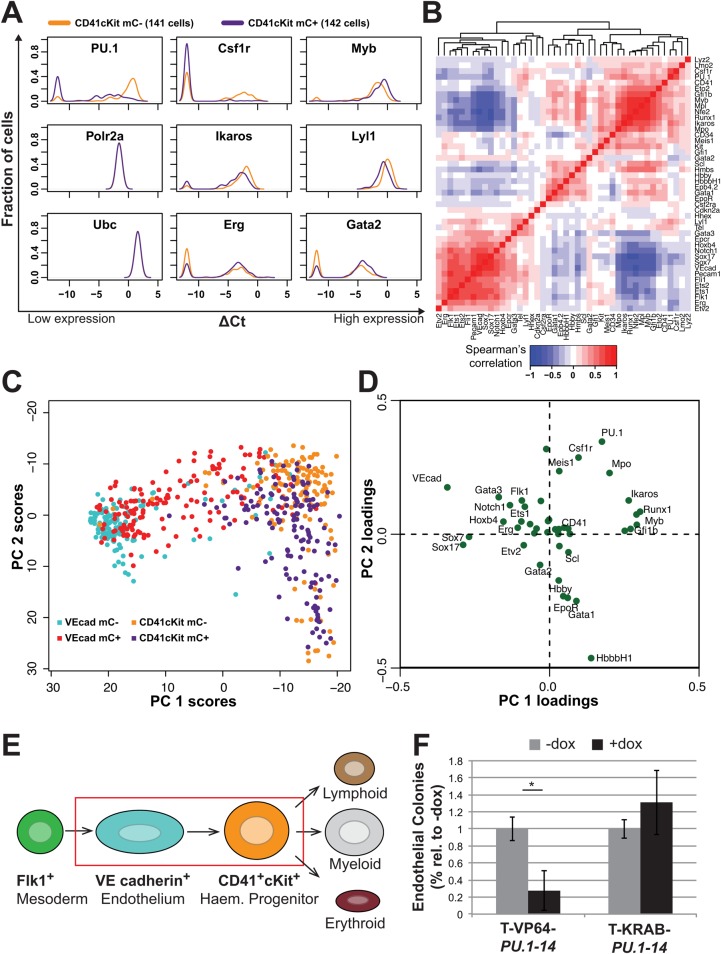
Fig. 4.
TALE-mediated expression perturbations suggest transcriptional interactions during blood specification. (A) Density plots of gene expression in day 6 EB CD41+ cKithi (CD41cKit) mCherry− (141 WT Ainv18; orange) and CD41cKit mCherry+ (142 Ainv18 expressing T-KRAB-PU.1-14; purple) cells. The density indicates the fraction of cells at each expression level, relative to housekeeping genes (Polr2a and Ubc). Cells with non-detected gene expression were set to –12. See supplementary material Fig. S4 for density plots for all 48 genes analysed in these two populations. (B) Hierarchical clustering of Spearman rank correlations between all pairs of genes (excluding housekeepers) using gene expression data from all 566 cells (VEcad+ and CD41cKit). (C) Principal component analysis (PCA) of the 566 VEcad+ and CD41cKit cells, in the first and second components, from the expression of all 44 genes (excluding the four housekeeping genes). (D) Principal component loadings indicate the extent to which each gene contributes to the separation of cells along each component in C. (E) Current model of definitive haematopoietic specification from Flk1+ mesoderm through a haemogenic endothelial precursor to a haematopoietic stem/progenitor that can differentiate into lymphoid, myeloid or erythroid lineages. (F) Endothelial potential of TALE-expressing VEcad+ cells, as a percentage of –dox control cells. *P<0.01 (Student's t-test), from three biological replicates.

