Fig. 7.
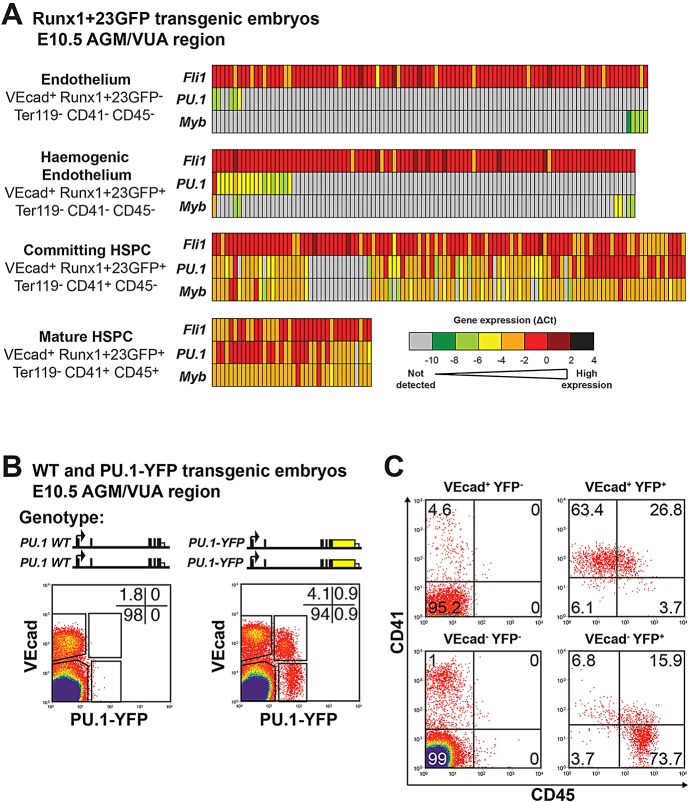
PU.1 expression is induced during the EHT in vivo. (A) Fli1, PU.1 and Myb single-cell RT-qPCR gene expression data from Swiers et al. (2013) in the AGM region and vitelline and umbilical artery (AGM+VUA) for VEcad+ cell populations from E10.5 embryos carrying a Runx1+23kb-GFP enhancer reporter. Gene expression levels are displayed as a heatmap of ΔCt relative to housekeeping genes (Ubc and Atp5a1). (B) Genotype schematics and flow cytometry plots displaying VEcad versus PU.1-YFP expression for the Ter119− (Ly76−) cell population from the AGM+VUA of E10.5 WT (left) and homozygous PU.1-YFP transgenic (right) embryos. Data were collected from pooled embryos and are representative of two E10-10.5 embryo litters. (C) Flow cytometry plots displaying CD41 versus CD45 expression for the populations within the VEcad/PU.1-YFP gates in B for the homozygous PU.1-YFP transgenic embryos.

