Version Changes
Revised. Amendments from Version 1
In response to reviewers’ comments we have added text in the first ( Both questionnaires … was clear) and the last paragraph of “Methods: Survey questionnaires” section ( The participants’ population … 45% were smokers [17]). In the “Methods: The Intervention” section (1st paragraph) we have tried to excuse the choice of the Health Belief Model in our setting ( The choice of the HBM … questionnaire analysis (see below, program phase 3). In discussion section we have elaborated (i) the “vacations” issue (1st paragraph : national holidays … by Greek orthodox religion)); (ii) we have tried to answer the reason why the Diet-Health relationship, showed the least significant change following the intervention (2nd paragraph: As already discussed emphasis … to control health risks.); and, (iii) we have added study limitations and recommendations (3rd paragraph: The good general health …to enhance the validity of the data). The Supplemental files (Q1 and Q2) which were presented inversely from their description in text have been reversed and a footnote under Table 4 was added.
Abstract
Objective: To estimate the effectiveness of a short-term educational-counseling worksite program focused on lipid intake, by monitoring the possible change on nutrition knowledge and eating habits.
Methods: an 8-week educational program based on the Health Belief Model was implemented in a honey packaging and sales company in Greece. 20 out of the 29 employees initially enrolled completed the program. Knowledge level and eating habits were evaluated prior and after the intervention by the “Nutrition Knowledge Questionnaire” and the “Food Habits Questionnaire”. ANOVA, Spearman rho test and paired Wilcoxon test were employed in statistical analysis.
Results: Non smokers and those with higher educational level had healthier eating habits. Knowledge following the intervention was significantly improved concerning recommendations and basic food ingredients but as far as eating habits were concerned, scores were not improved significantly, while intake of fried food was increased.
Conclusions and Implications: Short-term interventions may produce substantial improvement in knowledge but not necessarily modifications in unhealthy eating habits.
Introduction
Over the last decades, obesity has rapidly turned into a global epidemic in both developed and developing countries, affecting adults, children and adolescents as well. Currently, the number of people suffering from obesity is estimated at approximately 400 million people worldwide 1. Moreover, increased body mass index (BMI) is associated with higher risk of cardiovascular diseases, some types of cancer and type II diabetes 2– 4. Recent data from Greece have shown obesity is an epidemic problem 5, 6. In recent years, Greeks have abandoned the traditional Mediterranean diet; one study reports that only 33% of Greek men and 43% of Greek women adhere to a traditional Mediterranean diet 7.
Among various individual and lifestyle factors, many work-related factors are responsible for the modification of dietary patterns including working conditions, such as: working overtime, high job demands, occupational stress and others 8. On the other hand, the workplace has been identified as a promising setting for health promotion although the findings of many worksite health promotion (WHP) programs indicate that these programs are associated with only moderate improvement in dietary intake 9. Furthermore, it was shown that diet mediterranisation is feasible in a food-at-work intervention, affecting lunch consumption at the workers canteen 10. However in a systematic review, participation levels in health promotion interventions at the workplace were typically below 50% 11.
The purpose of the present study was to evaluate the effectiveness of an educational worksite intervention focused on lowering fat intake, by affecting nutrition knowledge and eating habits.
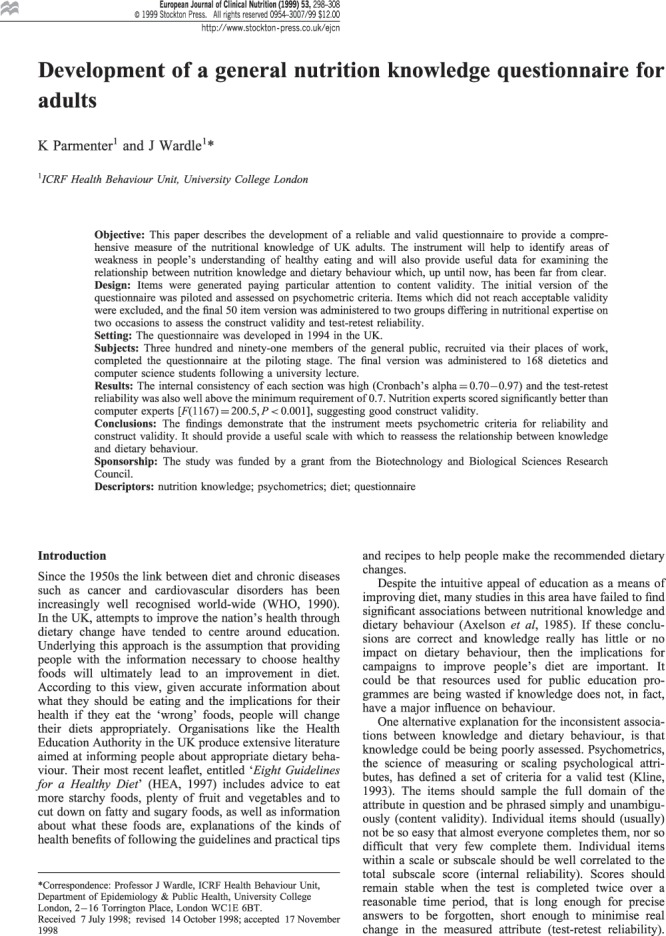
Methods
Study population
The 48 employees working in the factory premises of a honey company, were asked to participate in this study. Most of the 48 employees were employed in jobs that required mild to moderate manual and intellectual activity (blue collar workers) and five were employed as food scientists and technologists, and supervisors. No inclusion or exclusion criteria were used and as there were no medical contraindications for participation in the program, as judged by the occupational health physician, all employees were eligible for participation. Twenty-nine employees responded positively (60%) to the invitation and gave their written informed consent. The Medical School Review Board judged that further approval was not required, since this program was under the occupational physician’s supervision and control. During the program, seven employees failed to attend day 2 and/or 3 and another two did not return the final questionnaires and all nine were excluded from the final analysis (see Table 1).
Table 1. Description of the health promotion program.
| Phase | Description | Duration | Participants |
|---|---|---|---|
| 0 | Informing workers about the health promotion program | 0.5 h | 48 |
| 1: day 1 | Presentation and distribution of the questionnaires
Measurements of blood pressure/weight/height |
1.5 h | 29 |
| 2: day 16 | Lecture, discussion, distribution of printed material | 2 h | 24 |
| 3: day 23 | Issues derived from questionnaire analysis (knowledge gaps)
Restrictive factors and alternative suggestions (bad habits) |
2 h | 20 |
| 4: day 45 | Redistribution of the questionnaires | 0.5 h | 20 |
| 5: day 52 | Final meeting, results presentation, individual counseling | 3 h | 20 |
Survey questionnaires
Initially, all employees were informed about the program and were asked to participate by signing informed consent. Two questionnaires were used in order to estimate (Q1) the employees’ nutrition knowledge level and (Q2) their eating habits (see Supplementary File Q1 and Supplementary File Q2). The questionnaires were translated into Greek by two bilingual expert nutritionists and were piloted in 10 college students and blue collar employees for linguistic validation. Both questionnaires in the pre- and post- intervention phase were self-administered. In order to avoid any confusion or misunderstanding, especially in the “Diet Habits” questionnaire (a part of which is proposed to be administered by an interviewer), we had previously explained the way of answering the questionnaire by the means of an oral presentation and we had also reformatted that part of the “Diet Habits” questionnaire so that the sequence of questions/answers was clear.
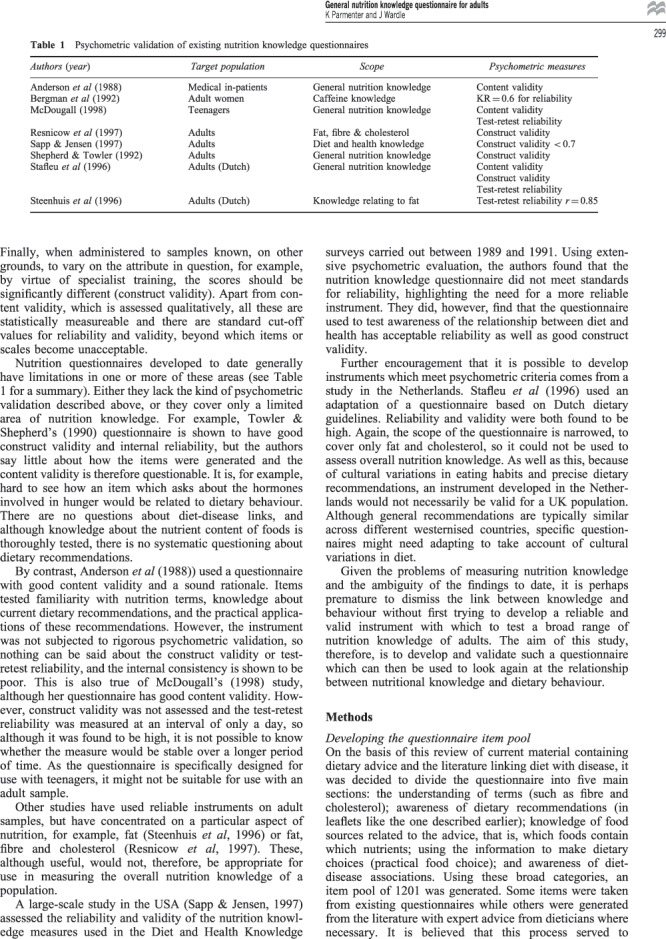
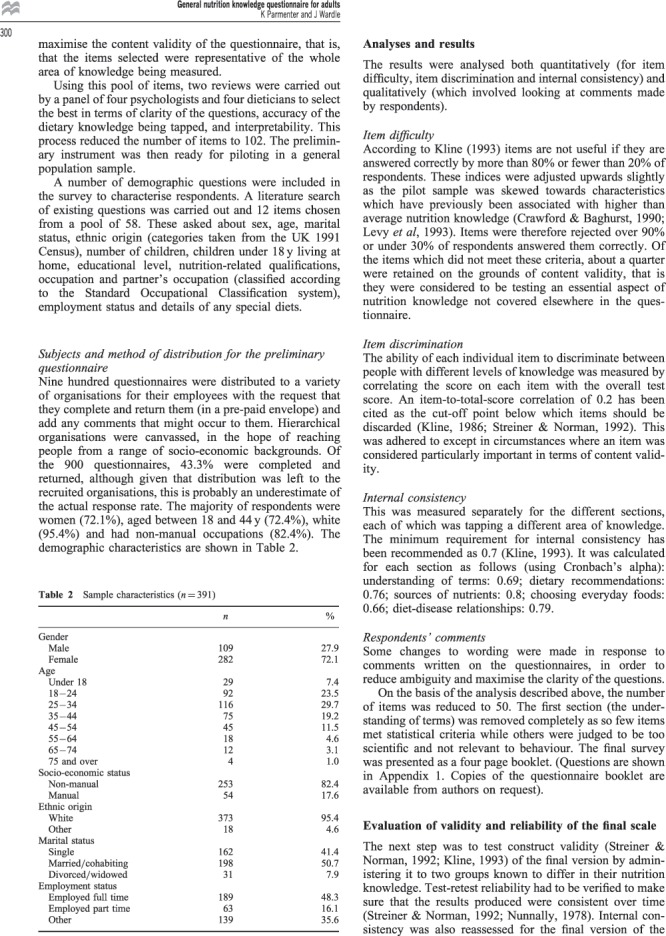
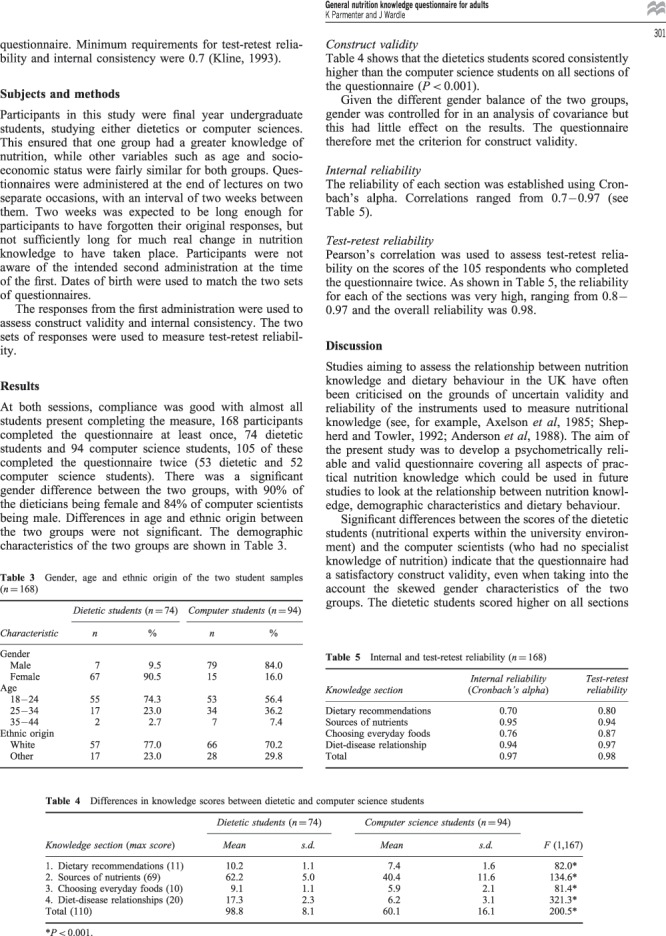
Nutrition knowledge was assessed using the “ Nutrition Knowledge Questionnaire” (see Supplementary File Q1) 12. The questionnaire covers four sections: (i) knowledge on experts' recommendations regarding the optimum intake of different food groups (maximum score: 11); (ii) nutrient knowledge, (maximum score: 69); (iii) food choice (which asks people to choose between different options, e.g. to pick the snack that is low in fat and high in fibers), (maximum score: 10); and (iv) the relationships between diet and disease (maximum score: 20). This last section looks at beliefs about the associations between food type, food quantity and diseases.
The eating habits of the participants were assessed by the “ Food Habits Questionnaire” (see Supplementary File Q2) 13, 14, which has been widely used to estimate dietary changes 15, 16. Questions were rated on a 4-point scale, where 1 reflects the healthiest and 4 the unhealthiest eating habits, respectively. The questionnaire included five sections regarding the following habits: (i) replacing high fat foods with low fat substitutes (score range: 7–28); (ii) modifying high fat foods, e.g. fat removal from meat (score range: 3–12); (iii) avoiding high fat cooking methods (fried food) (score range: 4–16); (iv) consumption of fresh fruit and vegetables as a snack (score range: 3–12); and (v) choosing specially manufactured low fat foods products instead of high fat ones (score range: 5–20). The total score of eating habits is calculated from the sum of section scores divided by 5 (ranged from 4.4 to 17).
Data on age, family status, children, educational level, job position, smoking habit, BMI, arterial blood pressure and number of cigarettes/years of smoking were also collected (see Table 2). The participants’ population reflects sufficiently the general healthy Greek population given that almost 40% of them were overweight or obese and 45% were smokers 17.
Table 2. Demographic and individual characteristics of the intervention group (n=20).
| Demographic characteristics | |
| Age in years (mean ± SD) | 44.6 ± 9.1 |
| ≤ 35 (n (%)) | 4 (20) |
| 36–44 | 6 (30) |
| ≥ 45 | 10 (50) |
| Female (n (%)) | 18 (90) |
| Family status (n (%)) | |
| Married, living with other people | 18 (90) |
| Divorced, living alone | 2 (10) |
| Parenthood (n (%)) | 19 (95) |
| Educational level (n (%)) | |
| < 6 years (elementary) | 7 (35) |
| 6–9 years (basic) | 4 (20) |
| 9–12 years (high or technical school) | 7 (35) |
| > 12 years | 2 (10) |
| Individual characteristics | |
| ΒΜΙ kg/m 2 (mean ± SD) | 26.5 ± 6.2 |
| < 25 kg/m 2 (n, %) | 11 (61) |
| 25–29.9 kg/m 2 (n,%) | 4 (22) |
| > 30 kg/m 2 (n, %) | 3 (17) |
| Smoking | |
| Smoker (n, %) | 9 (45) |
| Pack-years (mean ± SD) | 8.9 ± 11.6 |
| Non smokers (n, %) | 11 (55) |
The intervention
The intervention took place in three distinct phases over a total of 7–8 weeks ( Table 1) and it was based on the Health Belief Model which suggests that health behaviors are determined by health beliefs and readiness to take action. Behavioral theory has increasingly been used to guide nutrition research to improve intervention efficacy. The Health Belief Model was developed in the 1950s to explain health behavior associated with the failure of people to participate in programs that would reduce disease risk. Constructs central to the HBM consist of perceived susceptibility, perceived severity, perceived benefits, perceived barriers, and other mediating variables. The construct of self-efficacy is frequently included in applications of the HBM 18, 19. The choice of the HBM was based both on the specific environmental context and on previous requests of employees on ways towards healthy eating choices and habits, both at work and home. Their interest was mostly healthy choices and on their relevant barriers and less on obesity or disease related risk perception. The environmental context, which is considered equally important in worksite health promotion interventions, was not addressed in our study since almost all employees, during the paid 30 minute meal break, were using homemade food or snacks. A well-equipped and sufficiently large eating room and kitchen was available, so that employees could heat, store safely and consume their own food. Consequently, we have tried to combine the educational measures with suggestions on strategies for change i.e. restrictive factors and bad habits and other issues derived from questionnaire analysis (see below, program phase 3).
In our program (Phase 1), all employees who initially responded to the invitation attended a 30 minute meeting in which a brief presentation of the self-administered questionnaires was done and instructions about the proper completion of both questionnaires were given. Further clarifications were answered the following days during the collection, where necessary. Data on individual characteristics (age, marital status, children, education, smoking status etc.), were also collected and blood pressure, weight and height of the subjects were measured (Seca® 764, Sigma Medical Co, Athens, Greece) at the end of the meeting. Completed questionnaires were collected, recorded in an electronic database and statistically analyzed. In Phase 2, 15 days after the questionnaires were initially distributed, a 45-minute lecture on healthy eating and mediterranean diet was held followed by discussion and distribution of printed material with practical proposals for adoption of healthier eating habits. Overall, the whole session lasted approximately two hours. A week later a second meeting took place (Phase 3) in order to discuss and clarify issues derived from the conclusions of the initial analysis. Specifically, knowledge gaps and restrictive factors for the adoption of healthier nutritional choices were further discussed. The intervention was completed 22 days later (Phase 4) when the participants were asked to fill in the questionnaires again. In the last phase (5 th), a final meeting took place to present and discuss the results, and for individual counseling by the research team.
Statistical analysis
Analysis of variance (ANOVA) was used to reveal statistically significant differences among various subgroups. Due to the small sample, Spearman rho test was used to examine correlations of the quantitative variables while the paired signed Wilcoxon test was used to compare average values of continuous variables for each category of nominal variables in the intervention group (before and after). A p-value of <0.05 was considered statistically significant. Statistical processing and data analysis were performed using commercial software (SPSS version 16.0, SPSS Inc., 2007).
Results
General characteristics of the study population
From the 29 workers who initially responded positively, 20 workers (67%) attended all phases and completed the WHP program ( Table 1). Losses were mainly due to absences on the days of intervention, or inability or failure to return the study questionnaires in time. Between the final and initial groups there were no significant differences in any of the variables.
Analysis of the knowledge questionnaire, returned by the 29 workers who initially responded, showed a lack of knowledge of food composition in saturated fat, fibers, and salt, of the origin of fatty acids (monosaturated, polysaturated and saturated) and of the sources of antioxidant vitamins. Education level correlated significantly with the partial score, i.e. the higher the education level the higher the scores.
Analysis of the habits questionnaire showed that dietary habits included medium to large consumption of fatty foods. However, the score of the workers corresponding to the avoidance of fried foods was pretty high, reaching almost the excellent level. No significant correlations were found between variables under study and the two first subscales (replacement of fatty foods and meat modification). Men, people living with others, and those without children had a tendency to avoid the more fatty substances. Meanwhile, women consumed less fried foods.
Post-intervention analysis was done in the 20 workers who had participated in all phases. Table 2 shows the demographic and individual characteristics of these workers. Women and blue collar workers accounted for 90% and 95%, respectively, a fact that limits the possibility of revealing significant effects of these variables (sex and job title) on the results of the intervention.
As expected, there were significant correlations between the sections (scales) of the two questionnaires prior to, and following, the intervention. By contrast, between the different questionnaires, scales were less and weakly correlated with the exemption of the group of the avoidance of fatty substances. Very high Cronbach alpha score (above 0,80) shows satisfactory reliability of all subscales of both questionnaires. Table 3 presents the scores per category (section) of nutritional knowledge prior to, and following, the intervention in the 20 workers. Significant improvement was seen in the sections of “ dietary recommendations”, in “ basic food ingredients” and in the total score. Prior to intervention, non-smokers had higher (better) scores concerning the subscales of the “ basic food ingredients” (41.0 vs 33.1, p=0.08) and the “ selection of healthier foods” (6.2 vs 4.8, p=0.06) but these differences did not reach statistical significance. Following the intervention, non-smokers improved more in the “ selection of healthier foods” (6.8 vs 5.2, p=0.04).
Table 3. Score comparison of population distribution per knowledge category prior to and following the intervention (n=20).
| Knowledge
category |
Max score | Prior to the intervention | Following the intervention | Paired difference | ||||||
|---|---|---|---|---|---|---|---|---|---|---|
| Median | Mean | SD | Median | Mean | SD | Mean | 95% CI | p-value | ||
| Dietary
recommendations |
11 | 7 | 7.13 | 1.81 | 8 | 8.00 | 1.76 | -0.88 | -1.68
-0.07 |
0.035 |
| Basic food
ingredients |
69 | 39 | 37.45 | 9.99 | 48 | 44.05 | 12.01 | -6.60 | -11.85
-1.35 |
0.016 |
| Selection of
healthier foods |
10 | 6 | 5.55 | 1.70 | 6 | 6.10 | 1.74 | -0.55 | -1.33
0.23 |
0.157 |
| Diet – health
relationship |
20 | 14 | 12.50 | 4.80 | 15 | 13.20 | 4.456 | -0.70 | -2.92
1.52 |
0.518 |
| Total score | 110 | 66 | 62.63 | 15.40 | 77 | 71.35 | 16.39 | -8.73 | -15.55
-1.90 |
0.015 |
Table 4 presents the dietary habit scores prior to, and following, the intervention. The mean score was improved in the categories of “ replacement of fatty foods”, “ meat modification”, “ consumption of food and vegetables”, “ avoidance of fatty substances” and in the total score but the difference was far from significant. On the contrary in the habit of “ avoidance of fried foods”, the score was significantly worse, a paradox that might be explained by the very high initial score (tendency towards regression to the mean).
Table 4. Comparison of dietary habits score per dietary habit category prior to and following the intervention (n=20).
| Dietary habits | Max score | Prior to the intervention | Following the intervention | Paired difference | ||||||
|---|---|---|---|---|---|---|---|---|---|---|
| Median | Mean | SD | Median | Mean | SD | Mean | 95% CI | p-value | ||
| Replacement of fatty
foods |
28 | 21 | 20.11 | 7.35 | 18 | 19.15 | 6.77 | 0.97 | -2.45
4.39 |
0.560 |
| Meat modification | 12 | 5.50 | 6.88 | 3.85 | 6 | 6.60 | 2.41 | 0.28 | -1.14
1.69 |
0.690 |
| Avoidance of fried
foods |
16 | 6 | 6.12 | 1.44 | 7 | 7.03 | 1.30 | -0.92 | -1.56
-0.27 |
0.008 |
| Food and vegetables
consumption |
12 | 8.50 | 7.92 | 2.33 | 8.50 | 7.67 | 2.47 | 0.25 | -0.61
1.11 |
0.549 |
| Avoidance of fatty
substances |
20 | 13 | 13.54 | 2.95 | 13 | 13.08 | 4.20 | 0.46 | -1.39
2.31 |
0.610 |
| Total score | 88 | 11.44 | 10.84 | 2.31 | 11.79 | 10.45 | 2.60 | 0.39 | -0.62
1.40 |
0.470 |
A lower score on this assessment indicates improved/more healthy eating habits.
Workers with a normal BMI exhibited better habits compared with overweight and obese subjects in terms of “ meat modification” (4.6 vs 12.7, p=0.002). Non-smokers had lower scores compared with smokers in “ fat avoidance” (12.6 vs 15.0, p=0.06) and in “ avoidance of fried food” (6.5 vs 7.7, p=0.05).
Discussion
In the present study, a short-term intervention regarding eating knowledge and habits was implemented in a worksite. Knowledge was significantly improved following this intervention, while no significant improvement was achieved concerning dietary habits. The paradox regarding the fact that average consumption of fried, browned or breaded food (“avoidance of fried food”) increased following the intervention could be partially attributed to the very high (excellent) initial score combined with the fact that some national holidays (where meat consumption is imposed by Greek orthodox religion) also coincided with the program.
The finding that knowledge gain did not lead to habit modification may be explained by the short duration of the program and the complexity that characterizes the conscious or unconscious choices of adults. Health promotion programs in workplaces have shown to be cost-effective, especially for long-term interventions 20, 21. As already discussed emphasis was given in promoting healthy eating choices and habits as well as in overcoming the relevant barriers. The fact that the Diet-Health relationship, showed the least significant change following the intervention may be attributed to the minimal interest of employees to control health risks. In our study, a number of factors, i.e. education level, job title, family situation and smoking status was shown to be related to the level of nutrition knowledge and dietary habits. However, the small number of participants prevented these correlations to be concurrently analyzed in multivariate analysis. Other factors known to influence dietary behavior including socio-economic factors, stress and organizational factors (increased work demands, low skills motivation, overtime employment) were not analyzed in our study 22, 23 but in our setting, the population was highly homogeneous and most of these factors are not anticipated to have a significant discriminatory impact. However, recent findings show that these interventions can be easily incorporated into the daily working routine programs, and if combined with stress management programs, may result in better outcomes 24, 25.
Limitations of this study arise from the small sample size and the short duration of the program. The good general health (healthy worker effect) of participants might also have diminished their scope for demonstrating improvements while self-reporting bias seemed to have negligible effect. It would be recommended in future research in similar settings to use additional back-up measures, such as 24 hour recall diaries, in order to enhance the validity of the data. For organizational reasons, we did not attempt to allocate a control group by randomization. On the other hand, the homogeneity of the population concerning socio-economic aspects, the supportive environment, and the good relationships between colleagues are considered to minimize confounding of the different factors.
Short-term interventions may produce substantial improvement in knowledge but not necessarily accompanied by changes in unhealthy eating habits. These types of programs are not far from those commonly encountered in every day practice but do not seem to be effective in changing unhealthy eating habits. Participation by the employees in defining their needs and priorities; planning long-term interventions, and incorporating self-empowerment and stress management techniques might be necessary for cost-effective worksite health promotion programs to succeed in reducing unhealthy eating habits.
Acknowledgements
We are grateful to all the employees for their participation.
Funding Statement
During the study, DT was supported by a scholarship from Onassis Foundation while pursuing his MSc in Health Promotion and Education at the Medical School of Athens University in Athens.
The funders had no role in study design, data collection and analysis, decision to publish, or preparation of the manuscript.
v2; ref status: indexed
Supplementary File Q1: (Sheet 1).
Supplementary File Q1: (Sheet 2).
Supplementary File Q1: (Sheet 3).
Supplementary File Q1: (Sheet 4).
Supplementary File Q1: (Sheet 5).
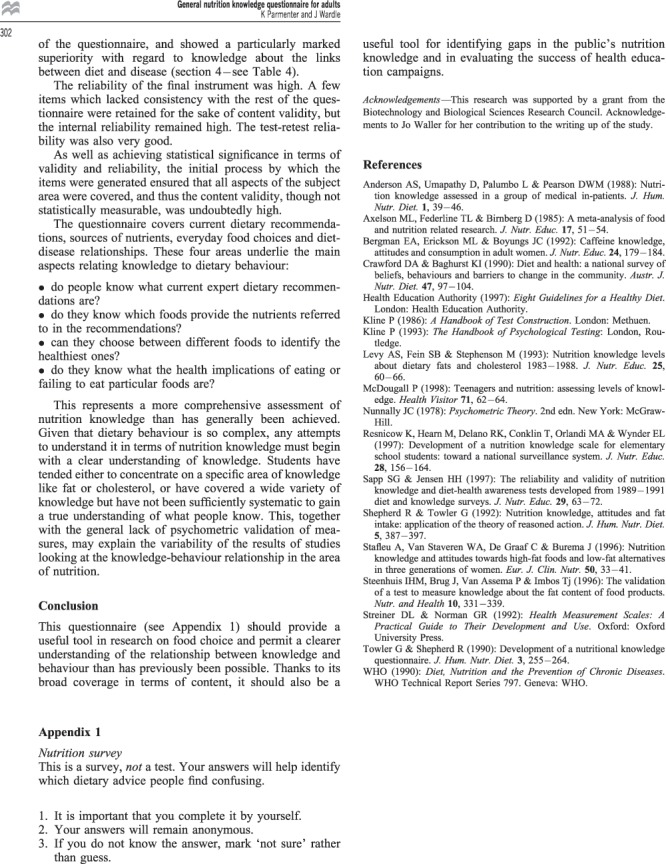
Supplementary File Q1: (Sheet 6).
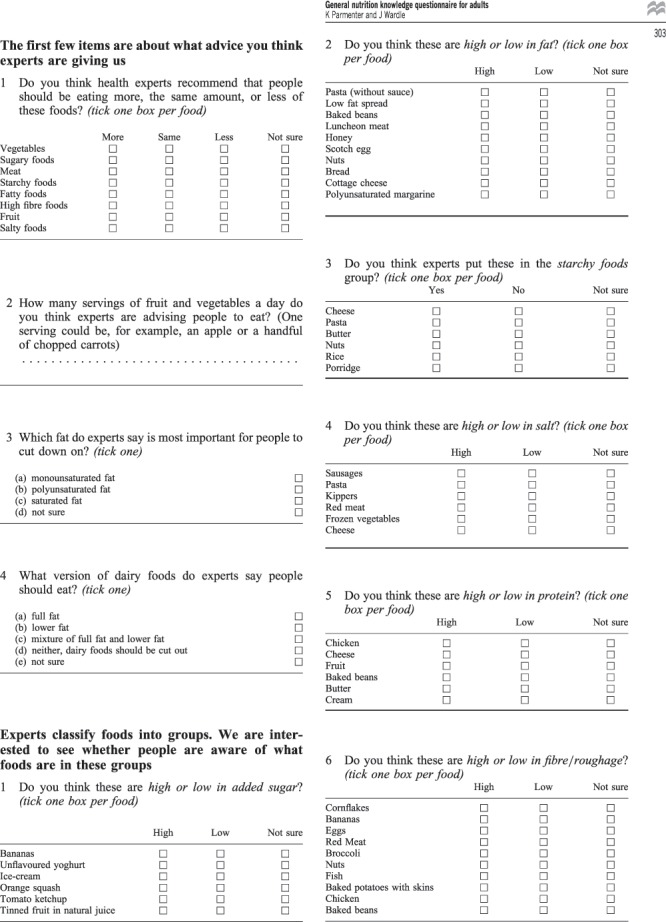
Supplementary File Q1: (Sheet 7).
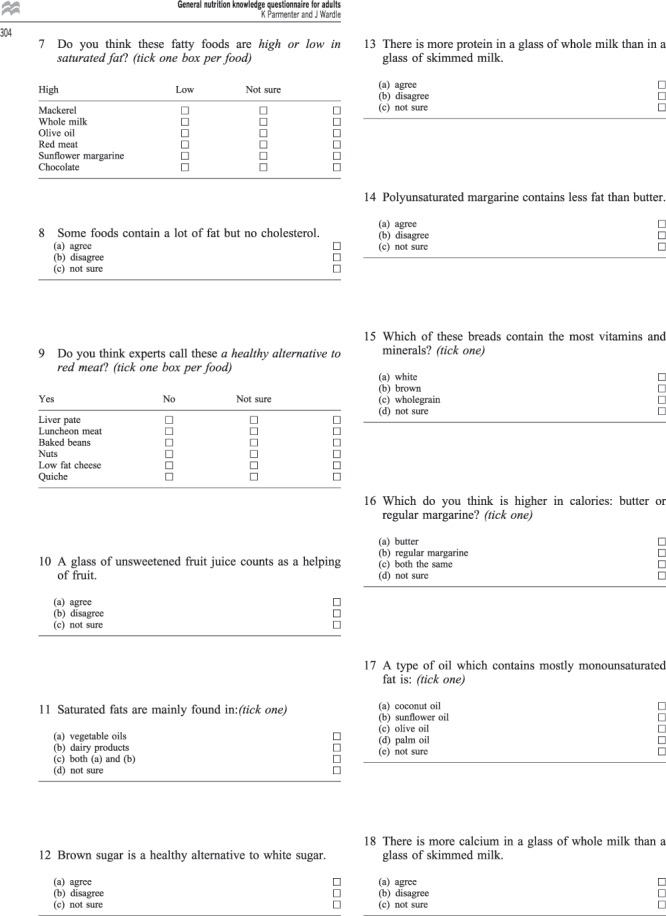
Supplementary File Q1: (Sheet 8).
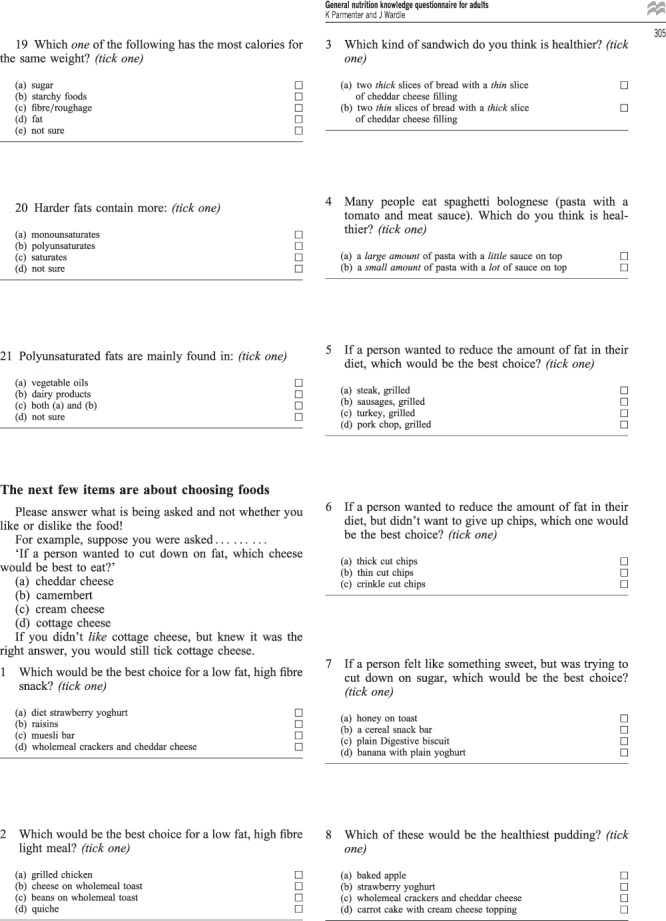
Supplementary File Q1: (Sheet 9).
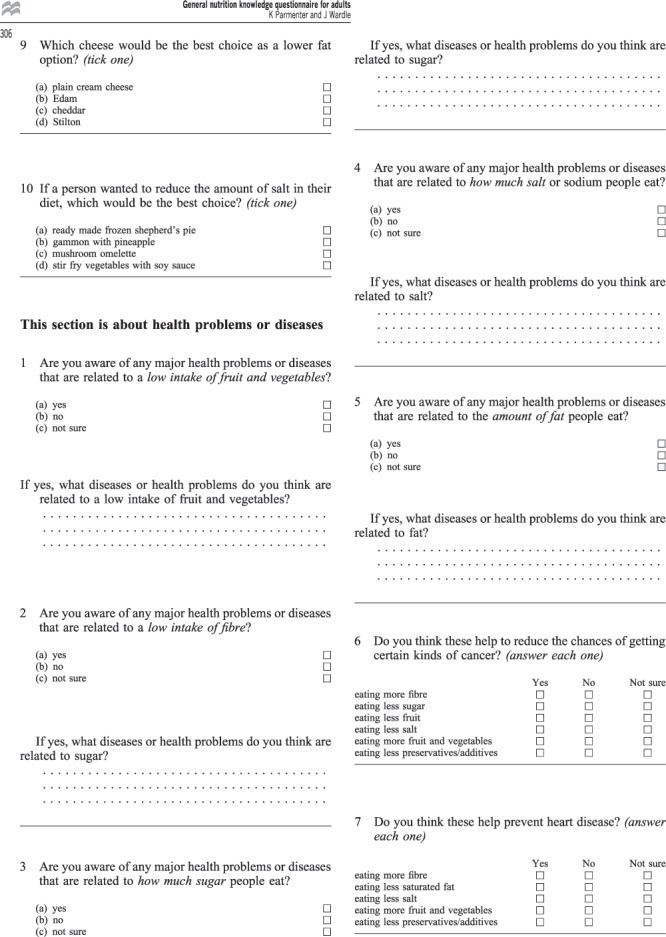
Supplementary File Q1: (Sheet 10).
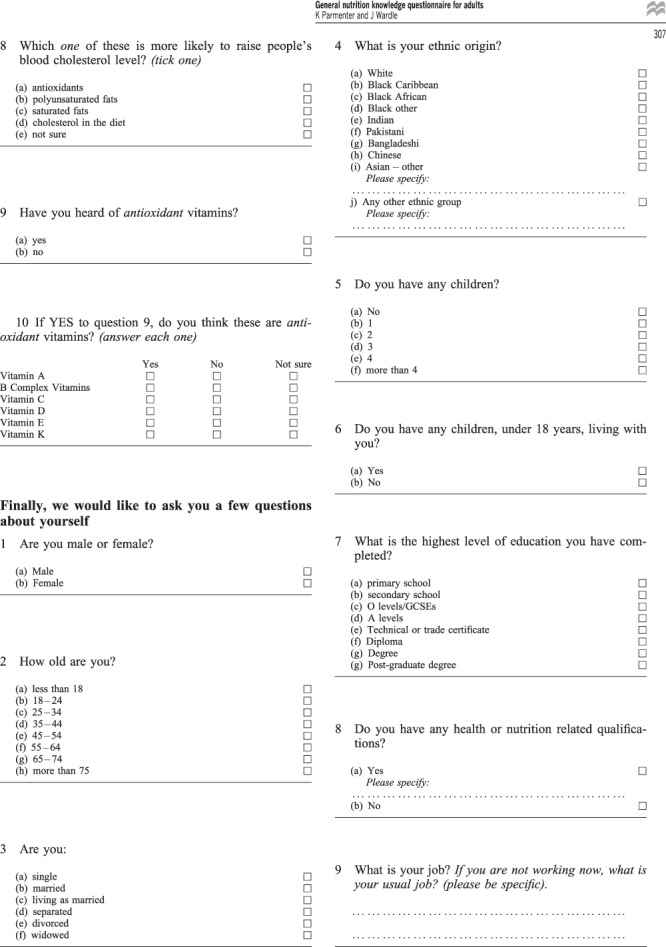
Supplementary File Q1: (Sheet 11).
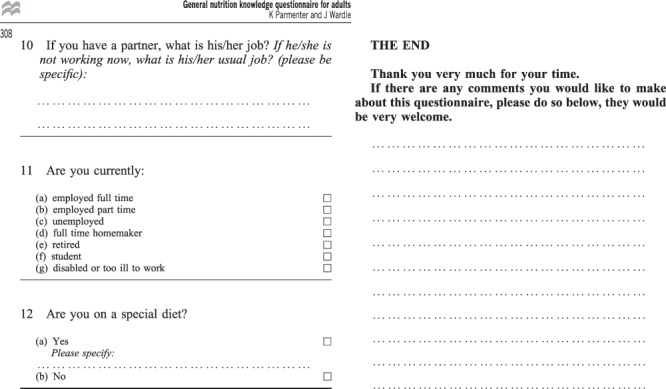
Supplementary File Q2: (Sheet 1).
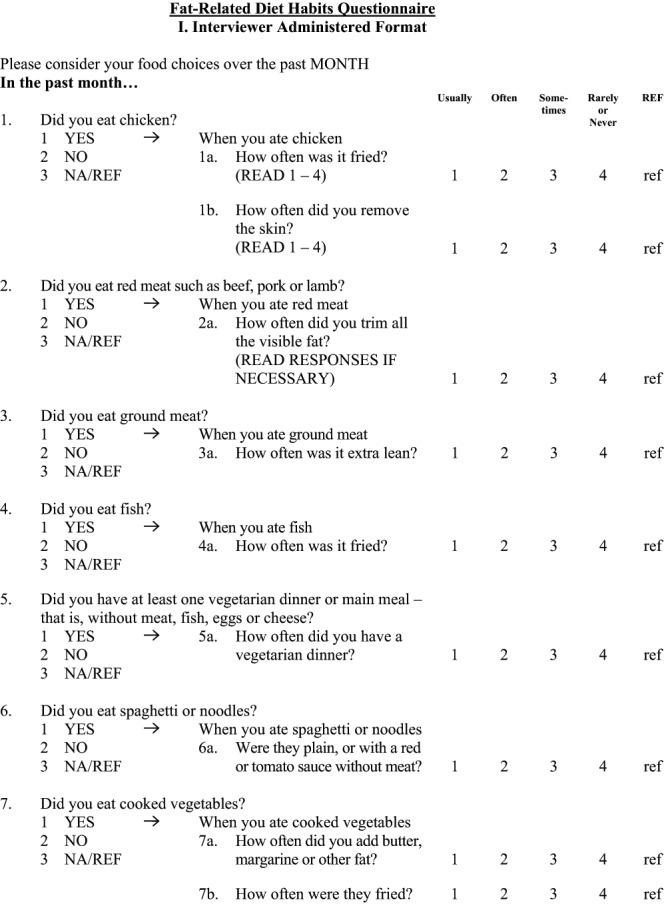
Supplementary File Q2: (Sheet 2).
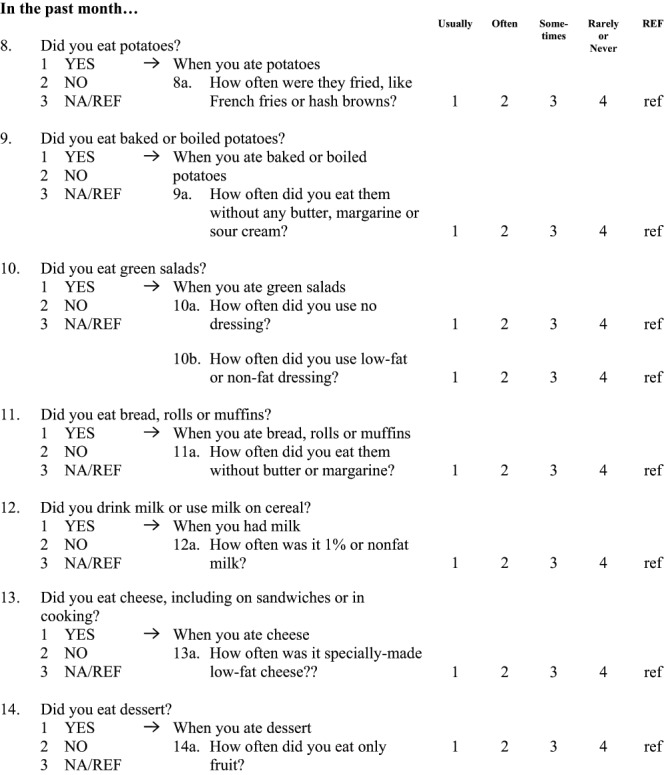
Supplementary File Q2: (Sheet 3).
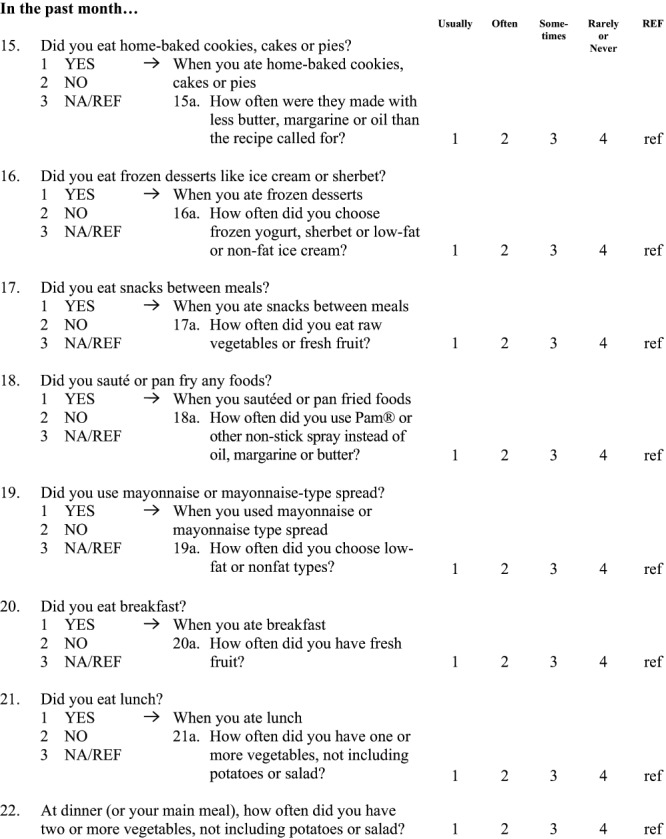
Supplementary File Q2: (Sheet 4).
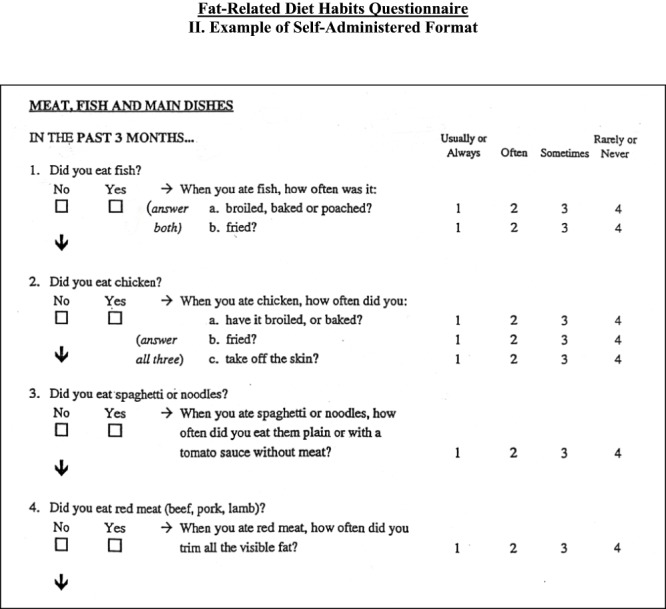
Supplementary File Q2: (Sheet 5).
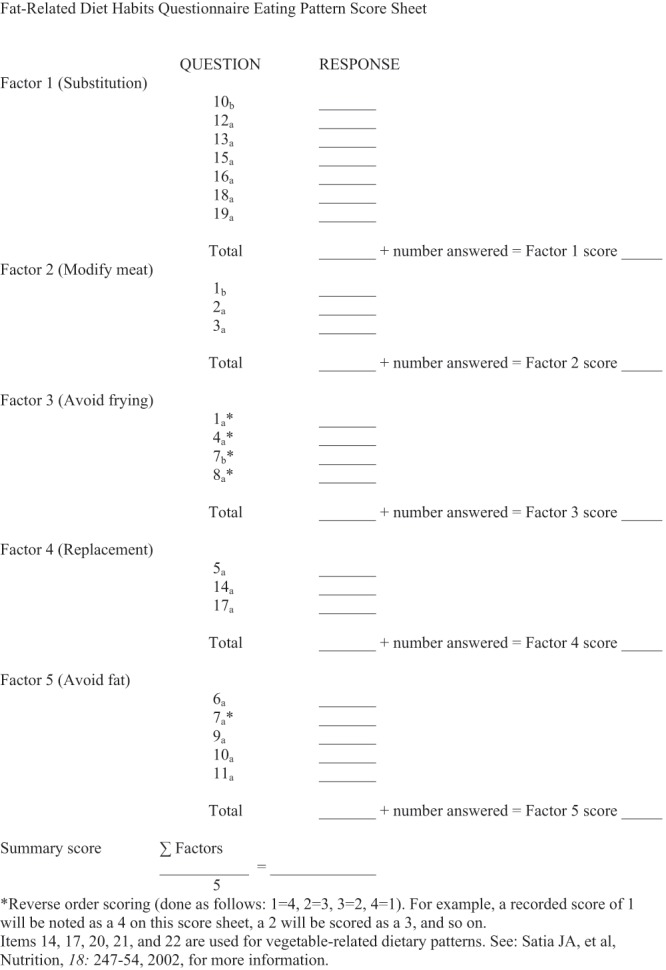
Supplementary File Q2: (Sheet 6).
References
- 1.World Health Organization. Obesity and overweight.2013. Reference Source [Google Scholar]
- 2.Grundy SM, Pasternak R, Greenland P, et al. : Assessment of cardiovascular risk by use of multiple-risk-factor assessment equations: a statement for healthcare professionals from the American Heart Association and the American College of Cardiology. Circulation. 1999;100(13):1481–1492 10.1161/01.CIR.100.13.1481 [DOI] [PubMed] [Google Scholar]
- 3.Dietz WH, Franks AL, Marks JS: The obesity problem. N Engl J Med. 1998;338(16):1156–1158 10.1056/NEJM199804163381613 [DOI] [PubMed] [Google Scholar]
- 4.Dixon JB: The effect of obesity on health outcomes. Mol Cell Endocrinol. 2010;16(2):104–108 10.1016/j.mce.2009.07.008 [DOI] [PubMed] [Google Scholar]
- 5.Roditis M, Parlapani E, Tzotzas T, et al. : Epidemiology and predisponding factors of Obesity in Greece: from the second World war until today. J Pediat Endocrinol Metabol. 2009;22(5):389–406 10.1515/JPEM.2009.22.5.389 [DOI] [PubMed] [Google Scholar]
- 6.Katsarou A, Tyrovolas S, Psaltopoulou T, et al. : Socio-economic status, place of residence and dietary habits among the elderly: the Mediterranean islands study. Public Health Nutr. 2010;13(10):1614–1621 10.1017/S1368980010000479 [DOI] [PubMed] [Google Scholar]
- 7.Pitsavos C, Panagiotakos DB, Chrysochοou C, et al. : Epidemiology of cardiovascular risk factors in Greece: aims, design and baseline characteristics of the ATTICA study. BMC Public Health. 2003;3:32 10.1186/1471-2458-3-32 [DOI] [PMC free article] [PubMed] [Google Scholar]
- 8.Nishitani N, Sakakibara H, Akiyama I: Eating behaviour related to obesity and job stress in male Japanese workers. Nutrition. 2009;25(1):45–50 10.1016/j.nut.2008.07.008 [DOI] [PubMed] [Google Scholar]
- 9.Ni Mhurchu C, Aston LM, Jebb SA: Effects of worksite health promotion interventions on employee diets: a systematic review. BMC Public Health. 2010;10:62 10.1186/1471-2458-10-62 [DOI] [PMC free article] [PubMed] [Google Scholar]
- 10. Leighton F, Polic G, Strobel P, et al. : Health impact of Mediterranean diets in food at work. Public Health Nutr. 2009;12(9A):1635–1643 10.1017/S1368980009990486 [DOI] [PubMed] [Google Scholar]
- 11.Robroek SJ, van Lenthe FG, van Empelen P, et al. : Determinants of participation in worksite health promotion programmes: a systematic review. Int J Behav Nutr Phys Act. 2009;6:26 10.1186/1479-5868-6-26 [DOI] [PMC free article] [PubMed] [Google Scholar]
- 12.Parmenter K, Wardle J: Development of a general nutrition knowledge questionnaire for adults. Eur J Clin Nutr. 1999;53(4):298–308 10.1038/sj.ejcn.1600726 [DOI] [PubMed] [Google Scholar]
- 13.Kristal AR, Shattuck AL, Henry HJ: Patterns of dietary behavior associated with selecting diets low in fat reliability and validity of a behavioral approach to dietary assessment. J Am Diet Assoc. 1990;90(2):214–220 [PubMed] [Google Scholar]
- 14.Kristal AR, Beresford SA, Lazovich D: Assessing change in diet-intervention research. Am J Clin Nutr. 1994;59(1 Suppl):185S–189S [DOI] [PubMed] [Google Scholar]
- 15.Glasgow R, Perry JD, Toobert DJ, et al. : Brief assessments of dietary behavior in field settings. Addict Behav. 1996;21(2):239–247 10.1016/0306-4603(95)00056-9 [DOI] [PubMed] [Google Scholar]
- 16.Shannon J, Kristal AR, Curry SJ, et al. : Application of a behavioral approach to measuring dietary change: the fat- and fiber-related diet behavior questionnaire. Cancer Epidemiol Biomarkers Prev. 1997;6(5):355–361 [PubMed] [Google Scholar]
- 17.Darviri C, Fouka G, Gnardellis C, et al. : Determinants of self-rated health in a representative sample of a rural population: a cross-sectional study in Greece. Int J Environ Res Public Health. 2012;9(3):943–54 10.3390/ijerph9030943 [DOI] [PMC free article] [PubMed] [Google Scholar]
- 18.Rosenstock IM, Strecher VJ, Becker MH: Social learning theory and the health belief model. Health Educ Q. 1988;15(2):175–183 10.1177/109019818801500203 [DOI] [PubMed] [Google Scholar]
- 19.Glanz K, Patterson RE, Kristal AR, et al. : Stages of change in adopting healthy diets: fat fiber, and correlates of nutrient intake. Health Educ Q. 1994;21(4):499–519 10.1177/109019819402100412 [DOI] [PubMed] [Google Scholar]
- 20.Atlantis E, Chow CM, Kibry A, et al. : An effective exercise-based intervention for improving mental health and quality of life measurers: a randomized controlled trial. Prev Med. 2004;39(2):424–434 10.1016/j.ypmed.2004.02.007 [DOI] [PubMed] [Google Scholar]
- 21.Goetzel RZ, Ozminkowski RJ: What's holding you back: why should (or shouldn't) employers invest in health promotion programs for their workers? N C Med J. 2006;67(6):428–430 [PubMed] [Google Scholar]
- 22.Wamala SP, Wolk A, Schenck-Gustafsson K, et al. : Lipid profile and socioeconomic status in healthy middle aged women in Sweden. J Epidemiol Community Health. 1997;51(4):400–407 10.1136/jech.51.4.400 [DOI] [PMC free article] [PubMed] [Google Scholar]
- 23.Kouvonen A, Kivimäki M, Cox SJ, et al. : Relationship between work stress and body mass index among 45,810 female and male employees. Psychosom Med. 2005;67:577–583 10.1097/01.psy.0000170330.08704.62 [DOI] [PubMed] [Google Scholar]
- 24.Christaki E, Kokkinos A, Costarelli V, et al. : Stress management can facilitate weight loss in Greek overweight and obese women: a pilot study. J Hum Nutr Diet. 2013;26(Suppl 1):132–9 10.1111/jhn.12086 [DOI] [PubMed] [Google Scholar]
- 25.Alexopoulos EC, Zisi M, Manola G, et al. : Short-term effects of a randomized controlled worksite relaxation intervention in Greece. Ann Agric Environ Med. 2014;21(2): (in press). [DOI] [PubMed] [Google Scholar]


