

Abstract
Finding out the associations between an input gene set, such as genes associated with a certain phenotype, and annotated gene sets, such as known pathways, are a very important problem in modern molecular biology. The existing approaches mainly focus on the overlap between the two, and may miss important but subtle relationships between genes. In this paper, we propose a method, NetPEA, by combining the known pathways and high-throughput networks. Our method not only considers the shared genes, but also takes the gene interactions into account. It utilizes a protein-protein interaction network and a random walk procedure to identify hidden relationships between gene sets, and uses a randomization strategy to evaluate the significance for pathways to achieve such similarity scores. Compared with the over-representation based method, our method can identify more relationships. Compared with a state of the art network-based method, EnrichNet, our method not only provides a ranked list of pathways, but also provides the statistical significant information. Importantly, through independent tests, we show that our method likely has a higher sensitivity in revealing the true casual pathways, while at the same time achieve a higher specificity. Literature review of selected results indicates that some of the novel pathways reported by our method are biologically relevant and important.
Keywords: pathway, protein-protein interaction network, enrichment analysis, gene sets, random walk
I. Introduction
An important problem that many biologists face every day is how to interpret their gene sets, which are typically obtained from high-throughput experiments and associated with a certain phenotype, such as those differentially expressed in tumors compared to normal tissues.
Biologists are knowledge-driven. A principled way to interpret such gene sets is to compare them with a database of well-annotated gene sets, such as biological pathways. For example, one of the most widely used approach, Over-representation Analysis (ORA) [1], counts the number of common genes shared by an input gene set and each annotated gene set, and applies a statistical test, such as the cumulative hyper-geometric test, to calculate the statistical significance of the overlap. A p-value cutoff, e.g. 0.05, is then applied to select the annotated gene sets that have statistically significant overlaps with the input gene set. ORA is very easy to implement, and the idea behind it is straightforward to biologists. A popular extension of ORA known as the Gene Set Enrichment Analysis (GSEA) [2] tries to eliminate the need for an ad hoc cutoff (e.g. expression fold change) that is often used in defining the input gene set. GSEA works by ranking all genes in the genome according to, say, level of differential expression, and tests whether any annotated gene set is ranked unexpected high or low through running-sum statistic.
It is becoming more and more well known that such enrichment-based analysis, including both ORA and GSEA, has a very low discriminative power, as it treats genes as independent functional units. In reality, genes function in a highly coordinated way. Another strategy, which seems to be more successful in practice, is to combine both biological networks and pathways in the analysis. For example, Glaab et al [3] proposed a method called EnrichNet. The approach takes gene correlations and interactions into consideration and agrees with the fact that genes function in a coordinated way, which is a meaningful improvement over ORA. However, EnrichNet only provides scores to measure the functional associations but does not provide information about the statistical significance of the scores.
In this paper, we propose a method, NetPEA, for conducting network-based pathway enrichment analysis by combining the known pathways and high-throughput networks. Our method not only considers the shared genes, but also takes the gene interactions into account. It utilizes a protein-protein interaction network and a random walk procedure to identify hidden relationships between gene sets, and uses a randomization strategy to evaluate the significance for pathways to achieve such similarity scores.
The remainder of this paper is organized as follows. We present the details of the method and the data sets in Section II. In Section III, we present the test results of our method on multiple data sets, and discuss the significance of our finding. We conclude with some remarks for future improvement in Section IV.
II. Methods & Materials
A. Random walk-based similarity measure
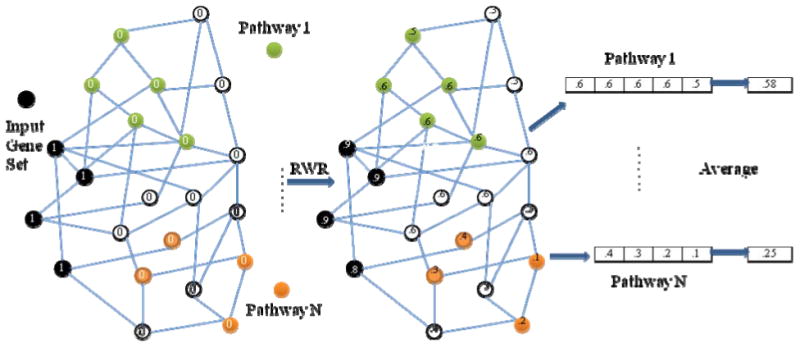
Fig 1 shows the main component of our method, calculating similarity scores, which is used to measure the closeness of pathways to the input gene set. First, we map the genes in the input gene set and pathways to a relevant biological network (PPI network in this study). Then we initialize the nodes with value 0, except for the ones in the input gene set with 1. After the initialization, we follow the Random Walk with Restart (RWR) procedure [4] to spread the nonzero initial values to other nodes in the network. Random Walk with Restart is a simulation of particle diffusion process with a certain pattern. Each node propagates some of its particles through its links to its neighbors; meanwhile the node holds and receives some values for the next round of propagation. We formulate the procedure in (1):
Fig. 1. The workflow of calculating similarity scores between gene sets.
| (1) |
V denotes the vector of initial node values; p represents the restart probability, which indicates what percentage is held to itself (fixed at 0.5 in this study); M is the PPI network transition matrix; Sn is a vector of all nodes in the network which is used to measure the similarities between each node in the network and nodes in the input gene set after n rounds of propagation. At the very beginning, S0 is initialized with V. After a period time of these propagations, Sn converges. For each pathway, we take the average of its member gene values as its similarity score to the input gene set.
B. Network-based Pathway Enrichment Analysis
To evaluate how significant for pathways to achieve such similarity scores, we randomly choose the same number of genes as the input gene set to calculate similarity score for each pathway. After we repeat this randomization 1000 times, then we get 1000 similarity scores for each pathway as its background. Equation (2) is used to calculate z-scores for pathway significance. D is the similarity score using gene set of interest as input, while R is a set 1000 similarity scores taking randomized gene sets as inputs.
| (2) |
We rank the pathways in descending order according to their z-scores. As the distribution of the z-scoes roughly follows a normal distribution, we also convert the z-scores to p-values under normal distribution assumption. We then select pathways with z-scores greater than 1.65, which corresponds to the p-value 0.05, as the significant pathways.
C. Data sets
The annotated gene sets used in this study are from KEGG pathways [5]. Our input gene sets includes Parkinson's disease gene set [6], lymphoma cancer gene set [7], two breast cancer gene sets obtained by two groups [8, 9], two lung cancer gene sets [10, 11], diabetes disease gene set [12], leukemia gene set [13], and two unpublished gene sets, “gender” and “p53” from the GSEA website [14]. All gene sets except “Parkinson” are from high throughput experiments. The Parkinson's disease gene set is from literature search. For four of the data sets (p53, gender, diabetes, leukemia), genes are further categorized into “up” and “down” according to the direction its expression level was changed in the experiments. The human PPI network is downloaded from the Human Protein Reference Database (HPRD, version 9) [15].
III. Results & Discussion
We adopt and design multiple evaluation methods because of the lack of ground truth and the biases in different evaluation standards.
A. Validation using GSEA outputs as benchmarks
For four of the data sets, since we also have access to the coupled microarrays and ranked gene lists, we apply GSEA to rank the pathways and use the rankings as benchmarks. GSEA is a benchmark widely used to validate gene set rankings, and [3] uses it to check pathway rankings. While the results may be biased, it provides partial evidence that our method has good performances. Here we calculate Spearman correlation coefficients between each mentioned method and GSEA. Table I shows that for each input gene set, NetPEA produces the largest coefficient, which means that our method gains more support on pathway rankings.
Table I. Spearman Correlation Coefficient between GSEA and three other approaches.
| Down | P53 | Gender | Diabetes | Leukemia |
|---|---|---|---|---|
| NetPEA | 0.4653 | 0.2713 | 0.2373 | 0.3253 |
| ORA | 0.3968 | 0.2406 | 0.1602 | 0.264 |
| EnrichNet | 0.2967 | 0.219 | 0.1779 | 0.2726 |
| Up | P53 | Gender | Diabetes | Leukemia |
| NetPEA | 0.3427 | 0.4349 | 0.227 | 0.1195 |
| ORA | 0.2507 | 0.332 | 0.1421 | 0.0583 |
| EnrichNet | 0.2167 | 0.3067 | 0.0823 | 0.0599 |
B. Evaluation based on number of enriched pathways
We apply our method on each of the data set mentioned in section II-C. As a comparison, we run ORA on these input gene sets and compare the significant pathways found by the two methods. As EnrichNet does not provide statistical significance, which is its main disadvantage, we cannot include it into the comparison.
Table II shows significant pathways only reported by NetPEA but not presented in the results of ORA. For most of cases (11/14), ORA does not provide any pathway that is not found by NetPEA. For common significant pathways discovered by both methods, we define NetPEA ≫ ORA, NetPEA ≪ ORA and NetPEA ≈≈ ORA by the ratios of their p-values (NetPEA/ORA is less than 0.001, greater than 1000, or in between). Strikingly, no pathways fall into the range NetPEA ≪ ORA. Overall, NetPEA can successfully identify nearly all significant pathways reported by ORA. Moreover, NetPEA reports many significant pathways not found by ORA. The superiority of NetPEA over ORA can be explained by the fact that NetPEA not only considers the pathway enrichment caused by common genes, but also takes gene interactions into account. Through the gene interactions, some pathways not enriched in ORA are elevated to be significant. In Section III-D we will show that these additional pathways are biologically meaningful.
Table II. Significant Pathways: NetPEA VS ORA.
| Input Gene Set[Source] | # distinct significant pathways | # common significant pathways | |||
|---|---|---|---|---|---|
| NetPEA | ORA | NetPEA ≫ORA | NetPEA ≪ORA | NetPEA ≈≈ORA | |
| Parkinson[6] | 18 | 0 | 19 | 0 | 18 |
| Lymphoma[7] | 18 | 0 | 10 | 0 | 5 |
| Breast Cancer[8] | 13 | 0 | 6 | 0 | 12 |
| Breast Cancer[9] | 4 | 1 | 4 | 0 | 16 |
| Beer's Lung Cancer[10] | 28 | 0 | 3 | 0 | 12 |
| Bhattacharjee's Lung Cancer[11] | 25 | 1 | 6 | 0 | 17 |
| Diabetes (down)[12] | 13 | 0 | 4 | 0 | 2 |
| Diabetes (up)[12] | 7 | 0 | 0 | 0 | 2 |
| Leukemia (down)[13] | 22 | 0 | 1 | 0 | 2 |
| Leukemia (up)[13] | 7 | 0 | 3 | 0 | 7 |
| Gender (down)[14] | 7 | 0 | 0 | 0 | 1 |
| Gender (up)[14] | 10 | 0 | 1 | 0 | 2 |
| P53 (down)[14] | 14 | 0 | 1 | 0 | 5 |
| P53 (up)[14] | 24 | 1 | 5 | 0 | 18 |
C. Pathways cross verification analysis
Here we use two cross verifications, positive cross verification and negative cross verification, to compare our method1 with ORA2, EnrichNet3, and GSEA4. For positive cross verification, we examine how many pathways out of the top 20 by one method appear in any of other three methods' top 20 pathways. For negative cross verification, we check how many pathways out of the top 20 by one method are ranked below top 100 by all other three methods.
Table III shows that ORA receives the most recognition and report only one pathway that is not agreed by others, which is understandable because ORA is the most conservative method and most of its results are also reported by NetPEA and EnrichNet. For the two network-based approaches, they receive similar results on positive cross verification, while NetPEA is better than the counterpart with less negative results. Moreover, the only pathway of negative verification result of NetPEA is “taste transduction” for diabetes, which has been reported previously [16]. The pathways of negative verification result of EnrichNet include “thyroid cancer”, “basal cell carcinoma”, “melanogenesis”, “endometrial cancer” and “hedgehog signaling”. Our limited effort of literature search did not reveal enough evidence of association with diabetes. GSEA is the one receiving the least recognition for it exploits whole microarray and from methodology point of view, it is far away from the other three methods.
Table III. Pathways Cross verification Analysis.
| Input Gene Set[source] | Positive | Negative | ||||||
|---|---|---|---|---|---|---|---|---|
| 1 | 2 | 3 | 4 | 1 | 2 | 3 | 4 | |
| Lung Cancer[10] | 16 | 16 | 16 | 7 | 0 | 0 | 0 | 2 |
| Lung Cancer[11] | 14 | 16 | 16 | 4 | 0 | 0 | 1 | 8 |
| Diabetes (down)[12] | 17 | 19 | 16 | 5 | 0 | 0 | 0 | 3 |
| Diabetes (up)[12] | 15 | 16 | 13 | 5 | 1 | 1 | 5 | 3 |
| Leukemia (down)[13] | 18 | 18 | 15 | 5 | 0 | 0 | 0 | 7 |
| Leukemia (up)[13] | 15 | 19 | 15 | 8 | 0 | 0 | 1 | 4 |
| Gender (down)[14] | 18 | 19 | 15 | 8 | 0 | 0 | 1 | 2 |
| Gender (up)[14] | 17 | 19 | 15 | 7 | 0 | 0 | 0 | 1 |
| P53 (down)[14] | 19 | 19 | 13 | 10 | 0 | 0 | 1 | 2 |
| P53 (up)[14] | 16 | 15 | 16 | 6 | 0 | 0 | 2 | 3 |
Its negative cross verification results include “olfactory transduction”, “mismatch repair” and “snare interactions” in vesicular transport for diabetes. These associations claimed by GSEA are hard to understand. Therefore, NetPEA has an advantage over other method to rank meaningful pathways at top.
D. Novel Pathways
Due to space constraint, we discuss a few additional pathways reported by NetPEA in section III-B.
For the diabetes down-regulated input gene set, NetPEA ranks the pathway “glycerolipid metabolism”, as the 5th with a significant z-score 3.5 (p-value = 2.3e-4). However, the same pathway has a p-value 0.12 in ORA and is ranked 37th by EnrichNet. Extensive literature review shows that “glycerolipid metabolism” plays in the pathogenesis of obesity and type 2 diabetes [17-18].
For the Leukemia down-regulated gene set, NetPEA ranks “folate biosynthesis” as the most significant pathway (z-score = 5.0), while the same pathway is ranked 22nd by EnrichNet and has a p-value 0.05 in ORA. We search through the literature and find out the relationship between the pathway and leukemia can be verified. This association has been confirmed by the literature [19].
IV. Conclusion
In the paper, we utilize a human PPI network and a RWR procedure and propose a new network-based approach to analyze the functional associations between input gene sets and pathways. Compared with ORA, our method extends its search territory, reports more significant pathways and gains more GSEA support on the pathways rankings. Compared with EnrichNet, our method has a better discriminative power and provides statistical significant information. At last we demonstrate that novel significant pathways reported by our method are biological meaningful and corroborated by peer reviewed papers. In the future, we want to extend the methods to be applied to multiple heterogeneous terms and contexts.
Acknowledgments
This research was supported in part by funding from NSF (IIS-1218201), NIH (SC3GM086305), U54CA113001, G12MD007591 and UTSA (Tenure-track Research Award).
Contributor Information
Lu Liu, Email: mfq426@my.utsa.edu.
Jianhua Ruan, Email: jruan@cs.utsa.edu.
References
- 1.Huang da W, Sherman BT, Lempicki RA. Bioinformatics enrichment tools: paths toward the comprehensive functional analysis of large gene lists. Nucleic Acids Res. 2009;37:1–13. doi: 10.1093/nar/gkn923. [DOI] [PMC free article] [PubMed] [Google Scholar]
- 2.Subramanian Aravind, Tamayo Pablo, Mootha Vamsi K, Mukherjee Sayan, Ebert Benjamin L, Gillette Michael A, Paulovich Amanda, et al. Gene set enrichment analysis: a knowledge-based approach for interpreting genome-wide expression profiles. Proceedings of the National Academy of Sciences of the United States of America. 2005;102(no. 43):15545–15550. doi: 10.1073/pnas.0506580102. [DOI] [PMC free article] [PubMed] [Google Scholar]
- 3.Glaab Enrico, Baudot Anaïs, Krasnogor Natalio, Schneider Reinhard, Valencia Alfonso. EnrichNet: network-based gene set enrichment analysis. Bioinformatics. 2012;28(no. 18):i451–i457. doi: 10.1093/bioinformatics/bts389. [DOI] [PMC free article] [PubMed] [Google Scholar]
- 4.Yin Zhijun, Gupta Manish, Weninger Tim, Jiawei Han. A unified framework for link recommendation using random walks. Advances in Social Networks Analysis and Mining (ASONAM), 2010 International Conference on; 2010. pp. 152–159. [Google Scholar]
- 5.Kanehisa Minoru, Goto Susumu, Hattori Masahiro, Aoki-Kinoshita Kiyoko F, Itoh Masumi, Kawashima Shuichi, Katayama Toshiaki, Araki Michihiro, Hirakawa Mika. From genomics to chemical genomics: new developments in KEGG. Nucleic acids research. 2006;34(no. suppl 1):D354–D357. doi: 10.1093/nar/gkj102. [DOI] [PMC free article] [PubMed] [Google Scholar]
- 6.Yu Wei, Clyne Melinda, Khoury Muin J, Gwinn Marta. Phenopedia and Genopedia: disease-centered and gene-centered views of the evolving knowledge of human genetic associations. Bioinformatics. 2010;26(no. 1):145–146. doi: 10.1093/bioinformatics/btp618. [DOI] [PMC free article] [PubMed] [Google Scholar]
- 7.Shin Jessica, Monti Stefano, Aires Daniel J, Duvic Madeleine, Golub Todd, Jones David A, Kupper Thomas S. Lesional gene expression profiling in cutaneous T-cell lymphoma reveals natural clusters associated with disease outcome. Blood. 2007;110(no. 8):3015–3027. doi: 10.1182/blood-2006-12-061507. [DOI] [PMC free article] [PubMed] [Google Scholar]
- 8.van't Veer Laura J, Dai Hongyue, Van De Vijver Marc J, He Yudong D, Hart Augustinus AM, Mao Mao, Peterse Hans L, et al. Gene expression profiling predicts clinical outcome of breast cancer. nature. 2002;415(no. 6871):530–536. doi: 10.1038/415530a. [DOI] [PubMed] [Google Scholar]
- 9.Wang Yixin, Klijn Jan GM, Zhang Yi, Sieuwerts Anieta M, Look Maxime P, Yang Fei, Talantov Dmitri, et al. Gene-expression profiles to predict distant metastasis of lymph-node-negative primary breast cancer. The Lancet. 2005;365(no. 9460):671–679. doi: 10.1016/S0140-6736(05)17947-1. [DOI] [PubMed] [Google Scholar]
- 10.Beer David G, Kardia Sharon LR, Huang Chiang-Ching, Giordano Thomas J, Levin Albert M, Misek David E, Lin Lin, et al. Gene-expression profiles predict survival of patients with lung adenocarcinoma. Nature medicine. 2002;8(no. 8):816–824. doi: 10.1038/nm733. [DOI] [PubMed] [Google Scholar]
- 11.Bhattacharjee Arindam, Richards William G, Staunton Jane, Li Cheng, Monti Stefano, Vasa Priya, Ladd Christine, et al. Classification of human lung carcinomas by mRNA expression profiling reveals distinct adenocarcinoma subclasses. Proceedings of the National Academy of Sciences. 2001;98(no. 24):13790–13795. doi: 10.1073/pnas.191502998. [DOI] [PMC free article] [PubMed] [Google Scholar]
- 12.Mootha VK, Lindgren CM, Eriksson KF, Subramanian A, Sihag S, Lehar J, Puigserver P, Carlsson E, Ridderstråle M, Laurila E, Houstis N, Daly MJ, Patterson N, Mesirov JP, Golub TR, Tamayo P, Spiegelman B, Lander ES, Hirschhorn JN, Altshuler D, Groop LC. PGC-1 alpha-responsive genes involved in oxidative phosphorylation are coordinately downregulated in human diabetes. Nat Genet. 2003;34:267–273. doi: 10.1038/ng1180. [DOI] [PubMed] [Google Scholar]
- 13.Armstrong Scott A, Kung Andrew L, Mabon Meghann E, Silverman Lewis B, Stam Ronald W, Den Boer Monique L, Pieters Rob, et al. Inhibition of FLT3 in MLL: validation of a therapeutic target identified by gene expression based classification. Cancer cell. 2003;3(no. 2):173–183. doi: 10.1016/s1535-6108(03)00003-5. [DOI] [PubMed] [Google Scholar]
- 14.GSEA website. http://www.broadinstitute.org/gsea/index.jsp.
- 15.Keshava Prasad TS, Goel Renu, Kandasamy Kumaran, Keerthikumar Shivakumar, Kumar Sameer, Mathivanan Suresh, Telikicherla Deepthi, et al. Human protein reference database—2009 update. Nucleic acids research. 2009;37(no. suppl 1):D767–D772. doi: 10.1093/nar/gkn892. [DOI] [PMC free article] [PubMed] [Google Scholar]
- 16.Young Richard L, Sutherland Kate, Pezos Nektaria, Brierley Stuart M, Horowitz Michael, Rayner Christopher K, Blackshaw L Ashley. Expression of taste molecules in the upper gastrointestinal tract in humans with and without type 2 diabetes. Gut. 2009;58(no. 3):337–346. doi: 10.1136/gut.2008.148932. [DOI] [PubMed] [Google Scholar]
- 17.Prentki Marc, Madiraju SR Murthy. Glycerolipid metabolism and signaling in health and disease. Endocrine reviews. 2008;29(no. 6):647–676. doi: 10.1210/er.2008-0007. [DOI] [PubMed] [Google Scholar]
- 18.Prentki Marc, Madiraju SR Murthy. Glycerolipid/free fatty acid cycle and islet P-cell function in health, obesity and diabetes. Molecular and cellular endocrinology. 2012;353(no. 1):88–100. doi: 10.1016/j.mce.2011.11.004. [DOI] [PubMed] [Google Scholar]
- 19.Chiang En-Pei, Wang YC, Tang FY. Folate restriction and methylenetetrahydrofolate reductase 677T polymorphism decreases adoMet synthesis via folate-dependent remethylation in human-transformed lymphoblasts. Leukemia. 2007;21(no. 4):651–658. doi: 10.1038/sj.leu.2404575. [DOI] [PubMed] [Google Scholar]