Abstract
Introduction
Early detection of breast lesions using mammography has resulted in lower mortality-rates. However, some breast lesions are mammography occult and magnetic resonance imaging (MRI) is recommended, but has lower specificity. It is possible to achieve higher specificity by using Strain-ENCoded (SENC) MRI and/or magnetic resonance elastography(MRE). SENC breast MRI can measure the strain properties of breast tissue. Similarly, MRE is used to measure elasticity (i.e., shear stiffness) of different tissue compositions interrogating the tissue mechanical properties. Reports have shown that malignant tumors are 3–13 times stiffer than normal tissue and benign tumors.
Methods
We have developed a Strain-ENCoded (SENC) breast hardware device capable of periodically compressing the breast, thus allowing for longer scanning time and measuring the strain characteristics of breast tissue. This hardware enabled us to use SENC MRI with high spatial resolution (1×1×5mm3) instead of Fast SENC(FSENC). Simple controls and multiple safety measures were added to ensure accurate, repeatable and safe in-vivo experiments.
Results
Phantom experiments showed that SENC breast MRI has higher SNR and CNR than FSENC under different scanning resolutions. Finally, the SENC breast device reproducibility measurements resulted in a difference of less than one mm with a 1% strain difference.
Conclusion
SENC breast MR images have higher SNR and CNR than FSENC images. Thus, combining SENC breast strain measurements with diagnostic breast MRI to differentiate benign from malignant lesions could potentially increase the specificity of diagnosis in the clinical setting.
1. Introduction
According to the American Cancer Society’s 2009 report [1], one in eight women will develop breast cancer in her lifetime. Early detection through periodic screening is the key to lower mortality-rates and the current methods used are mammography and ultrasound (US). However, some breast lesions are mammography and US occult (i.e. dense breasts). Therefore, other methods, such as magnetic resonance imaging (MRI), are used especially in women who are at high risk to develop breast cancer. While MRI has high sensitivity (95%), its specificity remains moderate (83%) [2,3] and there is a need to increase specificity so that number of unnecessary biopsy procedures can be reduced. Recent MRI methods have been proposed to further improve specificity, including diffusion weighted imaging (DWI) and apparent coefficient of water (ADC) map [4,5,6,7], magnetic resonance spectroscopy (MRS) [8,9,10,11,12], and MR elastography (MRE) [13,14,15]—which are all reviewed in [16]. DWI and ADC can probe the movement of water and is a measure of cellularity. MRS can give metabolic information on the breast tissue. Magnetic resonance elastography mimics breast examination by palpation to differentiate normal tissue from tumors according to their stiffness. Unlike palpation, which is subjective, MRE is an objective method for determining tissue stiffness in a region by compressing tissue about less than one percent compression. Reports have shown [17] that the addition of MRE to the standard MRI exam could result in a 20% increase in specificity. MRE has been applied to several different parts of the body including the liver [18,19,20], brain [21,22], prostate [23], heart [24], muscles [25,26], and breast [13,14,15]. MRE relies on special hardware (reviewed in [30]) to produce low-frequency acoustic waves that propagate into tissue of interest, and then imaged using standard phase contrast MR techniques [27,28,29]. In general, MRE hardware generates small displacement (<1mm), either using remote actuators with long transmission mechanism [31,22], or using electromagnetic coils placed in the main field B0 [32], or using piezoelectric material [33]. For breast imaging the maximum displacement used was 3mm [31]. In this work, we present a new type of breast hardware capable of generating large displacement (2–50mm), in order to study large deformations by measuring strain changes using Strain-Encoded (SENC) MRI. Strain-ENCoded MRI is a relatively new imaging technique [34] that can detect stiff masses by directly measuring strain difference between the tumor and the background. Unlike, traditional MRE that required post-processing software to solve the inverse problem with known boundary conditions, SENC relies on a simple and fast center of mass calculation to measure the strain of tissue in real-time. In Osman,[35] a proof of concept for detecting stiff masses was introduced, where a 30% compression was produced using a Vest-CPR CardioLogic System Inc. designed for the human chest in cardiopulmonary resuscitation, while the phantom was placed inside a head coil. However, Scanning resolution, signal-to-noise ratio (SNR), and contrast-to-noise ratio (CNR) of the masses were not addressed. In [36], Pan, et. al. proposed Fast SENC (FSENC), an accelerated version of the SENC technique, capable of completing the whole scan in one cycle. Fast SENC uses localized tagging pulses in order to reduce the field-of-view (FOV) without fold over artifacts. In [37], Fahmy et al proposed the use FSENC to detect masses according to stiffness difference between them using simple hardware fitted into standard breast coils using an air-balloon and rubber band system to compress and uncompress the tissue. This set up limited the scan time to only one compression. Their phantom experiments detected large tumors that were 15 and 7mm in diameter with a height of 13mm by using in-plane scanning resolution of 4×4mm with slice thickness of 10mm.
In this work, we introduce an improved SENC breast hardware design which is capable of periodically compressing the breast allowing us to use SENC instead of FSENC to measure the strain properties of the tissue. Our hardware allows us to prolong scan time leading to higher signal-to-noise ratio (SNR), contrast-to-noise ratio (CNR), and increase resolution of 1×1mm with slice thickness of 5mm. Simple controls and multiple safety measures were added to ensure accurate, reproducible and safe in-vivo experiments.
2. Methods
2.1. Hardware
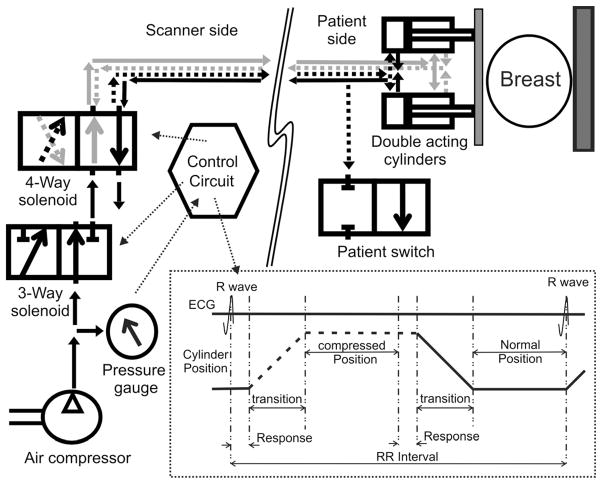
There is a need to generate motion of the tissue to cause deformation that can be detected, and which is dependent on the stiffness of the tissue. For this, special hardware is built with the consideration of reproducibility, accuracy, simplicity, safety, patient’s comfort, and flexibility to accommodate for different breast sizes. In [31], a maximum displacement of 3mm at 1 Hz is generated, which leads to a maximum strain of 3.5% assuming the average breast diameter is 7cm). However in SENC, we are interested in larger strain ranges of 5% to 30%. This led us to redesign the hardware used in [37] to accommodate for this. Our new hardware generates larger displacement (2mm–50mm) at 0.5 Hz. The previous hardware suffered from several potential limitations, which we improved by using two air-cylinders, and a simple control circuit to produce accurate and reproducible compressions as demonstrated in Fig. 1. For safety reasons, we used components that can handle a maximum air pressure of 60 pounds per square inch(PSI), while the system operates at 25 PSI (with a maximum level of 30 PSI). Our hardware is comprised of two parts: one on the scanner side and other on the patient side described below.
Fig. 1.
Block diagram for our hardware consisting of scanner side and a patient side. Scanner side is responsible for: A) Controlling the safety 3-way solenoid; B) Controlling the 4-way solenoid to directing the air flows in and out of the backward/forward champers; C) Generating the ECG signal to be able to synchronize with the scanner. Patient side is made of two double acting cylinders that fit under the breast coil, and a safety switch that when enabled releases the airflow and stops the compression. Black lines are connected to the backward chamber while the gray lines are connected to the forward chambers of the double acting cylinders. Dotted lines show air-flow during the first half of the cycle, while solid lines shows the air-flow during the second half of the cycle.
2.1.1. SENC Breast Hardware on the Scanner side
We designed the SENC breast hardware using two plastic double acting air cylinders that provide accurate and reproducible motion. A four-way solenoid controls direction of the airflow by inflating and deflating air from the air-cylinder’s front and back chambers. The method leads to a cyclic motion of the front plate that is attached to the air-cylinder. Figure 1 demonstrates the airflow direction throughout the cycle; the black line connects the backward chamber while the gray lines are connected to the forward chamber. In the first half of the cycle, the airflow follows the dotted lines inflating air into the backward chamber and deflating air from the forward chamber making the cylinder’s bore extend to its full length. While in the second half of the cycle, the air flows following the solid lines inflating air in the forward chamber and deflating the air from the backward chamber, retracting the bore allowing the breast to relax to its normal position. Note that the solenoid is connected such that in normal position where the hardware is not powered up or in case of power loss, the air follows according to the second half of the cycle so that the front plate retracts away from the patient.
Therefore this part of the hardware is responsible for:
Ensuring that the pressure does not exceed 30 PSI by monitoring the pressure using a pressure gauge. If the pressure exceeds 30 PSI, the air is released outside the system through the three-way solenoid.
Synchronizing the scanner imaging with the mechanical motion by generating ECG-like pulses to trigger the MRI scanner. This allows tagging of the tissue at a rest position then acquires SENC images while the tissue is compressed.
Controlling the 4-way solenoid to direct the airflow in and out of the backward and forward chambers of the double acting cylinder, this produces periodic motion that compresses the breast.
2.1.2. SENC Breast Hardware on the Patient side
The SENC breast hardware on the patient’s side casing fits under the standard MR breast coils (see Fig. 2). All components were built from acrylic and plastic with brass screws for MRI compatibility and imaging constraints. The SENC breast Hardware design has maximum flexibility to accommodate for different breast cup sizes (53mm up to 120mm in diameter) as well as different compression levels (5% up to 50% compression) as shown in Fig. 2. The air-cylinders and the back plate can be adjusted to different positions in the fixed frame, to accommodate for different breast sizes as demonstrated in Fig 2 with a large (solid) and small (dotted) breast and how the front and back plates are adjusted to accommodate these different breast sizes. The system uses air cylinders with a stroke length of either 1″ or 2″. Moreover, the stoke length can be shortened by inserting different-sized adjustable plates (1/8″, 1/4″, 1/2″, 3/4″) —either alone or with any combination—to constrain the cylinders motion. This allows us to control the maximum compression that is comfortable for each patient. The air-cylinders provides a built-in safety feature that guarantees patient safety, such that the front plate will never move beyond the displacement allowed. Moreover, a patient switch (shown in Fig. 1), was added enabling the patient to disable instantly the system by releasing the pressure in case of any discomfort.
Fig. 2.
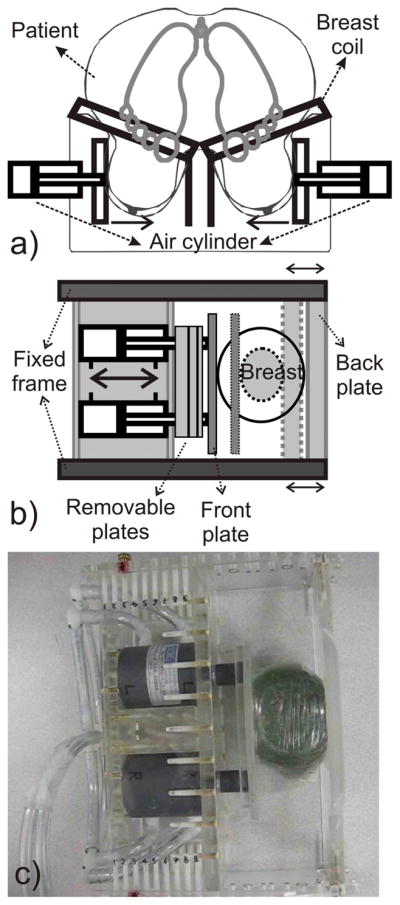
a) Schematic of the SENC breast hardware with a patient lying in the prone position in standard breast coil. b) Top view section for patient side casing. Back and Front plates can be adjusted to accommodate for different breast sizes. Removable plates with different sizes can be added or removed to adjust for the compression limits, as it constraints the air-cylinders motion. c) Representative image of the patient side casing with one removable plate compressing a gel phantom.
2.1.3. SENC Breast Hardware modes of operation
The SENC breast hardware can operate in three different modes:
OFF: Our compression device is turned off. The breast is at normal position to allow for normal breast MRI scanning protocol.
Compress & hold: In this mode, the control circuit keeps the 4-way solenoid on. This makes the compressed air be directed to the back chamber of the air-cylinder, keeping the tissue compressed. This mode is useful in comparing SENC images with other MRI sequences (e.g. T1W, T2W images), as the SENC images are acquired while the tissue is compressed.
Compression: This is the normal mode of operation where the control circuit oscillates every second turning the 4-way solenoid on and off. This results in a periodic motion of the front plate, compressing the tissue with frequency of 0.5 Hz.
2.2. Strain-Encoded (SENC) MRI
The SENC MR imaging technique enables direct measuring of tissue strain ε, which is a mechanical quantity defined as the percentage change in length of tissue, or mathematically as
| (1) |
where ΔL is the change of the tissue’s length, L and L0 are the final and initial length of the tissue, respectively.
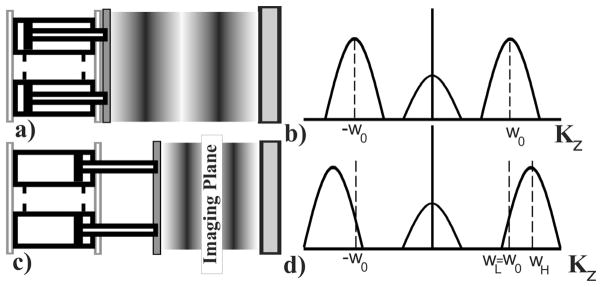
In SENC, tagging pulses are applied to create a sinusoidal pattern in the slice selection direction. After compression, the tissue deforms causing the tagging frequency ω0 to shift to higher frequency, relative to the tissue’s stiffness. Two images IL and IH are acquired at two different z-encoding frequencies ωL and ωH (see Fig. 3). In the SENC literature IL and IH are referred to as low (LT) and high tuning (HT). By combining the two images using the center-of-mass method, we can calculate the position of the peak ω at each pixel p by
Fig. 3.
Tissue status with the tag lines changing for compression with the corresponding harmonic peak shift (right). a) Tissue in normal position with initial tagging frequency. b) Sinc peak centered at tagging frequency. c) Pistons compressing the tissue causing tagging frequency to increase. d) Harmonic peaks shift to higher frequency.
| (2) |
then local strain can be quantified by
The low and high tune images reflect the underlying anatomy, while SENC strain image reflects the stiffness of the tissue. Therefore, SENC strain images can identify the stiff masses while the low and high tune images can capture the anatomical resolution. Since masses are stiffer than the background, their tagging frequency remains the same therefore appearing as bright signal on LT image and dark on HT image. On the other hand softer background would be compressed resulting in a shift in the tagging frequency; therefore, softer background appears as dark signal on the LT image and bright signal on the HT image.
2.3. Tagging frequency
SENC MR imaging was first optimized for measuring the myocardial strain. We followed [38] to determine the SENC parameters for breast of ω0, ωL, and ωH by
| (3) |
where, , εmax compression and εmax stretch are the expected strain values externally applied by our device. Note that ε max compression is always expresed in negative values while εmax stretch is experested in positive values. Since we are only interested in compression, we set εmax stretch to zero. Therefore, Eqs. 3 are simplified to
| (4) |
2.4. Pulse sequence and Flip Angle Optimization
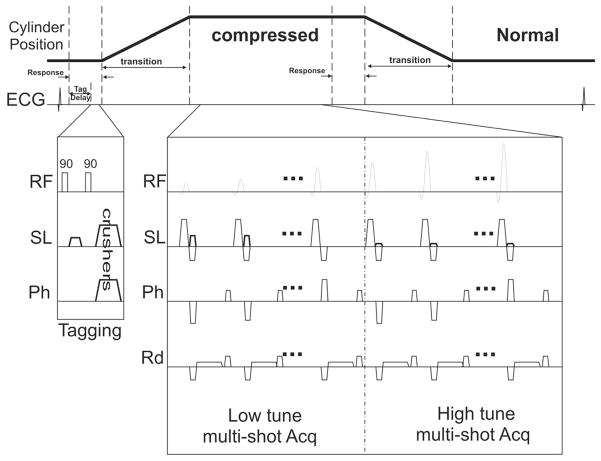
A typical SENC pulse sequence is shown in Fig. 4. After the R-wave, a tagging delay is introduced to compensate for the air-cylinder’s response time. The trigger delay is used to compensate for the transition time of the air cylinders to come to a complete stop, ensuring that the image acquisition occurs when the tissue is compressed. A multi-shot acquisition is applied to acquire the low and high tune images. For SENC, these acquisition steps are repeated to acquire a segmented K-space, however in FSENC, this pattern is not repeated since all the data is acquired in one cycle. Recall, tagging is a temporary affect and fades due to T1 relaxation. Stefan et al [41] studied this relaxation phenomena and derived equations that describes the signal intensity of the Kth echo acquired after the tagging preparation defined below:
| (5) |
where Mss is the steady state magnetization, TAG (z) is the tagging pattern created in the slice selection direction, Δt is the time between each RF, T1 is the relaxation time of the tissue, and αj is the flip angle of the jth RF. To compensate for this signal loss, Stuber et al. proposed increasing the excitation flip angle αj gradually through time in order to maintain uniform signal intensity through time [39] using
Fig. 4.
The SENC pulse sequence. A short tagging delay is introduced ~100ms after the R-wave. Followed by a typical tagging sequence consists of two 90 hard pulses with a tagging gradient in the slice direction. Acquisition starts after the cylinders are at their final position. Multi-shot acquisition for the low and high tune images. Flip angles are ramped to compensate for the T1 decay.
| (6) |
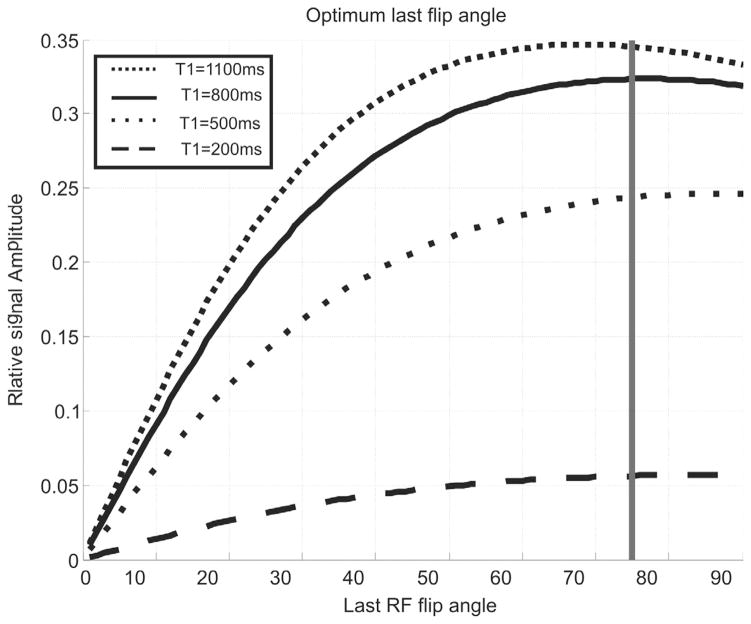
In [37], since the whole scan lasted one cycle, the last flip angle was set to maximum angle allowed by the scanner, since the flip angle was not required to reserve the signal for subsequent acquisition cycles. However, in this work, the pulse sequence is repeated over the consecutive cycles, which necessitates optimizing the last flip angle value to obtain adequate signal during first cycle, while leaving enough magnetization that can be tagged in the next cycles. We have done numerical simulations similar to the work did in [39], by including the tagging delay and the trigger delay between the tag pulses and the acquisition. Fig. 5 shows optimum flip angle for different tissue with different T1, in order to obtain the best signal intensity, we chose the last flip angle to be between 70° and 80°. Once the last flip angle is determined, we can iteratively calculate the remaining of the flip angles using Eq. 5. Note that the number of RF in SENC sequences is usually 10–20 RF pulses, while for FSENC it is usually around 22–40. This affects the SNR as the unit magnetization is divided by more RFs in FSENC than in SENC protocol.
Fig. 5.
Relative signal intensity for different tissues having different T1 relaxation. Gray line marks the optimum last flip angle that obtains highest signal for different T1 values.
3. Phantom Design and Experiments
3.1 Phantom composition
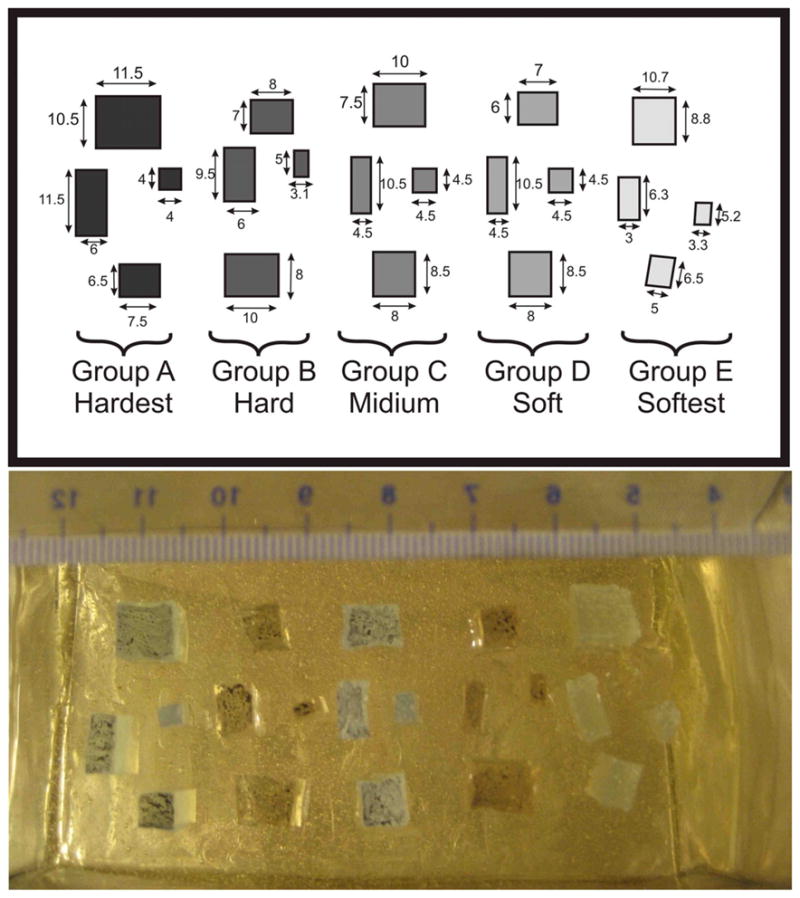
A custom-made phantom was constructed to determine SENC and FSENC resolution limits. This phantom was made-out of four different silicon materials to generate six different groups of material to replicate masses with different stiffness. Gels types were: Dow corning® 3-4222 “firm gel”, Dow corning® 3-4133 “dielectric gel”, Dow corning® 3-4207 “tough gel”, and Factor2 “A-341 gel”. Factor2 “A-341 gel” was used for surrounding background to simulate normal tissue, while the Dow corning gels were used to simulate the breast masses. Dow corning gels require two compounds A and B to be mixed with 1:1 ratio, while Factor2 requires a ratio of 1:10. By altering the ratios of Dow corning® gel, five groups of masses with different stiffness were constructed. Four of which were harder than the background (groups A, B, C, and D) and one was softer than the background (group E). Each group was examined by a dynamic mechanical analyzer to obtain stress-strain curves, where the slop determines Young’s modulus for each gel mixture. Table 1 shows different mixing ratios for each group with the corresponding Young’s modulus, also the stiffness ratio between each group and the background.
Table 1.
Mixing ratio for different masses with corresponding Young’s modulus measured by using dynamic mechanical analyzer.
| Grp | Material | Mixing ratio A:B | Young’s Modulus (Kpa) | Group to background ratio | Classification |
|---|---|---|---|---|---|
| A | 3-4207 | 1:1 | 593 | 8.4 | Malignant |
| B | 3-4133 | 1.5:1 | 226 | 3.2 | Benign |
| C | 3-4207 | 1:1.2 | 171 | 2.4 | Benign |
| D | 3-4133 | 1.2:1 | 100 | 1.4 | Normal |
| Bck | A-341 | 1:10 | 71 | 1 | Normal |
| E | 3-4222 | 1:1.5 | 11~20 | 0.15~0.3 | Normal |
Four masses were created out of each group then submerged into a background made out of Factor2 A-341 silicon. All masses were cuboids with 10mm thick with varying sizes from 3mm to 12mm (see Fig. 6). The mass tumors were divided into two groups: groups A, B, C, and D are stiffer than the background while group E is softer than the background. In [52], Samani et al examined 169 fresh ex-vivo breast tissue containing different types of cancer masses. They determined that normal glandular tissue and fat had the same stiffness, while benign tumors are 2–3 times stiffer, and cancer masses range from 3 to 13 times stiffer than the background. Comparing these results to the phantom’s Young’s modulus, masses of group A would mimic malignant tumors, groups B and C would mimic benign masses, while groups D and E are normal tissue with stiffness very similar to the background stiffness.
Fig. 6.
Top) Layout for our custom made phantom containing four different masses with dimensions in mm. Bottom) image showing masses during phantom manufacturing with ruler scale. Group A, B, C, and D are harder than the background, while group E is softer than the background.
3.2. MRI Scanning protocol
We performed our scans on a 3T MRI Philips scanner (Philips Medical Systems, Best, the Netherlands) using a four-channel phased array breast coil and master gradient strength of 40mT/m with a slew rate of 200T/m/s.
T1-weighted scans was preformed with the following parameters: FOV=192×192mm2, Slice thickness=5mm, in-plane resolution =1×1mm2, Sense factor=2, Turbo-spin-echo (TSE) factor of 3, TR range=350 to 550ms, Act TR=495ms, Act TE=10ms, 5 slices were scanned in 39 sec with gap=−1mm. T2 Weighted spin echo scans with fat suppression was preformed with the following parameters: FOV=×192mm2, Slice thickness=5mm, in-plane resolution =1×1mm2, Sense factor=2, TSE factor of 12, SPAIR TR=1250ms, TR range=2500 to 5000ms, Act TR=2500ms, Act TE=60ms, 5 slices were scanned in 67 sec with gap=−1mm.
Steady state free precession (SSFP) with the following parameters: FOV=192×192mm2, slice thickness=5mm, resolution=22mm, temporal resolution=10ms. Visually from scanner we determined the response time=150ms and the transient time=450ms, setting the tagging delay to 100 ms and the trigger delay=500ms for both SENC and FSENC scans.
We used the same scanning parameters for both SENC and FSENC: FOV = 192×192mm2, last flip angle=80°, Cartesian K-space acquisition, strain range of zero stretching to −15% compressions. Using slice thickness of 5mm, we performed SENC and FSENC scans with in-plane resolution of 2×2 mm2, 3×3 mm2. All SENC scans used multi-shot acquisition with turbo-field-echo (TFE) factor of 10, with no echo-planar-imaging (EPI) factor. All FSENC scans had EPI factor of 3 with different TFE factors to finish the scan using one compression per slice.
FSENC with 3×3×5mm3 resolution resulted in image artifacts therefore we decided to double the slice thickness to 10mm and preformed SENC and FSENC scans. Since the tagging frequency depends on the strain range and slice thickness given by Eq. 4. For slice thickness of 5mm, ω0, ωL and ωH were calculated to be 1.132 mm−1, 1.132 mm−1 and 1.332 mm−1, respectively. While for slice thickness of 10mm, ω0, ωL and ωH, were calculated to be 0.5667 mm−1, 0.5667 mm−1 and 0.6667 mm−1, respectively.
A high resolution SENC scan was performed with in-plane resolution of 1×1mm2 and slice thickness of 5mm. FSENC could not accommodate for such high resolution, as it is required to be performed in one compression cycle. An extra SENC scan was performed while the device was in “compress and hold” mode, this experiment ensures that the contrast in the SENC images is only due to the compression of the tissue. Table 2 shows the scanning parameters for T1W, T2W and different variations of SENC and FSENC scans. We named SENC1, SENC2, SENC3 and FSENC1, FSENC2, FSENC3 scans having resolutions of 2×2×5 mm3, 3×3×5 mm3, 3×3×10 mm3, respectively, while SENC scan has resolution of 1×1×5 mm3.
Table 2.
Scanning parameters for T1W, T2W, SENC and different variations of FSENC scans. T1W and T2W are scanned while the device is in compress and hold position.
| Scan | In-plane resolution (mm) | Slice thickness (mm) | W0 =W0 mm−1 | WH mm−1 | TFE TSE |
EPI | Compression cycle/slice | Total Scan time (sec) for 5 slices |
|---|---|---|---|---|---|---|---|---|
| T1W | 1×1 | 5 | - | - | TSE=3 | - | - | 39 |
| T2W | 1×1 | 5 | - | - | TSE=12 | - | - | 67 |
| SENC | 1×1 | 5 | 1.132 | 1.332 | TFE=10 | Non | 19 | 190 |
| SENC1 | 2×2 | 5 | 1.132 | 1.332 | TFE=10 | Non | 9 | 90 |
| SENC2 | 3×3 | 5 | 1.132 | 1.332 | TFE=10 | Non | 6 | 60 |
| SENC3 | 3×3 | 10 | 0.567 | 0.667 | TFE=10 | Non | 6 | 60 |
| FSENC1 | 2×2 | 5 | 1.132 | 1.332 | TFE=17 | 3 | 1 | 10 |
| FSENC2 | 3×3 | 5 | 1.132 | 1.332 | TFE=11 | 3 | 1 | 10 |
| FSENC3 | 3×3 | 10 | 0.567 | 0.667 | TFE=11 | 3 | 1 | 10 |
3.3. Quantification
MRI signal-to-noise ratio (SNR) given in Eq. 7 is proportional to the voxel size and the square root of the readout period. SENC and FSENC scans had different resolutions of 1×1×5 mm3, 2×2×5 mm3, 3×3×5 mm3 and 3×3×10 mm3 leading to different voxel sizes of 5 mm3, 20 mm3, 45 mm3, and 90 mm3, respectively. All FSENC variations were scanned in one compression cycle while SENC scans used segmented K-space acquisition in 6, 9, and 19 compression cycles. Therefore, we predict that SENC scans would have greater SNR than FSENC scans.
| (7) |
Where S is the mean signal intensity in the phantom background and σ is the standard deviation of the noise calculated from a 30×30 pixel rectangular area outside the phantom. As we are interested in detecting and measuring the tumor size we used the CNR Elastography (CNRe) given in [40] by
| (8) |
where the background was calculated by including the pixels inside a circle surrounding the masses then excluding pixels inside the masses.
3.4 SENC breast Hardware accuracy
To show the accuracy and reproducibility of the SENC breast hardware, we measured the distance between compressions of the front plate relative to the fixed back plate. Measurements were performed at two different time intervals using a digital vernier caliper measurement tool. We measured 126 positions (42 different front plate setups at three different back plate positions) at each time point.
4. Results
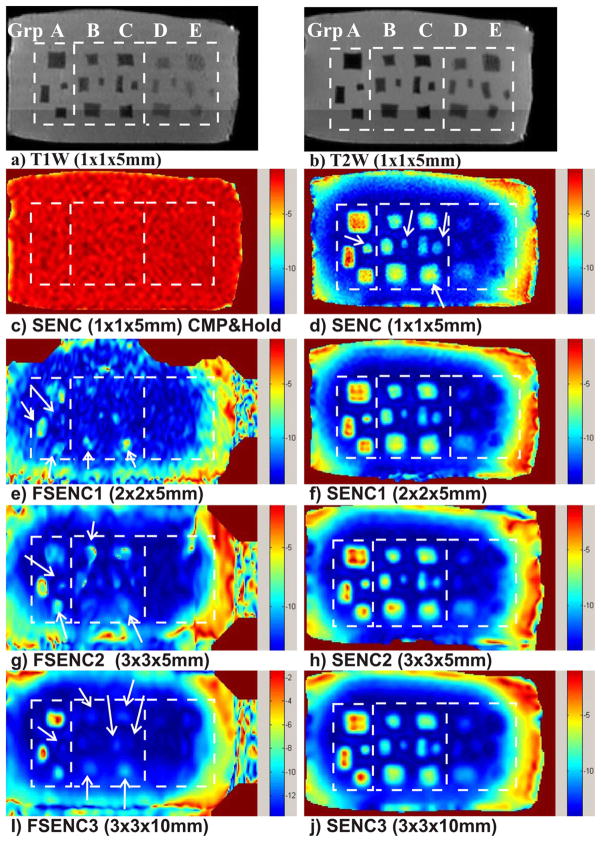
Representative T1- and T2-weighted images demonstrate of our phantom and the location of all five groups of masses in Fig. 7a) and 7b). A SENC breast MR image shown in Fig. 7c demonstrates the device during compress and hold. All masses are not visible, which indicates that SENC contrast is generated only due to the compression of the tissue. Fig. 7d, f, h and j show SENC images with scanning resolution of 1×1×5 mm3, 2×2×5mm3, 3×3×5 mm3, and 3×3×10 mm3, respectively. While Fig. 7e, g and i show FSENC images with scanning resolution of 2×2×5mm3, 3×3×5 mm3, and 3×3×10 mm3, respectively. The rectangles (dotted) in the figure points to locations of masses in the different groups of simulated breast tissue (A–E). The arrows point to image artifacts and invisible masses in phantom when using FSENC1, FSENC2 and FSENC3 images.
Fig. 7.
(a) T1 weighted and (b) T2 weighted images with fat suppression for phantom testing. c) SENC image of the phantom with the device operated in compress and hold mode. d, f, h, j) SENC strain images with different scanning resolutions of our phantom. e, g, i) FSENC strain images with different scanning resolutions. Dotted white rectangles separate the groups A, B and C, D and E of masses. Arrows point to missing (MRI invisible) masses on FSENC images.
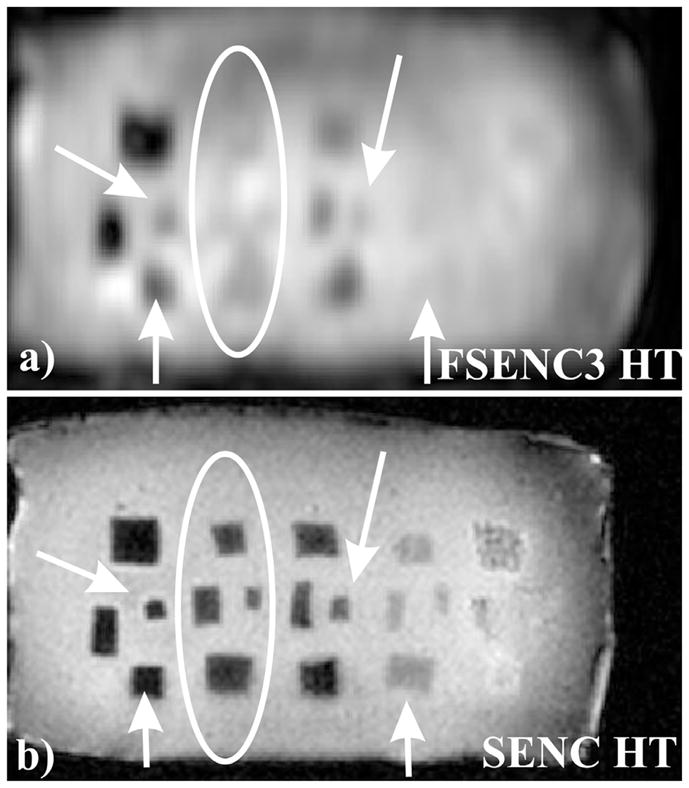
Fig 8a) and b) show the High Tune (HT) images for SENC and FSENC3 scans. Arrows point to blurred masses on the FSENC image due to lower resolution, while ellipse point to masses that are not visible in the FSENC3 HT image. Recall that as mentioned before in the methods section, HT reflects the anatomy while SENC images reflect the strain. Note that from the HT image of SENC, masses in groups D and E are detected. However, they do not appear on SENC images due to relatively close stiffness (100Kpa and 20Kpa) to the phantom background stiffness (70Kpa).
Fig. 8.
HT image for FSENC3 and SENC scans. a) FSENC3 HT image with in-plane resolution of 3×3mm and 10mm slice thickness. b) SENC HT image with in-plane resolution of 1×1mm and 5mm slice thickness. Arrows showing blurring in the masses in the FSENC image, ellipses showing four masses are MRI invisible in FSENC3 image.
Table 3 shows the SNR (mean ± SD) and CNRe for each of the masses groups for T1W, T2W, and different variation of SENC and FSENC. Finally, the reproducibility measurements of the SENC breast device resulted in a difference of less than 1mm between each two measurements with 1% strain difference.
Table 3.
SNR and CNRe of different mass groups for T1W, T2W, SENC, and FSENC scans.
| Group | SNR | CNRe | ||||
|---|---|---|---|---|---|---|
| A | B | C | D | E | ||
| T1W | 750±20 | 19±11 | 37±22 | 49±23 | 40±22 | 21±6 |
| T2W | 880±10 | 35±11 | 34±32 | 50±19 | 41±28 | 23±16 |
| SENC | 45±5 | 80±31 | 47±18 | 40±6 | - | - |
| SENC1 | 60±5 | 50±29 | 33±17 | 27±10 | - | - |
| SENC2 | 65±9 | 38±24 | 28±10 | 25±5 | - | - |
| SENC3 | 150±15 | 29±19 | 31±17 | 24±5 | - | - |
| FSENC1 | 22±3 | 7.8±5.5 | 2.2±2.2 | 2.7±3 | - | - |
| FSENC2 | 54±4 | 9.1±5.6 | 1.8±0.9 | 4.3±3 | - | - |
| FSENC3 | 110±10 | 10±7 | 1±2 | 5±7 | - | - |
5. Discussion
We have introduced new SENC breast hardware to obtain high accuracy strain measurements for detecting benign from malignant lesions and the device was validated using phantoms mimicking different breast tissue. We found that using this device coupled with SENC imaging on simulated breast masses of different stiffness, the masses were discriminated from background with high SNR (~47). Suggesting our SENC breast device would perform well distinguishing different tissue compositions typically seen in the breast. Moreover, we have improved the engineering design for more accurate compression and drastically improved user interface enabling easy transition into clinical practice. The SENC breast hardware improvements have increased the high resolution of SENC, where masses of different hardness can be separated from the background.
All masses are well identified using T1W and T2W images; however, all groups have same CNRe range (19–49). On the other hand SENC breast MRI detected masses in group A, B and C with CNRe of 80, 47, and 40 respectively; indicating that group A is harder than group B and group C. Both SENC and FSENC variations could not detect masses of groups D and E. Moreover, SENC has good CNRe (>20) for groups B, and C while FSENC has poor CNRe (<5).
Despite the high SNR of T1W (750) and T2W (880) images, it is hard to distinguish the soft masses for the hard ones. Nevertheless, these differences in hardness using SENC strain images with moderate SNR (45–150) was able to distinguish the hard masses in groups A, B, and C. However, masses in group D and E are not visible as they were very close to the background stiffness; Nevertheless, they were visible on the HT image of SENC. This ability to classify masses according to their relative stiffness difference can be extremely useful in distinguishing benign from malignant tumors in clinical settings. When comparing different variations of SENC and FSENC scans, SENC out performed FSENC in mass detection presumably due to higher SNR for SENC than FSENC. There were imaging artifacts and indistinguishable masses due to low SNR (22) of FSENC1 or low resolution of FSENC2 (3×3mm2). On the other hand, when using a slice thickness of 10mm for FSENC3, there was clear distinction of large masses of the hardest mass in group A and larger than 6mm(110); However, we could not differentiate masses smaller than 4mm because of the scanning resolution, or masses in group B or C.
6. Conclusion
In this work, we have introduced a novel MR-compatible SENC breast hardware device that enables us to achieve accurate and reproducible compressions to measure strain of different breast tissue. This device allows us to increase the scanning time to achieve higher resolution, SNR, and CNR compared to images acquired using FSENC. Results show that high-resolution SENC images have four-fold CNR increase relative to low-resolution FSENC images, which leads to better tumor detection. We demonstrated that SENC provides an additional parameter that is capable of detecting and classifying masses that are stiffer than the background. Future research is needed to determine tradeoff between compression level, scan-time, resolution, SNR, CNR and stiffness sensitivity.
Acknowledgments
NIH Grants: 1R01CA100184, P50CA103175, R01HL072704, 1P50HL08946, Breast Specialized Program of Research Excellence P50CA88843, 5P30CA006973, U01CA070095, Avon:01-2009
Footnotes
Publisher's Disclaimer: This is a PDF file of an unedited manuscript that has been accepted for publication. As a service to our customers we are providing this early version of the manuscript. The manuscript will undergo copyediting, typesetting, and review of the resulting proof before it is published in its final citable form. Please note that during the production process errors may be discovered which could affect the content, and all legal disclaimers that apply to the journal pertain.
References
- 1.American Cancer society. Cancer facts & figures 2009. 2009 http://www.cancer.org.
- 2.Bluemke DA, Gatsonis C, Chen M, DeAngelis G, DeBruhl N, Harms S, Heywang-Kobrunner S, Hylton N, Kuhl C, Lehman C, et al. Magnetic resonance imaging of the breast prior to biopsy. JAMA. 2004;292(22):2735. doi: 10.1001/jama.292.22.2735. [DOI] [PubMed] [Google Scholar]
- 3.Lehman C, Gatsonis C, Kuhl C, Hendrick R, Pisano E, Hanna L, Peacock S, Smazal S, Maki D, Julian T, et al. MRI evaluation of the contralateral breast in women with recently diagnosed breast cancer. NEJM. 2007;356(13):1295. doi: 10.1056/NEJMoa065447. [DOI] [PubMed] [Google Scholar]
- 4.Kuroki Y, Nasu K, Kuroki S, Murakami K, Hayashi T, Sekiguchi R, Nawano S. Diffusion-weighted imaging of breast cancer with the sensitivity encoding technique: analysis of the apparent diffusion coefficient value. Magnetic Resonance in Medical Sciences. 2004;3(2):79–85. doi: 10.2463/mrms.3.79. [DOI] [PubMed] [Google Scholar]
- 5.Jin G, An N, Jacobs MA, Li K. The Role of Parallel Diffusion-Weighted Imaging and Apparent Diffusion Coefficient (ADC) Map Values for Evaluating Breast Lesions Preliminary Results. Academic Radiology. 2010;17(4):456–463. doi: 10.1016/j.acra.2009.12.004. [DOI] [PMC free article] [PubMed] [Google Scholar]
- 6.Guo Y, Cai Y, Cai Z, Gao Y, An N, Ma L, Mahankali S, Gao J. Differentiation of clinically benign and malignant breast lesions using diffusion-weighted imaging. Journal of magnetic resonance imaging. 2002;16(2):172–178. doi: 10.1002/jmri.10140. [DOI] [PubMed] [Google Scholar]
- 7.Khouli EIRH, Jacobs MA, Mezban SD, Huang P, Kamel IR, Macura KJ, Bluemke DA. Diffusion-weighted imaging improves the diagnostic accuracy of conventional 3.0-T Breast MR imaging. Radiology. 2010 Jul;256(1):64–73. doi: 10.1148/radiol.10091367. [DOI] [PMC free article] [PubMed] [Google Scholar]
- 8.Kvistad K, Bakken I, Gribbestad I, Ehrnholm B, Lundgren S, Fjøsne H, Haraldseth O. Characterization of neoplastic and normal human breast tissues with in vivo 1H MR spectroscopy. Journal of Magnetic Resonance Imaging. 1999;10(2):159–164. doi: 10.1002/(sici)1522-2586(199908)10:2<159::aid-jmri8>3.0.co;2-0. [DOI] [PubMed] [Google Scholar]
- 9.Yeung D, Cheung H, Tse G. Human Breast Lesions: Characterization with Contrast-enhanced in Vivo Proton MR Spectroscopy-- Initial Results 1. Radiology. 2001;220(1):40. doi: 10.1148/radiology.220.1.r01jl0240. [DOI] [PubMed] [Google Scholar]
- 10.Roebuck J, Cecil K, Schnall M, Lenkinski R. Human breast lesions: characterization with proton MR spectroscopy. Radiology. 1998;209(1):269. doi: 10.1148/radiology.209.1.9769842. [DOI] [PubMed] [Google Scholar]
- 11.Katz-Brull R, Lavin P, Lenkinski R. Clinical utility of proton magnetic resonance spectroscopy in characterizing breast lesions. JNCI Journal of the National Cancer Institute. 2002;94(16):1197. doi: 10.1093/jnci/94.16.1197. [DOI] [PubMed] [Google Scholar]
- 12.Jacobs MA, Barker P, Bottomley P, Bhujwalla Z, Bluemke DA. Proton magnetic resonance spectroscopic imaging of human breast cancer: a preliminary study. Journal of Magnetic Resonance Imaging. 2004;19(1):68–75. doi: 10.1002/jmri.10427. [DOI] [PubMed] [Google Scholar]
- 13.Manduca A, Oliphant T, Dresner M, Mahowald J, Kruse S, Amromin E, Felmlee J, Greenleaf J, Ehman R. Magnetic resonance elastography: non-invasive mapping of tissue elasticity. Medical Image Analysis. 2001;5(4):237–254. doi: 10.1016/s1361-8415(00)00039-6. [DOI] [PubMed] [Google Scholar]
- 14.Sinkus R, Lorenzen J, Schrader D, Lorenzen M, Dargatz M, Holz D. High-resolution tensor MR elastography for breast tumour detection. Physics in Medicine and Biology. 2000;45(6):1649–1664. doi: 10.1088/0031-9155/45/6/317. [DOI] [PubMed] [Google Scholar]
- 15.Sinkus R, Tanter M, Catheline S, Lorenzen J, Kuhl C, Sondermann E, Fink M. Imaging anisotropic and viscous properties of breast tissue by magnetic resonance-elastography. Magnetic Resonance in Medicine. 2005;53(2):372–387. doi: 10.1002/mrm.20355. [DOI] [PubMed] [Google Scholar]
- 16.El Khouli RH, Jacobs MA, Bluemke DA. Magnetic resonance imaging of the breast. Seminars in roentgenology. 2008;43(4):265. doi: 10.1053/j.ro.2008.07.002. [DOI] [PubMed] [Google Scholar]
- 17.Sinkus R, Siegmann K, Xydeas T, Tanter M, Claussen C, Fink M. MR elastography of breast lesions: understanding the solid/liquid duality can improve the specificity of contrast-enhanced MR mammography. Magnetic Resonance in Medicine. 2007;58(6):1135–1144. doi: 10.1002/mrm.21404. [DOI] [PubMed] [Google Scholar]
- 18.Asbach P, Klatt D, Hamhaber U, Braun J, Somasundaram R, Hamm B, Sack I. Assessment of liver viscoelasticity using multifrequency MR elastography. Magnetic Resonance in Medicine. 2008;60(2):373– 379. doi: 10.1002/mrm.21636. [DOI] [PubMed] [Google Scholar]
- 19.Huwart L, Peeters F, Sinkus R, Annet L, Salameh N, ter Beek L, Horsmans Y, Van Beers B. Liver fibrosis: non-invasive assessment with MR elastography. NMR in Biomedicine. 2006;19(2):173–179. doi: 10.1002/nbm.1030. [DOI] [PubMed] [Google Scholar]
- 20.Huwart L, Sempoux C, Vicaut E, Salameh N, Annet L, Danse E, Peeters F, ter Beek L, Rahier J, Sinkus R, et al. Magnetic resonance elastography for the noninvasive staging of liver fibrosis. Gastroenterology. 2008;135(1):32–40. doi: 10.1053/j.gastro.2008.03.076. [DOI] [PubMed] [Google Scholar]
- 21.Kruse S, Rose G, Glaser K, Manduca A, Felmlee J, Jack C, Ehman R. Magnetic resonance elastography of the brain. Neuroimage. 2008;39(1):231–237. doi: 10.1016/j.neuroimage.2007.08.030. [DOI] [PMC free article] [PubMed] [Google Scholar]
- 22.Sack I, Beierbach B, Hamhaber U, Klatt D, Braun J. Non-invasive measurement of brain viscoelasticity using magnetic resonance elastography. NMR in Biomedicine. 2008;21(3):265–271. doi: 10.1002/nbm.1189. [DOI] [PubMed] [Google Scholar]
- 23.Kemper J, Sinkus R, Lorenzen J, Nolte-Ernsting C, Stork A, Adam G. MR elastography of the prostate: initial in-vivo application. RoFo: Fortschritte auf dem Gebiete der Rontgenstrahlen und der Nuklearmedizin. 2004;176(8):1094. doi: 10.1055/s-2004-813279. [DOI] [PubMed] [Google Scholar]
- 24.Sack I, Rump J, Elgeti T, Samani A, Braun J. MR elastography of the human heart: Noninvasive assessment of myocardial elasticity changes by shear wave amplitude variations. Magn Reson Med. 2008;61:668–677. doi: 10.1002/mrm.21878. [DOI] [PubMed] [Google Scholar]
- 25.Uffmann K, Maderwald S, Ajaj W, Galban C, Mateiescu S, Quick H, Ladd M. In vivo elasticity measurements of extremity skeletal muscle with MR elastography. NMR in Biomedicine. 2004;17(4):181–190. doi: 10.1002/nbm.887. [DOI] [PubMed] [Google Scholar]
- 26.Papazoglou S, Rump J, Braun J, Sack I. Shear wave group velocity inversion in MR elastography of human skeletal muscle. Magnetic Resonance in Medicine. 2006;56(3):489–497. doi: 10.1002/mrm.20993. [DOI] [PubMed] [Google Scholar]
- 27.O’Donnell M. NMR blood flow imaging using multiecho, phase contrast sequences. Medical Physics. 1985;12:59. doi: 10.1118/1.595736. [DOI] [PubMed] [Google Scholar]
- 28.Pelc N, Herfkens R, Shimakawa A, Enzmann D. Phase contrast cine magnetic resonance imaging. Magnetic Resonance Quarterly. 1991;7(4):229. [PubMed] [Google Scholar]
- 29.Bernstein M, Ikezaki Y. Comparison of phase-difference and complex-difference processing in phase-contrast MR angiography. Journal of Magnetic Resonance Imaging. 2005;1(6):725–729. doi: 10.1002/jmri.1880010620. [DOI] [PubMed] [Google Scholar]
- 30.Tse Z, Janssen H, Hamed A, Ristic M, Young I, Lamperth M. Magnetic resonance elastography hardware design: a survey. Proceedings of the Institution of Mechanical Engineers, Part H: Journal of Engineering in Medicine. 2009;223(4):497–514. doi: 10.1243/09544119JEIM529. [DOI] [PubMed] [Google Scholar]
- 31.Plewes D, Bishop J, Samani A, Sciarretta J. Visualization and quantification of breast cancer biomechanical properties with magnetic resonance elastography. Physics in Medicine and Biology. 2000;45(6):1591–1610. doi: 10.1088/0031-9155/45/6/314. [DOI] [PubMed] [Google Scholar]
- 32.Rossman P, Muthupillai R, Ehman R. US Patent 5, 952, 828 Driver device for MR elastography. 1999 Sep 14;
- 33.Doyley M, Weaver J, Van Houten E, Kennedy F, Paulsen K. Thresholds for detecting and characterizing focal lesions using steadystate MR elastography. Medical Physics. 2003;30:495. doi: 10.1118/1.1556607. [DOI] [PubMed] [Google Scholar]
- 34.Osman N, Sampath S, Atalar E, Prince J. Imaging longitudinal cardiac strain on short-axis images using strain-encoded MRI. Magnetic Resonance in Medicine. 2001;46(2):324–334. doi: 10.1002/mrm.1195. [DOI] [PubMed] [Google Scholar]
- 35.Osman N. Detecting stiff masses using strain-encoded (SENC) imaging. Magnetic Resonance in Medicine. 2003;49(3):606–608. doi: 10.1002/mrm.10376. [DOI] [PubMed] [Google Scholar]
- 36.Pan L, Stuber M, Kraitchman D, Fritzges D, Gilson W, Osman N. Real-time imaging of regional myocardial function using fast-SENC. Magnetic Resonance in Medicine. 2006;55(2):386–395. doi: 10.1002/mrm.20770. [DOI] [PubMed] [Google Scholar]
- 37.Fahmy A, Krieger A, Osman N. An integrated system for real-time detection of stiff masses with a single compression. IEEE Transactions on Biomedical Engineering. 2006;53(7):1286–1293. doi: 10.1109/TBME.2006.873690. [DOI] [PubMed] [Google Scholar]
- 38.Yousef T, Osman N. Effect of Noise and Slice Profile on Strain Quantifications of Strain Encoding (SENC) MRI. Lecture Notes in Computer Science. 2007;4466:50. [Google Scholar]
- 39.Stuber M, Spiegel M, Fischer S, Scheidegger M, Danias P, Pedersen E, Boesiger P. Single breath-hold slice-following CSPAMM myocardial tagging. Magnetic Resonance Materials in Physics, Biology and Medicine. 1999;9(1):85–91. doi: 10.1007/BF02634597. [DOI] [PubMed] [Google Scholar]
- 40.Bilgen M. Target detectability in acoustic elastography. IEEE Transactions on Ultrasonics, Ferroelectrics and Frequency Control. 1999;46(5):1128–1133. doi: 10.1109/58.796118. [DOI] [PubMed] [Google Scholar]
- 41.Fischer S, McKinnon G, Maier S, Boesiger P. Improved myocardial tagging contrast. Magnetic, resonance in medicine. 1993;30(2):191–200. doi: 10.1002/mrm.1910300207. [DOI] [PubMed] [Google Scholar]
- 42.Samani A, Zubovits J, Plewes D. Elastic moduli of normal and pathological human breast tissues: an inversion-technique-based investigation of 169 samples. Physics in medicine and biology. 2007;52(6):1565–1576. doi: 10.1088/0031-9155/52/6/002. [DOI] [PubMed] [Google Scholar]


