Abstract
While molecular regulation of insulin granule exocytosis is relatively well understood, insulin granule biogenesis and maturation and its influence on glucose homeostasis are relatively unclear. Here, we identify a novel protein highly expressed in insulin-secreting cells and name it BIG3 due to its similarity to BIG/GBF of the Arf-GTP exchange factor (GEF) family. BIG3 is predominantly localized to insulin- and clathrin-positive trans-Golgi network (TGN) compartments. BIG3-deficient insulin-secreting cells display increased insulin content and granule number and elevated insulin secretion upon stimulation. Moreover, BIG3 deficiency results in faster processing of proinsulin to insulin and chromogranin A to β-granin in β-cells. BIG3-knockout mice exhibit postprandial hyperinsulinemia, hyperglycemia, impaired glucose tolerance, and insulin resistance. Collectively, these results demonstrate that BIG3 negatively modulates insulin granule biogenesis and insulin secretion and participates in the regulation of systemic glucose homeostasis.
Keywords: insulin granule biogenesis, insulin resistance, insulin secretion, metabolism, proinsulin processing
Introduction
Insulin is the key molecule to regulate glucose homeostasis 1, and pancreatic β-cells are the primary source of insulin production and release 2. Besides defects in insulin secretion, increased proinsulin levels are seen in patients with abnormal fasting glucose, impaired glucose tolerance, and overt diabetes and are used as a predictive marker for disease onset 1,3,4. Elevated proinsulin levels may be due to defects in proinsulin processing and disproportionate proinsulin release, both of which occur in immature secretory granules (ISGs), the major organelles that store and process proinsulin 5. Although insulin secretion process is well defined 6, the mechanisms underlying insulin granule biogenesis and maturation and its influence on systemic glucose homeostasis remain unclear.
The biogenesis of post-Golgi secretory vesicles is under the tight control of Arf GTPases and coat proteins 7–10. Precise temporal and spatial activation of Arf proteins is controlled by their corresponding Arf-GTP exchange factors (GEFs) 11–13. Both the formation and maturation of ISGs require functional Arf and brefeldin A (BFA)-sensitive Arf-GEFs 14,15. The GBF/BIG subfamily of proteins is the only known BFA-sensitive Arf-GEFs. Moreover, proinsulin exits the trans-Golgi network (TGN) via clathrin-coated compartments 16–18, which requires Arf1 and BFA-sensitive Arf-GEF 8,11,12,19.
The insulin secretory granule contains a wide range of proteins that coordinate and regulate its behavior 20. Multiple proteomic studies reveal a large number of unknown or uncharacterized proteins that are associated with insulin granules 20,21. While searching for novel regulators of membrane trafficking by database mining, we identified a large Sec7 domain-containing protein, BIG3 as a novel insulin granule-associated protein. Here, we report functional studies of BIG3 in insulin granule biogenesis, insulin secretion, and glucose homeostasis.
Results and Discussion
BIG3 is a novel insulin granule-associated protein
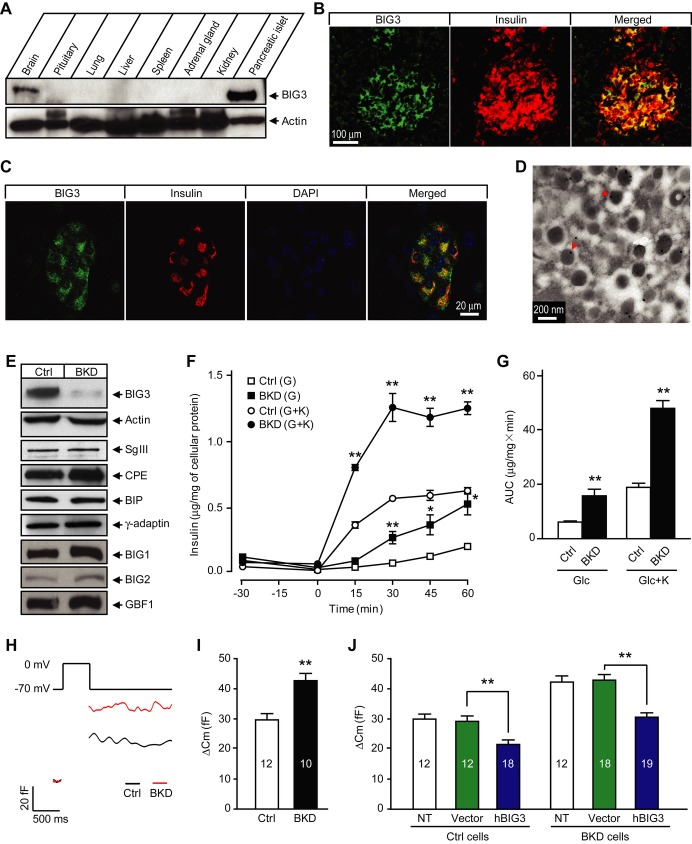
In a search for novel regulators of the insulin secretion pathway, we found the gene kiaa1244 with a high tissue-specific expression pattern. As the novel protein showed a significant sequence similarity to the GBF/BIG subfamily of Arf-GEF proteins, it was named BIG3. BIG3 was highly expressed in pancreatic islet, and to a lesser extent the brain, but was undetectable in other tissues when examined using a BIG3-specific antibody (Fig 1A and Supplementary Fig S1), consistent with previous observations 22. We confirmed specific co-staining of BIG3 with insulin in the mouse endocrine pancreas, but failed to detect BIG3 in the exocrine pancreas or pancreatic ductal cells (Fig 1B and C). Furthermore, BIG3 predominantly localized to insulin granules of islet β-cells, as revealed by immuno-EM (Fig 1D). These results confirm BIG3 as a novel insulin granule-associated protein and suggest that BIG3 may play a specific role in the insulin secretory pathway.
Figure 1. BIG3 associates with insulin granules and negatively regulates insulin secretion.
A BIG3 protein expression profile in adult mouse tissues.
B Immunostaining of mouse pancreas section showing BIG3 presence in insulin-positive cells.
C Immunostaining of isolated mouse islet showing co-localization of BIG3 and insulin.
D Representative electron microscopy (EM) image of mouse pancreatic β-cells. 87 ± 3% of BIG3 antibody-labeled gold particles (arrow heads) localized to insulin granules. N = 20 randomly selected images of β-cells.
E Immunoblot for BIG3 and other proteins in BIG3-knockdown (BKD) and control (Ctrl) cells.
F, G Insulin secretion time course (F) and quantification (area under curve, 0–60 min; G) in BKD and control cells under basal (2.8 mM glucose) and stimulated (16.7 mM glucose) condition in the absence or presence of 50 mM KCl (indicated as K). Data are presented as mean ± s.e.m. N = 6, *P < 0.05, **P < 0.01, t-test.
H, I Representative membrane capacitance recordings (H) and calculated exocytosis events (I) from capacitance increases in BKD and control cells. Data are presented as mean ± s.e.m. N = 10–12, **P < 0.01, t-test.
J Capacitance measurements of hBIG3 overexpression in BKD and control cells. Data are presented as mean ± s.e.m. N = 12–19, **P < 0.01, t-test.
BIG3 has a negative regulatory role in insulin secretion
BIG3 was highly expressed in several insulin-secreting β-cell lines, including MIN6 (Supplementary Fig S2). To analyze the cellular functions of BIG3, we first generated stable BIG3 knockdown (BKD) and scrambled control MIN6 cells by using lentiviral infection and FACS. BIG3 protein level in BKD cells was efficiently suppressed, while the expression levels of selected constitutive or vesicle-associated proteins were unaffected (Fig 1E). We next investigated the effect of BIG3 depletion on insulin secretion. BIG3 KD resulted in a marked increase in insulin secretion upon high glucose stimulation, and this effect was further exacerbated when combined with high K+ (Fig 1F and G). To examine whether increased insulin granule exocytosis contributed to the enhanced insulin secretion in BKD cells, we compared depolarization-evoked membrane capacitance at the single cell level by using the whole-cell patch-clamp technique. The change in capacitance, reflecting exocytosis-induced membrane expansion, was increased by approximately 44% in BKD cells compared to controls (Fig 1H and I). Importantly, expression of exogenous human BIG3 (hBIG3) in BKD cells completely reversed the KD phenotype, confirming that the observed insulin secretion phenotype is specific to BIG3 depletion (Fig 1J). Consistent with a negative role in insulin secretion, hBIG3 expression led to reduced insulin granule exocytosis (Fig 1J). Collectively, these results reveal that excessive BIG3 attenuates insulin granule exocytosis, while BIG3 deficiency promotes insulin granule exocytosis and insulin secretion in cultured β-cells.
Generation of BIG3-knockout mice
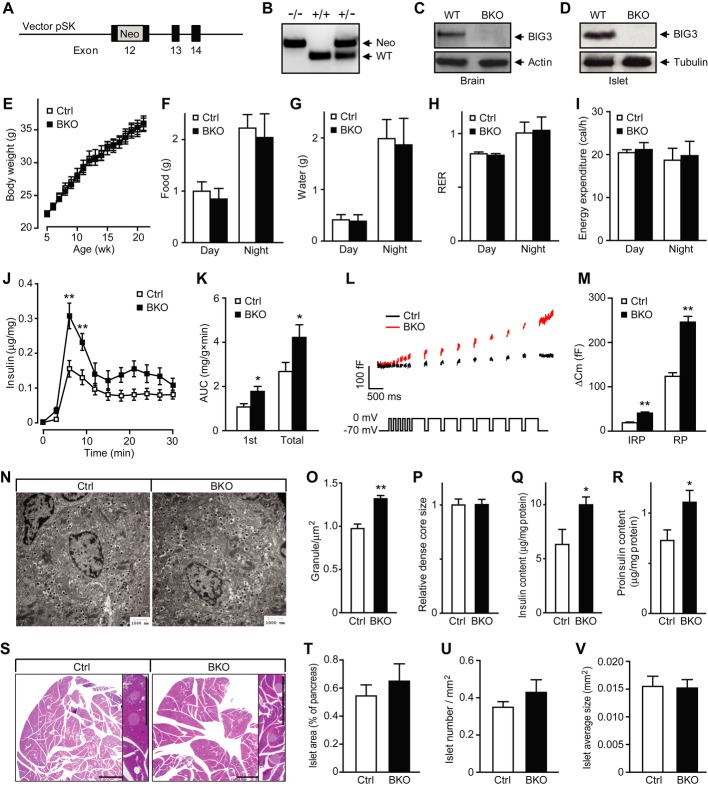
To study the in vivo effects of BIG3 ablation on islet function and consequent impact on systemic glucose homeostasis, we generated a BIG3-knockout mouse (BKO) by targeting the 12th exon, the largest exon encoding the majority of BIG3’s Sec7 domain (Fig 2A). BIG3 gene knockout was verified by PCR of the neo-insertion from genomic DNA (Fig 2B), and protein absence was confirmed by Western blot in brain and islet lysates (Fig 2C and D) and by immunohistochemistry in pancreas (Supplementary Fig S3). Deletion of BIG3 had no effect on the expression of other BIG proteins and insulin (Supplementary Fig S4). BKO, generated initially on a C57BL/6J-129/Sv mixed background, was backcrossed to 129/Sv mice for eight generations to generate a pure 129/Sv background. BKO mice were viable and fertile with normal body weight gain (Fig 2E). We also assessed the metabolic parameters by using the CLAMS system. No obvious difference was observed between BKO and control littermates in food intake, water consumption, respiratory exchange ratio, or energy expenditure (Fig 2F–I).
Figure 2. Increased insulin secretion and granule number in BIG3-knockout (BKO) islets.
A BKO vector: a Neo cassette was introduced into exon 12 to disrupt BIG3 gene expression.
B PCR genotyping of wild-type and mutant allele.
C, D Immunoblot of lysates of brain (C) and islets (D) from adult BKO and control mice.
E Body weights of BKO and littermate control mice. Data are presented as mean ± s.e.m. N = 11 per group, t-test.
F–I Metabolic parameters for food intake (F), water intake (G), respiratory exchange ratio (RER, H), and total energy expenditure (I). Data are presented as mean ± s.e.m. N = 6 per group, t-test.
J, K Perifusion analysis of insulin secretion time course (J) and quantification (AUC, K) of first phase and total insulin secretion in isolated islets from BKO and control mice. Data are presented as mean ± s.e.m. N = 8 from three independent islet isolations, *P < 0.05, **P < 0.01, t-test.
L, M Representative membrane capacitance recordings (L) and calculated exocytosis events (M) in BKO and control β-cells excited by five 50-ms (for measuring immediately releasable pool or IRP), and 8- to 500-ms depolarization pulses from −70 to 0 mV. RP, releasable pool. Data are presented as mean ± s.e.m. N = 16 from three independent islet isolations, **P < 0.01, t-test.
N Representative EM images of islet β-cells.
O Quantification of insulin granule density in the cytoplasm in β-cells. Data are presented as mean ± s.e.m. of 80 EM images of four mice per group, **P < 0.01, t-test.
P Size of insulin granule dense core. Data are presented as mean ± s.e.m. of 12 randomly selected EM images per group, t-test.
Q, R Insulin (Q) and (R) proinsulin content, normalized to total protein. Data are presented as mean ± s.e.m. N = 8 from three independent islet isolations, *P < 0.05, t-test.
S Representative images of H&E-stained pancreatic sections from BKO and control mice. Scale bars = 1 mm.
T–V Cumulative islet area (T), number (U), and size (V) were analyzed from 120 randomly selected pancreatic sections from four mice per group. Data are presented as mean ± s.e.m., t-test.
Increased insulin secretion in BKO islets
We next examined insulin secretion from isolated intact islets of BKO and control mice. Upon stimulation with high glucose, BKO islets exhibited a marked increase in first phase and total insulin secretion (Fig 2J and K). Depolarization-evoked exocytosis from isolated BKO β-cells increased approximately twofold compared to control at both early (immediately releasable pool) and late (releasable pool) time points (Fig 2L and M). EM analysis revealed that BKO β-cells had approximately 35% increase in the number of insulin granules when compared to control cells, while the size of dense core was similar (Fig 2N–P). We also observed a 50% increase in islet insulin and proinsulin content when measured by ELISA (Fig 2Q and R). In contrast, no difference was observed in the overall islet morphology, islet area, islet number, or islet size between BKO and control mice (Fig 2S–V). Together, these results indicate that BIG3 deficiency leads to elevated insulin content, insulin granule number, and enhanced secretion upon stimulation at the cell and islet level.
Abnormal glucose homeostasis in BKO mice
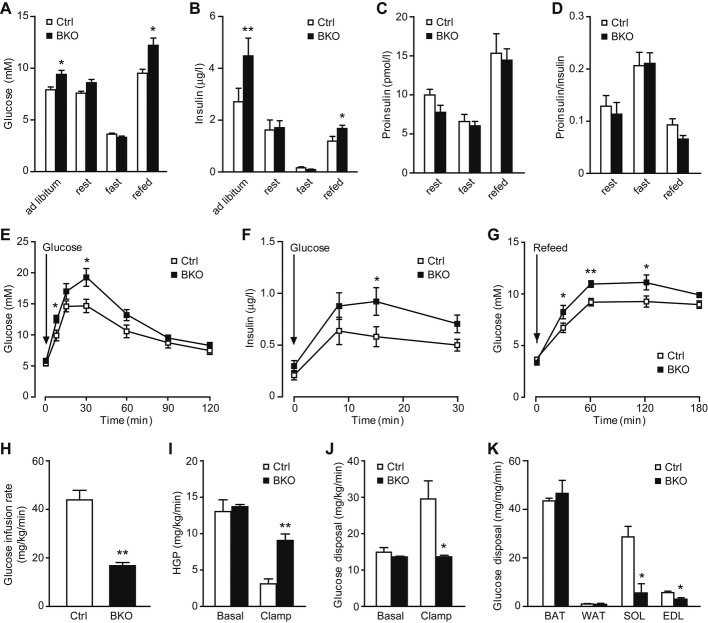
We next analyzed whether the altered insulin secretion at the islet level affected proper glucose handling and systemic glucose homeostasis. When fed a normal chow diet, three-month-old BKO mice were hyperglycemic and hyperinsulinemic under postprandial conditions (both ad libitum and fasting-refeeding), but not after 2-h or overnight fasting (Fig 3A and B). Serum proinsulin levels and proinsulin-to-insulin ratio were the same (Fig 3C and D). BKO mice also displayed delayed glucose clearance during an oral glucose tolerance test (GTT) after overnight fasting (Fig 3E), even though insulin secretion was elevated (Fig 3F), suggesting reduced insulin sensitivity in BKO mice. Consistently, impaired glucose clearance was observed in BKO mice upon re-feeding after overnight fasting (Fig 3G). To further ascertain the insulin sensitivity status, we performed hyperinsulinemic-euglycemic clamp studies on two-month-old mice. BKO mice displayed approximately 1.5-fold lower glucose infusion rate during clamping (Fig 3H), consistent with impaired glucose uptake. In response to hyperinsulinemia, hepatic glucose output (HGP) was reduced by > 75% in control mice, but only approximately 30% in BKO mice (Fig 3I). Overall glucose uptake rate doubled upon hyperinsulinemic clamping in control mice, though remained at basal levels in BKO mice (Fig 3J). Examination of peripheral tissues revealed that impaired glucose uptake was due to diminished muscle uptake, with approximately 80% decrease in soleus uptake and approximately 50% decrease in extensor digitorum longus uptake in BKO mice compared to controls (Fig 3K). Neither brown nor white adipose tissue was affected (Fig 3K). These results demonstrate that by 3 months of age, BKO mice have developed severe liver and muscle insulin resistance, possibly due to the chronic exposure of peripheral tissues to excessive insulin released by BKO islets. Our findings indicate that excessive insulin release may lead to severe peripheral insulin resistance and eventually disrupt glucose homeostasis in mice. This notion is consistent with the model that chronic hyperinsulinemia is the primary force driving insulin resistance, which has been well addressed by both in vitro and in vivo models 23.
Figure 3. Hyperglycemia, hyperinsulinemia, glucose intolerance, and insulin resistance in BIG3-knockout (BKO) mice.
A, B Postprandial glycemia (A) and insulinemia (B) in BKO and control mice. Data are presented as mean ± s.e.m. N = 14 per group, *P < 0.05, **P < 0.01, t-test.
C, D Serum proinsulin (C) and proinsulin-to-insulin ratio (D) at rest, fast, and refed conditions. Data are presented as mean ± s.e.m. N = 8 per group, t-test.
E Glucose levels of oral glucose tolerance tests (OGTT) for BKO and control mice. Data are presented as mean ± s.e.m. N = 12 per group, *P < 0.05, t-test.
F Insulin response during OGTT for BKO and control mice. Data are presented as mean ± s.e.m. N = 10 per group, *P < 0.05, t-test.
G Postprandial glycemia time course after fasting-refeeding. Data are presented as mean ± s.e.m. N = 10 per group, *P < 0.05, **P < 0.01, t-test.
H–K Hyperinsulinemic-euglycemic clamp measurements of glucose infusion rate (H), hepatic glucose production (HGP, I), overall glucose uptake (J), and muscle/adipose glucose uptake (K). BAT: brown adipose tissue; WAT: white adipose tissue; SOL: soleus muscle; EDL: extensor digitorum longus muscle. Data are presented as mean ± s.e.m. N = 3 per group, *P < 0.05, **P < 0.01, t-test.
BIG3 localizes to the TGN-ISG compartment
To investigate how BIG3 modulates insulin secretion, we assessed BIG3 KD MIN6 cells. BIG3 predominantly co-localized to insulin/chromogranin A (CGA)-containing granules, in close proximity to the Golgi compartment, but distant from the plasma membrane (Fig 4A). CGA is a prohormone co-sorted with proinsulin, and processed to β-granin, which is co-stored and secreted with insulin 24. Furthermore, BIG3 co-localized with γ-adaptin, a component of Adapter Protein I and a marker of clathrin-coated vesicles. Consistently, there was little co-localization of BIG3 with medial Golgi to TGN-resident protein markers, such as Vti1a, Stx6, GS28, and GM130 (Supplementary Fig S5). These findings suggest that BIG3 may exert its inhibitory effect at the early stages of secretory granule biogenesis, where they remain physically close to the Golgi compartment with clathrin coats.
Figure 4. BIG3 dynamically localizes to trans-Golgi network (TGN)-immature secretory granule (ISG) compartment.
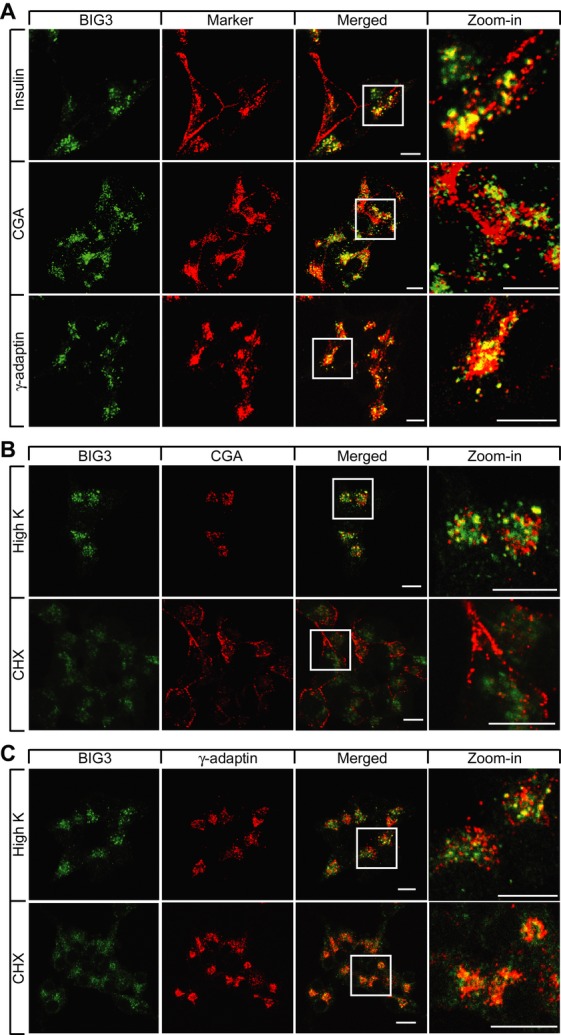
A–C Confocal images of MIN6 cells showing (A) TGN-granule localization of BIG3 under normal growth conditions, (B) perinuclear relocalization of BIG3 and chromogranin A (CGA) after high K+ and CHX treatments, and (C) intact TGN compartments during high K+ and CHX treatments. Scale bars = 10 μm.
Granule biogenesis from the TGN can be promoted by stimuli and inhibited by cargo protein depletion 25. Therefore, we examined the redistribution of BIG3 upon treatment with high K+, which stimulates insulin release, and cycloheximide (CHX), which suppresses granule biogenesis, in reference to markers of various subcellular compartments (Fig 4B, C). After high K+ stimulation, the subpopulation of docked granules, characterized by CGA staining and distributed along the plasma membrane, were depleted. Conversely, freshly generated granules were still clustered close to the Golgi region, where BIG3 overlapped with CGA and γ-adaptin (Fig 4B and C), suggesting that BIG3 is actively recruited to granules and influences secretory granule production. Following CHX treatment, CGA was mostly redistributed to the plasma membrane and did not overlap with BIG3 (Fig 4B). In contrast, BIG3 dispersed slightly, but remained in proximity to the Golgi region marked by γ-adaptin (Fig 4C). The γ-adaptin staining pattern did not change significantly after either treatment, indicating that the Golgi structure remained largely unaffected (Fig 4C). Taken together, these findings suggest that BIG3 is dynamically and predominantly recruited to the TGN where nascent immature granules are generated and whose abundance directly correlates with granule biogenic activity.
BIG3 negatively regulates insulin granule biogenesis
Both in vitro KD and in vivo KO experiments consistently demonstrate that regulated secretion is elevated in the absence of BIG3, consistent with the notion that BIG3 is a negative modulator of insulin secretion in β-cells. Similar to other types of secretory granules, nascent insulin granules form from the TGN as ISGs with clathrin coats, followed by prohormone processing and removal of clathrin coats to generate a clathrin-free mature secretory granule (MSG) 16. Therefore, there are typically two distinct populations of insulin/CGA-marked granules: ISGs that cluster toward the Golgi region and MSGs that spread along the plasma membrane. The fact that BIG3 is predominantly associated with insulin granules concentrated to the clathrin-patched TGN compartment suggests that BIG3 may be involved in insulin granule biogenesis. To explore the involvement of BIG3 in regulating nascent granule biogenesis, we assessed granule biogenic activity by measuring the prohormones and corresponding mature hormones. BIG3 KD in MIN6 cell resulted in a marked increase in cellular insulin (Fig 5A) and moderate increase in proinsulin (Fig 5B) under basal conditions. In addition, mature β-granin markedly increased, along with a minor increase in the precursor CGA in BKD cells (Fig 5C and D). The proportional change of the two pairs of proteins indicates that BIG3 may have a general role in modulating secretory granules.
Figure 5. BIG3 negatively regulates insulin granule biogenesis.
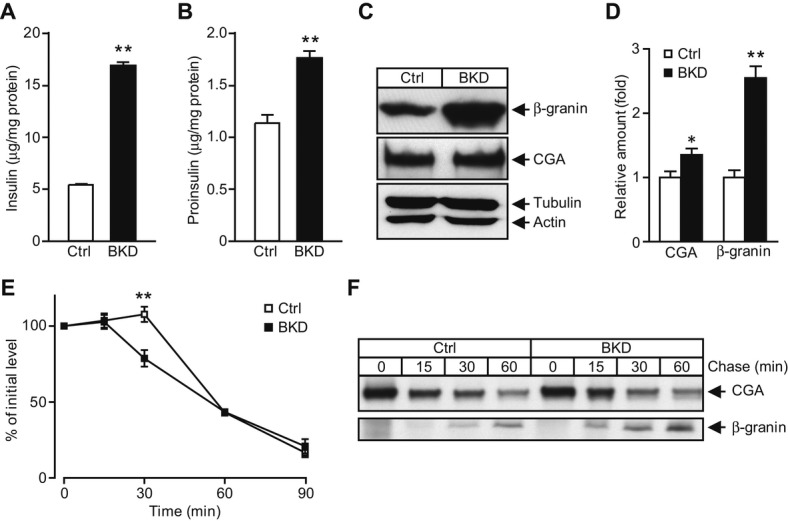
A, B Cellular content of insulin (A) and proinsulin (B), normalized to total protein in BIG3-knockdown (BKD) and control cells. Data are presented as mean ± s.e.m. N = 6 per group, **P < 0.01, t-test.
C, D Cellular content of β-granin and chromogranin A (CGA) by immunoblotting (C) and normalized to actin (D) in BKD and control cells. Data are presented as mean ± s.e.m. N = 4 per group, *P < 0.05, **P < 0.01, t-test.
E Proinsulin processing rate, normalized to total protein and Time 0 after CHX treatment. Data are presented as mean ± s.e.m. N = 7 per group, **P < 0.01, t-test.
F Cellular CGA and β-granin processing was assessed by pulse-chase experiments, and lysates were immunoprecipitated from BKD and control cells. Representative blots from three independent experiments are shown.
The decreased prohormone-to-mature-hormone ratio may be due to enhanced prohormone processing. Therefore, we measured proinsulin processing at multiple time points in MIN6 cell lysates after 1-h high K+ stimulation to promote and synchronize proinsulin synthesis, and another hour of CHX treatment to inhibit proinsulin synthesis and exocytosis. BKD cells had a significant decrease in proinsulin at 30 min, indicating that proinsulin was processed faster in BKD than in control cells (Fig 5E). The timing on proinsulin processing is in line with s previous study 26. We also determined CGA processing in BKD cells by pulse-chase labeling of newly made proteins with 35S-methionine and found faster conversion of CGA to β-granin in BKD cells than in control cells (Fig 5F). Since granule production is coupled with prohormone production, these findings suggest that BIG3 is involved in a negative feedback mechanism to restrain granule biogenesis. The notion is further supported by the finding that BIG3 overexpression attenuated simulated exocytosis in MIN6 cells (Fig 1J). Collectively, these results suggest that BIG3 negatively regulates granule biogenesis: upon its removal, granule biogenesis and hormone production and storage are elevated. Consistent with preferential release of newly synthesized insulin granules 27–29, increased granule biogenesis leads to a larger pool of fresh insulin granules and consequently enhances secretion upon stimulation.
The molecular mechanism by which BIG3 modulates granule biogenesis is yet to be elucidated. It is well known that proinsulin transport requires Class I Arfs and their corresponding GEFs. GBF/BIG are the only known BFA-sensitive Arf-GEF, and multiple lines of evidence have shown that both secretory granule formation from the TGN and ISG maturation require Class I Arf activity in a BFA-sensitive manner. This suggests that a yet to be identified BFA-sensitive Arf-GEF is required. It is worth noting that the single known functional domain in BIG3 by sequence analysis, the Sec7 domain, has a non-functional catalytic motif 11. Thus, one of our hypotheses is that BIG3 acts as a competitive non-functional Arf-GEF, thereby negatively modulating granule production. The expression levels of BIG1/2 and GBF1 were not changed in BKO or BKD cells; however, whether their bioactivity in granule formation is affected remains to be studied. An alternative explanation could involve a mechanism similar to Arf4/Arf5, which binds to soma calcium-dependent activator protein for secretion (CAPS) proteins at the TGN to promote dense core vesicle formation in a guanosine diphosphate (GDP)-dependent manner, thereby bypassing the need for a functional GEF 30. It is not clear whether a similar mechanism applies to insulin granule formation and how BIG3 is involved. Currently, we are exploring direct evidence of BIG3 engagement in granule formation. It is worth noting that BIG3 is also expressed in the brain (Fig 1A). Whether BIG3 in the CNS contributes to the observed metabolic phenotypes remains to be determined.
In summary, our study shows that BIG3 is associated with immature insulin granules and negatively modulates insulin granule biogenesis in β-cells and, in turn, insulin output by islets. Consequently, deletion of BIG3 in mice results in increased levels of circulating insulin and disrupted glucose homeostasis, including postprandial hyperglycemia and impaired glucose tolerance. Overall, our study identifies a novel regulatory mechanism for granule biogenesis and maturation that plays a significant role in modulating systemic metabolism.
Materials and Methods
All experiments involving animals were reviewed and approved by the Institutional Animal Care and Use Committee of A*STAR. Indirect calorimetry and other physiology tests were performed as previously described 6,31,32. For detailed information, see Supplementary Materials and Methods.
Acknowledgments
Research in the laboratories of Hong and Han was supported by A*STAR Biomedical Research Council. A. Xu was supported by Hong Kong Research Grant Council (HKU4/CRF/10R).
Author contributions
HL, WH, and WH designed the study; HL, SW, KC, and NG performed the experiments; HL, RE, AX, WH, and WH wrote the paper; all authors were involved in data analysis and approved the manuscript.
Conflict of interest
The authors declare that they have no conflict of interest.
Supporting Information
Supplementary information for this article is available online: http://embor.embopress.org
References
- Saltiel AR. New perspectives into the molecular pathogenesis and treatment of type 2 diabetes. Cell. 2001;104:517–529. doi: 10.1016/s0092-8674(01)00239-2. [DOI] [PubMed] [Google Scholar]
- Kulkarni RN. The islet beta-cell. Int J Biochem Cell Biol. 2004;36:365–371. doi: 10.1016/j.biocel.2003.08.010. [DOI] [PubMed] [Google Scholar]
- Kahn SE, Zraika S, Utzschneider KM, Hull RL. The beta cell lesion in type 2 diabetes: there has to be a primary functional abnormality. Diabetologia. 2009;52:1003–1012. doi: 10.1007/s00125-009-1321-z. [DOI] [PMC free article] [PubMed] [Google Scholar]
- Hanley AJ, D’Agostino R, Jr, Wagenknecht LE, Saad MF, Savage PJ, Bergman R, Haffner SM. Increased proinsulin levels and decreased acute insulin response independently predict the incidence of type 2 diabetes in the insulin resistance atherosclerosis study. Diabetes. 2002;51:1263–1270. doi: 10.2337/diabetes.51.4.1263. [DOI] [PubMed] [Google Scholar]
- Hutton JC. Insulin secretory granule biogenesis and the proinsulin-processing endopeptidases. Diabetologia. 1994;37(Suppl 2):S48–S56. doi: 10.1007/BF00400826. [DOI] [PubMed] [Google Scholar]
- Gustavsson N, Wei SH, Hoang DN, Lao Y, Zhang Q, Radda GK, Rorsman P, Sudhof TC, Han W. Synaptotagmin-7 is a principal Ca2+ sensor for Ca2+-induced glucagon exocytosis in pancreas. J Physiol. 2009;587:1169–1178. doi: 10.1113/jphysiol.2008.168005. [DOI] [PMC free article] [PubMed] [Google Scholar]
- Tooze SA, Weiss U, Huttner WB. Requirement for GTP hydrolysis in the formation of secretory vesicles. Nature. 1990;347:207–208. doi: 10.1038/347207a0. [DOI] [PubMed] [Google Scholar]
- Serafini T, Orci L, Amherdt M, Brunner M, Kahn RA, Rothman JE. ADP-ribosylation factor is a subunit of the coat of Golgi-derived COP-coated vesicles: a novel role for a GTP-binding protein. Cell. 1991;67:239–253. doi: 10.1016/0092-8674(91)90176-y. [DOI] [PubMed] [Google Scholar]
- Leyte A, Barr FA, Kehlenbach RH, Huttner WB. Multiple trimeric G-proteins on the trans-Golgi network exert stimulatory and inhibitory effects on secretory vesicle formation. EMBO J. 1992;11:4795–4804. doi: 10.1002/j.1460-2075.1992.tb05585.x. [DOI] [PMC free article] [PubMed] [Google Scholar]
- Ohashi M, Huttner WB. An elevation of cytosolic protein phosphorylation modulates trimeric G-protein regulation of secretory vesicle formation from the trans-Golgi network. J Biol Chem. 1994;269:24897–24905. [PubMed] [Google Scholar]
- Casanova JE. Regulation of Arf activation: the Sec7 family of guanine nucleotide exchange factors. Traffic. 2007;8:1476–1485. doi: 10.1111/j.1600-0854.2007.00634.x. [DOI] [PubMed] [Google Scholar]
- D’Souza-Schorey C, Chavrier P. ARF proteins: roles in membrane traffic and beyond. Nat Rev Mol Cell Biol. 2006;7:347–358. doi: 10.1038/nrm1910. [DOI] [PubMed] [Google Scholar]
- Niu TK, Pfeifer AC, Lippincott-Schwartz J, Jackson CL. Dynamics of GBF1, a brefeldin A-sensitive Arf1 exchange factor at the Golgi. Mol Biol Cell. 2005;16:1213–1222. doi: 10.1091/mbc.E04-07-0599. [DOI] [PMC free article] [PubMed] [Google Scholar]
- Fernandez CJ, Haugwitz M, Eaton B, Moore HP. Distinct molecular events during secretory granule biogenesis revealed by sensitivities to brefeldin A. Mol Biol Cell. 1997;8:2171–2185. doi: 10.1091/mbc.8.11.2171. [DOI] [PMC free article] [PubMed] [Google Scholar]
- Eaton BA, Haugwitz M, Lau D, Moore HP. Biogenesis of regulated exocytotic carriers in neuroendocrine cells. J Neurosci. 2000;20:7334–7344. doi: 10.1523/JNEUROSCI.20-19-07334.2000. [DOI] [PMC free article] [PubMed] [Google Scholar]
- Orci L, Ravazzola M, Storch MJ, Anderson RG, Vassalli JD, Perrelet A. Proteolytic maturation of insulin is a post-Golgi event which occurs in acidifying clathrin-coated secretory vesicles. Cell. 1987;49:865–868. doi: 10.1016/0092-8674(87)90624-6. [DOI] [PubMed] [Google Scholar]
- Orci L, Halban P, Amherdt M, Ravazzola M, Vassalli JD, Perrelet A. A clathrin-coated, Golgi-related compartment of the insulin secreting cell accumulates proinsulin in the presence of monensin. Cell. 1984;39:39–47. doi: 10.1016/0092-8674(84)90189-2. [DOI] [PubMed] [Google Scholar]
- Helms JB, Rothman JE. Inhibition by brefeldin A of a Golgi membrane enzyme that catalyses exchange of guanine nucleotide bound to ARF. Nature. 1992;360:352–354. doi: 10.1038/360352a0. [DOI] [PubMed] [Google Scholar]
- Rosa P, Barr FA, Stinchcombe JC, Binacchi C, Huttner WB. Brefeldin A inhibits the formation of constitutive secretory vesicles and immature secretory granules from the trans-Golgi network. Eur J Cell Biol. 1992;59:265–274. [PubMed] [Google Scholar]
- Suckale J, Solimena M. The insulin secretory granule as a signaling hub. Trends Endocrinol Metab. 2010;21:599–609. doi: 10.1016/j.tem.2010.06.003. [DOI] [PubMed] [Google Scholar]
- Schvartz D, Brunner Y, Coute Y, Foti M, Wollheim CB, Sanchez JC. Improved characterization of the insulin secretory granule proteomes. J Proteomics. 2012;75:4620–4631. doi: 10.1016/j.jprot.2012.04.023. [DOI] [PubMed] [Google Scholar]
- Kim JW, Akiyama M, Park JH, Lin ML, Shimo A, Ueki T, Daigo Y, Tsunoda T, Nishidate T, Nakamura Y, et al. Activation of an estrogen/estrogen receptor signaling by BIG3 through its inhibitory effect on nuclear transport of PHB2/REA in breast cancer. Cancer Sci. 2009;100:1468–1478. doi: 10.1111/j.1349-7006.2009.01209.x. [DOI] [PMC free article] [PubMed] [Google Scholar]
- Mehran AE, Templeman NM, Brigidi GS, Lim GE, Chu KY, Hu X, Botezelli JD, Asadi A, Hoffman BG, Kieffer TJ. Hyperinsulinemia drives diet-induced obesity independently of brain insulin production. Cell Metab. 2012;16:723–737. doi: 10.1016/j.cmet.2012.10.019. [DOI] [PubMed] [Google Scholar]
- Hendy GN, Bevan S, Mattei MG, Mouland AJ. Chromogranin A. Clin Invest Med. 1995;18:47–65. [PubMed] [Google Scholar]
- Trucco A, Polishchuk RS, Martella O, Di Pentima A, Fusella A, Di Giandomenico D, San Pietro E, Beznoussenko GV, Polishchuk EV, Baldassarre M. Secretory traffic triggers the formation of tubular continuities across Golgi sub-compartments. Nat Cell Biol. 2004;6:1071–1081. doi: 10.1038/ncb1180. [DOI] [PubMed] [Google Scholar]
- Kuliawat R, Prabakaran D, Arvan P. Proinsulin endoproteolysis confers enhanced targeting of processed insulin to the regulated secretory pathway. Mol Biol Cell. 2000;11:1959–1972. doi: 10.1091/mbc.11.6.1959. [DOI] [PMC free article] [PubMed] [Google Scholar]
- Gold G, Landahl HD, Gishizky ML, Grodsky GM. Heterogeneity and compartmental properties of insulin storage and secretion in rat islets. J Clin Invest. 1982;69:554–563. doi: 10.1172/JCI110481. [DOI] [PMC free article] [PubMed] [Google Scholar]
- Duncan RR, Greaves J, Wiegand UK, Matskevich I, Bodammer G, Apps DK, Shipston MJ, Chow RH. Functional and spatial segregation of secretory vesicle pools according to vesicle age. Nature. 2003;422:176–180. doi: 10.1038/nature01389. [DOI] [PubMed] [Google Scholar]
- Pedersen MG, Sherman A. Newcomer insulin secretory granules as a highly calcium-sensitive pool. Proc Natl Acad Sci USA. 2009;106:7432–7436. doi: 10.1073/pnas.0901202106. [DOI] [PMC free article] [PubMed] [Google Scholar]
- Sadakata T, Shinoda Y, Sekine Y, Saruta C, Itakura M, Takahashi M, Furuichi T. Interaction of calcium-dependent activator protein for secretion 1 (CAPS1) with the class II ADP-ribosylation factor small GTPases is required for dense-core vesicle trafficking in the trans-Golgi network. J Biol Chem. 2010;285:38710–38719. doi: 10.1074/jbc.M110.137414. [DOI] [PMC free article] [PubMed] [Google Scholar]
- Lou PH, Gustavsson N, Wang Y, Radda GK, Han W. Increased lipolysis and energy expenditure in a mouse model with severely impaired glucagon secretion. PLoS ONE. 2011;6:e26671. doi: 10.1371/journal.pone.0026671. [DOI] [PMC free article] [PubMed] [Google Scholar]
- Gustavsson N, Lao Y, Maximov A, Chuang JC, Kostromina E, Repa JJ, Li C, Radda GK, Südhof TC, Han W. Impaired insulin secretion and glucose intolerance in synaptotagmin-7 null mutant mice. Proc Natl Acad Sci USA. 2008;105:3992–3997. doi: 10.1073/pnas.0711700105. [DOI] [PMC free article] [PubMed] [Google Scholar]
Associated Data
This section collects any data citations, data availability statements, or supplementary materials included in this article.


