

Abstract
Evidence for specific protein–protein interactions is increasingly available from both small- and large-scale studies, and can be viewed as a network. It has previously been noted that errors are frequent among large-scale studies, and that error frequency depends on the large-scale method used. Despite knowledge of the error-prone nature of interaction evidence, edges (connections) in this network are typically viewed as either present or absent. However, use of a probabilistic network that considers quantity and quality of supporting evidence should improve inference derived from protein networks. Here we demonstrate inference of membership in a partially known protein complex by using a probabilistic network model and an algorithm previously used to evaluate reliability in communication networks.
In the past few years, much effort has gone into developing and applying methods for discovering the complete set of protein–protein interactions in an organism—the interactome. The results of both large- and small-scale studies have been collected into databases (Hodges et al. 1999; Mewes et al. 2002; Xenarios et al. 2002; Bader et al. 2003), and it is apparent that the number of interactions derived from small-scale methods, such as affinity chromatography and cosedimentation, is now low compared with those derived from high-throughput techniques such as large-scale yeast two-hybrid (Y2H) screens (Uetz et al. 2000; Ito et al. 2001) and affinity purification with mass spectrometric identification (APMS) methods (Gavin et al. 2002; Ho et al. 2002).
Although these large-scale methods offer vast improvements in efficiency for identifying protein interactions, they are also prone to higher error rates than are conventional small-scale studies, and some large-scale methods are more reliable than others (Mrowka et al. 2001; Deane et al. 2002; Edwards et al. 2002; von Mering et al. 2002; Deng et al. 2003; Sprinzak et al. 2003). Notwithstanding high error rates, it seems likely that high-throughput studies will continue to be the largest source of information about protein–protein interactions.
Analyses of protein interaction evidence have generally treated interaction evidence as binary. By this, we mean that interaction data are often represented as a network in which edges are either present or absent based on the existence of supporting evidence. Conclusions are then drawn from this network without accounting for the quality or quantity of evidence supporting each interaction. This binary approach has been used previously in predicting protein function (Marcotte et al. 1999; Schwikowski et al. 2000) in predicting co-complexed proteins (Bader and Hogue 2003; Bu et al. 2003; Rives and Galitski 2003; Spirin and Mirny 2003).
Given the generally error-prone nature of high-throughput protein interaction evidence, it may be more appropriate to treat protein interactions probabilistically. Probabilistic networks have previously been used to examine the reliability of communications networks (for review, see Ball 1986). A communications network can be represented as a weighted graph, in which each node represents a computer (terminal) and each edge represents a network connection (wire) between two terminals. Edge weights are assigned that represent the reliability of the connection—the probability that the wire is functioning at any given time.
Several publications from the Gerstein group at Yale (Edwards et al. 2002; Jansen et al. 2002, 2003) have assigned probabilities to individual protein pairs based on amount and type of supporting evidence. Such a collection of probabilities may be viewed as a probabilistic network. Here, we demonstrate the utility of such a probabilistic network in predicting new members of a partially known protein complex. In this application, a particular “core” set of proteins is known to form a protein complex, but we are not confident that this core set is complete. Given a collection of error-prone protein interaction data, how might we obtain a list of candidate proteins, ranked by probability of membership in a partially known protein complex?
RESULTS AND DISCUSSION
In the commonly used binary representation of protein interactions, there is no particular distinction afforded to those edges with support from multiple evidence types, or a distinction between edges supported by evidence of differing quality. Although binary representations have been used with some success to predict protein complexes (Jansen et al. 2002; Bader and Hogue 2003; Bu et al. 2003; Rives and Galitski 2003) and protein function (Marcotte et al. 1999; Schwikowski et al. 2000), we expected that information about quality and quantity of evidence lost in constructing a binary network could prove useful in improving these predictions.
We used a probabilistic model for protein interaction networks that accounts for quality of supporting evidence for each interaction. In this model, each pair of proteins with supporting evidence of interaction was assigned a weight, representing the probability that the two proteins interact directly and stably. Because no unbiased reference set of directly- and stably-interacting proteins exists, parameters in the probabilistic model were chosen to optimize performance of our method (see below), using a training set of protein complexes as described in the Methods section.
We applied an algorithm that uses this probabilistic network model to generate a list of candidate proteins ranked according to the probability that each “connects” to one or more proteins in a query list—the core protein set. Here a protein is said to connect to the core if there is at least one path of direct and stable interactions between it and one of the core proteins. The algorithm we developed uses a large collection of networks, in which each edge is a binary interaction with existence that is determined by a Bernoulli trial using the probability from the corresponding edge in the probabilistic network. The probability that a given candidate protein connects to the core set is estimated as the fraction of sampled networks that contains a path connecting the candidate to the core. A probabilistic network and two sampled binary networks are illustrated in Figure 1.
Figure 1.

Probabilistic versus binary networks. (A) Schematic illustration of a probabilistic network, with higher edge weight (probability) represented by darker coloring. (B, C) Binary networks randomly sampled from the probabilistic network in A.
Software called Complexpander, which implements this algorithm, was developed, allowing a user to submit a core set of proteins and obtain additional candidate members of this core complex using an evaluation of 10,000 sampled networks. In addition to returning a list of candidate proteins ranked by probability of connecting to the core complex, the software returns a graph representing the interaction neighborhood of the core set of proteins. Visualization of such graphs using Pajek (Batagelj and Mrvar 1998) is shown in Figure 2 for four example queries, each using a protein complex from the MIPS catalog (Mewes et al. 2002) as the “core” protein set. For each query, we used the MIPS complex catalog database as of June 20, 2003.
Figure 2.

Results of several examples using MIPS complexes (Mewes et al. 2002) as “core complex” queries. Probabilistic interaction subgraphs are visualized by the software Pajek (Batagelj and Mrvar 1998). Query proteins are marked in red, and the top 50 proteins returned are colored in grayscale according to rank, with lighter coloring indicating better rank. Each edge is given thickness proportional to its posterior probability. Shown are SAGA complex (A), NOT complex (B), replication factor C complex (C), and the Arp2/Arp3 complex (D).
Results of a query with the SAGA complex (according to MIPS) are shown in Figure 2A. The top-ranked three candidate proteins returned (most reliably connected to core) were the TATA-binding protein associated factors Taf19, Taf145, and Taf40. Although none of these proteins are currently thought to be members of the SAGA complex, they are each members of the TFIID and the TBP-associated TAF[II] complexes, each of which has substantial overlap with the SAGA complex (Hodges et al. 1999). The fourth-ranked protein is Sgf29, a known member of the SAGA complex (Sanders et al. 2002), despite not being listed in MIPS. Other known members of the SAGA complex that are not listed in MIPS were also retrieved in the top 50: Sgf73 (Sanders et al. 2002), ranked 12th; Hfi1 (Grant et al. 1998), ranked 31st; and Ubp8 (Sanders et al. 2002), ranked 39th.
Results of a query with the NOT (negative on TATA) complex, as defined in the MIPS catalog, is shown in Figure 2B. The NOT complex was originally identified as a global negative regulator of transcription (Collart and Struhl 1994; Oberholzer and Collart 1998). Our query retrieved Ccr4 (ranked first) and Pop2 (ranked third), both known members of this complex—now more commonly called the Ccr4-NOT complex (Tucker et al. 2002)—that were not listed as NOT members in MIPS.
Results of a query with the replication factor C (RFC) complex, as defined by MIPS, are shown in Figure 2C. RFC is a “clamp loader” for the Proliferating Cell Nuclear Antigen (PCNA) replication processivity factor (Cullmann et al. 1995; Zhang et al. 1999) and is normally formed from proteins Rfc1-5 (the query set). Ctf18, ranked second, is an Rfc1-like protein that has been suggested to complex with Rfc2-5 (Hanna et al. 2001). Elg1, ranked third, participates in an alternate RFC with Rfc2-5 that has a role in DNA damage repair (Bellaoui et al. 2003). Rad24, ranked 12th, is also known to form an alternative complex with Rfc2-5 (Majka and Burgers 2003).
As a final example, the results of a query with the Arp2/Arp3 complex, integrally involved in actin polymerization, are shown in Figure 2D. The top-ranked candidate protein was Arc40, a known member of the Arp2/Arp3 complex not listed in MIPS (Winter et al. 1999).
To rigorously assess the performance of our software in predicting new complex members, we examined a validation set of 27 complexes from the MIPS database of yeast protein complexes (see Methods). For each complex in the validation set, we left each protein out in turn and used the remaining proteins as the core set in a trial query for new complex members. The fraction of trial queries in which the target protein was found above a threshold rank R was assessed.
We wished to compare the performance of our “probabilistic network” (ProNet) method to an alternative method that uses a binary protein interaction network, in which an edge between two proteins exists if there is any evidence supporting their interaction. As no algorithm for ranking candidate members in a partially known protein complex was known to us (with one exception discussed below), we developed the “shortest path with evidence” (SPE) method. In the SPE method, the ranking of candidate protein members is simply by length of the shortest path through the binary network to one of the core proteins, with ties broken randomly.
The results for both ProNet and SPE methods are shown in Figure 3. In this graph, the fraction of correctly returned proteins above threshold rank R is plotted as a function of R. Because only one protein was left out of the known complex for each query, the best fraction of correctly returned proteins that any algorithm could hope to achieve is 1/R. As shown in Figure 3, the ProNet method outperformed the SPE method at every choice of threshold rank.
Figure 3.

Success rate versus rank for ProNet and SPE methods. Success rate is the number of correct predictions found at or above the threshold rank R in all the cross-validation trials divided by the total number of predictions above the specified rank.
Despite the success of our approach, there are several issues that might be addressed in the future to improve identification of new protein complex members. It should be noted that in our methodology for predicting protein complex membership, we assume that complex membership is transitive across edges, that is, if protein A and B are co-complexed and B and C are co-complexed, then A and C are co-complexed. This is not necessarily the case, because there can be alternative complexes in which either A or C (but not both) are bound to B. However, it is not clear how or if such information can be extracted from currently available protein interaction information, and our model did not account for potential intransitivity of complex membership.
In developing our probabilistic network model, we made the simplifying assumption that the types of evidence we used may be treated as independent. This is an oversimplification, because biases inherent in one of the Y2H methods are likely to be present in the other. A similar statement applies to the two APMS methods. In addition, we assume that a given method treats all classes of protein interactions identically; in fact, a particular method may have reporting biases, for example, against interactions involving membrane proteins. Despite these potential weaknesses, we have shown that our approach outperforms an alternative binary network-based approach. Improved models of dependence between interaction evidence types, and the use of additional evidence types (e.g., Jansen et al. 2003), should improve the performance of the network reliability approach described here.
During preparation of this manuscript, we became aware of a Markov random field (MRF) approach that predicts new members of partially known functional categories or protein complexes (Letovsky and Kasif 2003). This approach, as implemented, was unsuitable for our task because it does not accommodate multiple evidence types with varying reliability and more importantly because it requires that probability models be retrained for each query complex. A small or moderately sized complex provides few positive examples for training, and a query of one protein would provide none. However, an MRF approach with an alternative scheme for learning probability models is promising and merits further study.
In summary, we applied a network reliability approach previously applied in the field of communications theory to a probabilistic protein network model in order to predict new members of protein complexes. Furthermore, we showed that our probabilistic network approach was better than an alternative approach based on binary protein interactions.
METHODS
The probability that a given candidate protein is in the same protein complex with a known core set of proteins may be expressed (to first approximation) as the probability that there exists a path of direct and stable protein interactions between that candidate and some member of the known complex. How can we estimate this probability? This problem is analogous to one previously considered in the theory of communications networks: the two-terminal network reliability problem (Colbourn 1987). In this case, one wishes to assess the probability that some path of functioning wires connects two terminals at any given time, given a graph of connections, each weighted by the probability that the corresponding wire is functioning at any given time. Although an exact solution to the two-terminal network reliability problem has been shown to be NP-hard (Valiant 1979), reliability can be approximated using Monte Carlo simulation and other approaches (Karger 1999). Here, we apply a Monte Carlo approach to the two-terminal network reliability problem to protein interaction networks.
A prerequisite to this approach is the existence of a weighted graph model of the protein interaction network, in which nodes represent proteins and edges represent protein pairs that might stably interact. Edge weights represent the posterior probability that the two proteins interact stably and directly given available evidence. Assigning probability of interaction to protein pairs has been previously described (Edwards et al. 2002), and we follow a somewhat similar approach in constructing a probabilistic network model.
We first assembled a database of yeast protein interactions. Our interactome database consisted of the following four evidence types: (1 and 2) two high-throughput studies based on Y2H methods (Uetz et al. 2000; Ito et al. 2001); and (3 and 4) two high-throughput studies based on APMS methods (Gavin et al. 2002; Ho et al. 2002). For one of the Y2H studies (Ito et al. 2001), we used only interactions for which three or more “hits” have been observed (Ito et al. 2001); for both APMS studies, we only considered bait-to-prey interactions because these are thought to be more reliable (Bader and Hogue 2002).
The posterior probability P+ that a pair of proteins interact directly and stably (i.e., physically contact one another and are contained within the same protein complex) can be calculated according to Bayes' rule:
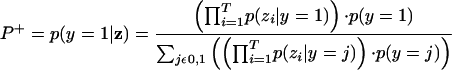 |
Here y is an indicator variable for interaction (y = 1 if the pair of proteins interacts directly and stably, and y = 0 otherwise), z is a vector of indicator variables for the presence or absence of evidence of each available type, and T is the number of evidence types. For example, z = (0,0,1,0) represents a pair of proteins for which evidence of interaction is derived only from the APMS method of Gavin et al. (2002). The equation above makes the naive Bayes assumption that different evidence types are independent of one another given the truth about stable interaction (discussed further below).
Unfortunately, there is no widely accepted and precise definition of what constitutes a stable interaction, or in fact what constitutes a protein complex. Furthermore, there exists no unbiased reference set of protein pairs for which the truth or false-hood of stable and direct interaction is known from which we might extract p(y), the prior probability of interaction, and p(zi|y), likelihoods corresponding to each evidence type i. Below, we make a reasonable estimate of p(y) and determine values for p(zi|y) that optimize performance of our algorithm according to a training set of protein complexes. No protein in the training set of complexes is used subsequently for testing purposes.
We model the prior probability that two arbitrary proteins stably interact, p(y = 1), according to p(y =1)= p(c =1,d =1) = p(d = 1) p(c = 1|d = 1), where d is an indicator variable for whether the two proteins interact directly, and c is an indicator variable for whether the two proteins are co-complexed. To calculate p(d = 1), we divide a previous estimate of the number of protein interactions in yeast (von Mering et al. 2002) by the number possible (2 × 10⁷). We calculate the probability p(c = 1|d = 1) by determining what fraction of those interactions supported by conventional studies (small-scale, non–high-throughput studies) are members of the same complex according to the MIPS complex catalog (Mewes et al. 2002). This resulted in a prior p(y = 1) probability of 7 × 10⁻³, with p(y = 0) calculated according to p(y = 0) = 1 – p(y = 1).
The likelihood p(zi|y) for each evidence type i can be written in terms of prior probability p(y = 1), evidence type-specific error rate Ei = p(y = 0|zi = 1), and the fraction of gene pairs Fi = p(zi = 1) with supporting evidence of type i as follows:
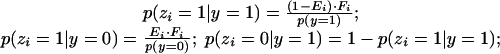 |
and p(zi = 0|y = 0) = 1 – p(zi = 1|y = 0). Each Fi value is calculated directly from a count of the number of edges supported by each evidence type, and each Ei is estimated using an optimization procedure described below at the end of the Methods section.
With estimates of p(y) and p(ziy) in hand, we can calculate P+ for each edge. To reduce subsequent computation, we set edge weights to zero for those edges with no supporting evidence of interaction. From this probabilistic network model, we sample many binary networks by using a Monte Carlo approach. Each sampled network represents a possible state of the actual network of stably interacting proteins. Sampled networks are obtained according to a Bernoulli trial on each edge, with probability of success equal to edge weight. Figure 1 illustrates a probabilistic network and two sampled binary networks. We sampled 10,000 networks for all results described here.
We count the fraction Ci of sampled binary networks in which a path exists from a candidate protein i to any protein in the core complex. The fraction Ci is our estimate of the probability that the protein i is a member of the core complex. Determining the existence of a path between two nodes in a sampled network reduces to a breadth-first search through this sparse network. To reduce computation, we restrict breadth-first searches to a maximum depth. The maximum depth is an adjustable parameter for which we used a default value of four. This was established by leaving each protein, in turn, out of a test set of 12 complexes and finding that in all cases a depth of four was sufficient to find a path back from the given protein to its parent complex, if such a path existed at all in the network. A user-defined core set of proteins is given as input, and a list of candidate proteins ranked by Ci is returned as output. Candidate proteins above a user-defined rank threshold R are displayed graphically along with all edges with nonzero weight. An example of a query with members of the SAGA complex is shown in Figure 2.
We used an optimization procedure to estimate the error rate vector E used above. Although estimates of error rate for some of these evidence types are available (Mrowka et al. 2001; Deane et al. 2002; Edwards et al. 2002; von Mering et al. 2002; Deng et al. 2003; Sprinzak et al. 2003), the error rates of each evidence type in predicting direct and stable interaction have not previously been estimated. We therefore sought to find an estimate for the E vector that optimized performance of our algorithm, searching the space of possible values using a steepest ascent method. As an objective function for optimization, we used area under the success rate versus rank curves. Success rate versus rank curves are calculated by using a cross-validation procedure in which each protein in a set of complexes is left out in turn, a ranked list of candidate proteins is obtained, and the success rate for candidate proteins ranked at or below R is assessed (examples in Fig. 3).
To optimize our choice of error rate vector entries, we used a training set of seven protein complexes. These were chosen at random from among complexes listed in MIPS, subject to constraints that no protein appear in more than one complex and that each complex must contain at least six proteins. The following Ei values were obtained: 0.893 for Ito-core Y2H (Ito et al. 2001), 0.998 for Y2H from Uetz et al. (2000), 0.957 for APMS data from Gavin et al. (2002), and 0.996 for APMS data from Ho et al. (2002).
A validation set of 27 complexes was chosen by using the same selection constraints used to choose the training set of complexes. There was no overlap between proteins in training and validation sets. Complete lists of the proteins in complexes used for testing and training are available in the Supplemental material.
Acknowledgments
We are indebted to W.T. Wickner and E.S. Seeley for early discussions that motivated this work. We thank L.V. Zhang and G.F. Berriz for advice and assistance. This research was supported in part by an institutional grant from the Howard Hughes Medical Institute Biomedical Research Support Program for Medical Schools. O.D.K was supported by an individual NRSA Fellowship from National Institutes of Health/NHGRI.
The publication costs of this article were defrayed in part by payment of page charges. This article must therefore be hereby marked “advertisement” in accordance with 18 USC section 1734 solely to indicate this fact.
Article and publication are at http://www.genome.org/cgi/doi/10.1101/gr.2203804. Article published online before print in May 2004.
NOTE ADDED IN PROOF
After submission of our manuscript, another work was published with the same goal of predicting membership in partially known protein complexes (Bader, J.S. 2003. Greedily building protein networks with confidence. Bioinformatics. 19: 1869–1874). One important difference is that the work by Bader ranks protein candidates according to the probability of their connection to the core complex via the single most probable path, while the ProNet method ranks according to the probability of connection via any path.
Footnotes
[Supplemental material is available online at www.genome.org. Software called Complexpander, which predicts new members of partially known protein complexes, is available at the authors' Web site http://llama.med.harvard.edu/Software.html.]
References
- Bader, G.D. and Hogue, C.W. 2002. Analyzing yeast protein–protein interaction data obtained from different sources. Nat. Biotechnol. 20: 991–997. [DOI] [PubMed] [Google Scholar]
- Bader, G.D. and Hogue, C.W.. 2003. An automated method for finding molecular complexes in large protein interaction networks. BMC Bioinformatics 4: 2. [DOI] [PMC free article] [PubMed] [Google Scholar]
- Bader, G.D., Betel, D., and Hogue, C.W. 2003. BIND: The Biomolecular Interaction Network Database. Nucleic Acids Res. 31: 248–250. [DOI] [PMC free article] [PubMed] [Google Scholar]
- Ball, M.O. 1986. Computational complexity of network reliability analysis: An overview. IEEE Transactions on Reliability 230–239.
- Batagelj, V. and Mrvar, A. 1998. Pajek: Program for large network analysis. Connections 21: 47–57. [Google Scholar]
- Bellaoui, M., Chang, M., Ou, J., Xu, H., Boone, C., and Brown, G.W. 2003. Elg1 forms an alternative RFC complex important for DNA replication and genome integrity. EMBO J. 22: 4304–4313. [DOI] [PMC free article] [PubMed] [Google Scholar]
- Bu, D., Zhao, Y., Cai, L., Xue, H., Zhu, X., Lu, H., Zhang, J., Sun, S., Ling, L., Zhang, N., et al. 2003. Topological structure analysis of the protein–protein interaction network in budding yeast. Nucleic Acids Res. 31: 2443–2450. [DOI] [PMC free article] [PubMed] [Google Scholar]
- Colbourn, C.J. 1987. The combinatorics of network reliability. Oxford University Press, New York.
- Collart, M.A. and Struhl, K. 1994. NOT1(CDC39), NOT2(CDC36), NOT3, and NOT4 encode a global-negative regulator of transcription that differentially affects TATA-element utilization. Genes & Dev. 8: 525–537. [DOI] [PubMed] [Google Scholar]
- Cullmann, G., Fien, K., Kobayashi, R., and Stillman, B. 1995. Characterization of the five replication factor C genes of Saccharomyces cerevisiae. Mol. Cell. Biol. 15: 4661–4671. [DOI] [PMC free article] [PubMed] [Google Scholar]
- Deane, C.M., Salwinski, L., Xenarios, I., and Eisenberg, D. 2002. Protein interactions: Two methods for assessment of the reliability of high throughput observations. Mol. Cell. Proteomics 1: 349–356. [DOI] [PubMed] [Google Scholar]
- Deng, M., Sun, F., and Chen, T. 2003. Assessment of the reliability of protein–protein interactions and protein function prediction. Pac. Symp. Biocomput. 140–151. [PubMed]
- Edwards, A.M., Kus, B., Jansen, R., Greenbaum, D., Greenblatt, J., and Gerstein, M. 2002. Bridging structural biology and genomics: Assessing protein interaction data with known complexes. Trends Genet. 18: 529–536. [DOI] [PubMed] [Google Scholar]
- Gavin, A.C., Bosche, M., Krause, R., Grandi, P., Marzioch, M., Bauer, A., Schultz, J., Rick, J.M., Michon, A.M., Cruciat, C.M., et al. 2002. Functional organization of the yeast proteome by systematic analysis of protein complexes. Nature 415: 141–147. [DOI] [PubMed] [Google Scholar]
- Grant, P.A., Schieltz, D., Pray-Grant, M.G., Steger, D.J., Reese, J.C., Yates III, J.R., and Workman, J.L. 1998. A subset of TAF(II)s are integral components of the SAGA complex required for nucleosome acetylation and transcriptional stimulation. Cell 94: 45–53. [DOI] [PubMed] [Google Scholar]
- Hanna, J.S., Kroll, E.S., Lundblad, V., and Spencer, F.A. 2001. Saccharomyces cerevisiae CTF18 and CTF4 are required for sister chromatid cohesion. Mol. Cell. Biol. 21: 3144–3158. [DOI] [PMC free article] [PubMed] [Google Scholar]
- Ho, Y., Gruhler, A., Heilbut, A., Bader, G.D., Moore, L., Adams, S.L., Millar, A., Taylor, P., Bennett, K., Boutilier, K., et al. 2002. Systematic identification of protein complexes in Saccharomyces cerevisiae by mass spectrometry. Nature 415: 180–183. [DOI] [PubMed] [Google Scholar]
- Hodges, P.E., McKee, A.H., Davis, B.P., Payne, W.E., and Garrels, J.I. 1999. The Yeast Proteome Database (YPD): A model for the organization and presentation of genome-wide functional data. Nucleic Acids Res. 27: 69–73. [DOI] [PMC free article] [PubMed] [Google Scholar]
- Ito, T., Chiba, T., Ozawa, R., Yoshida, M., Hattori, M., and Sakaki, Y. 2001. A comprehensive two-hybrid analysis to explore the yeast protein interactome. Proc. Natl. Acad. Sci. 98: 4569–4574. [DOI] [PMC free article] [PubMed] [Google Scholar]
- Jansen, R., Lan, N., Qian, J., and Gerstein, M. 2002. Integration of genomic datasets to predict protein complexes in yeast. J. Struct. Functional Genomics 2: 71–81. [DOI] [PubMed] [Google Scholar]
- Jansen, R., Yu, H., Greenbaum, D., Kluger, Y., Krogan, N.J., Chung, S., Emili, A., Snyder, M., Greenblatt, J.F., and Gerstein, M. 2003. A Bayesian networks approach for predicting protein–protein interactions from genomic data. Science 302: 449–453. [DOI] [PubMed] [Google Scholar]
- Karger, D.R. 1999. A randomized fully polynomial time approximation scheme for the all-terminal network reliability problem. SIAM J. Comput. 29: 492–514. [Google Scholar]
- Letovsky, S. and Kasif, S. 2003. Predicting protein function from protein/protein interaction data: A probabilistic approach. Bioinformatics 19 Suppl 1: I197–I204. [DOI] [PubMed] [Google Scholar]
- Majka, J. and Burgers, P.M. 2003. Yeast Rad17/Mec3/Ddc1: A sliding clamp for the DNA damage checkpoint. Proc. Natl. Acad. Sci. 100: 2249–2254. [DOI] [PMC free article] [PubMed] [Google Scholar]
- Marcotte, E.M., Pellegrini, M.,Thompson, M.J., Yeates, T.O., and Eisenberg, D. 1999. A combined algorithm for genome-wide prediction of protein function. Nature 402: 83–86. [DOI] [PubMed] [Google Scholar]
- Mewes, H.W., Frishman, D., Guldener, U., Mannhaupt, G., Mayer, K., Mokrejs, M., Morgenstern, B., Munsterkotter, M., Rudd, S., and Weil, B. 2002. MIPS: A database for genomes and protein sequences. Nucleic Acids Res. 30: 31–34. [DOI] [PMC free article] [PubMed] [Google Scholar]
- Mrowka, R., Patzak, A., and Herzel, H. 2001. Is there a bias in proteome research? Genome Res. 11: 1971–1973. [DOI] [PubMed] [Google Scholar]
- Oberholzer, U. and Collart, M.A. 1998. Characterization of NOT5 that encodes a new component of the Not protein complex. Gene 207: 61–69. [DOI] [PubMed] [Google Scholar]
- Rives, A.W. and Galitski, T. 2003. Modular organization of cellular networks. Proc. Natl. Acad. Sci. 100: 1128–1133. [DOI] [PMC free article] [PubMed] [Google Scholar]
- Sanders, S.L., Jennings, J., Canutescu, A., Link, A.J., and Weil, P.A. 2002. Proteomics of the eukaryotic transcription machinery: Identification of proteins associated with components of yeast TFIID by multidimensional mass spectrometry. Mol. Cell. Biol. 22: 4723–4738. [DOI] [PMC free article] [PubMed] [Google Scholar]
- Schwikowski, B., Uetz, P., and Fields, S. 2000. A network of protein–protein interactions in yeast. Nat. Biotechnol. 18: 1257–1261. [DOI] [PubMed] [Google Scholar]
- Spirin, V. and Mirny, L.A. 2003. Protein complexes and functional modules in molecular networks. Proc. Natl. Acad. Sci. 100: 12123–12128. [DOI] [PMC free article] [PubMed] [Google Scholar]
- Sprinzak, E., Sattath, S., and Margalit, H. 2003. How reliable are experimental protein–protein interaction data? J. Mol. Biol. 327: 919–923. [DOI] [PubMed] [Google Scholar]
- Tucker, M., Staples, R.R., Valencia-Sanchez, M.A., Muhlrad, D., and Parker, R. 2002. Ccr4p is the catalytic subunit of a Ccr4p/Pop2p/Notp mRNA deadenylase complex in Saccharomyces cerevisiae. EMBO J. 21: 1427–1436. [DOI] [PMC free article] [PubMed] [Google Scholar]
- Uetz, P., Giot, L., Cagney, G., Mansfield, T.A., Judson, R.S., Knight, J.R., Lockshon, D., Narayan, V., Srinivasan, M., Pochart, P., et al. 2000. A comprehensive analysis of protein–protein interactions in Saccharomyces cerevisiae. Nature 403: 623–627. [DOI] [PubMed] [Google Scholar]
- Valiant, L.G. 1979. The complexity of enumeration and reliability problems. SIAM J. Comput. 8: 410–421. [Google Scholar]
- von Mering, C., Krause, R., Snel, B., Cornell, M., Oliver, S.G., Fields, S., and Bork, P. 2002. Comparative assessment of large-scale data sets of protein–protein interactions. Nature 417: 399–403. [DOI] [PubMed] [Google Scholar]
- Winter, D.C., Choe, E.Y., and Li, R. 1999. Genetic dissection of the budding yeast Arp2/3 complex: A comparison of the in vivo and structural roles of individual subunits. Proc. Natl. Acad. Sci. 96: 7288–7293. [DOI] [PMC free article] [PubMed] [Google Scholar]
- Xenarios, I., Salwinski, L., Duan, X.J., Higney, P., Kim, S.M., and Eisenberg, D. 2002. DIP, the Database of Interacting Proteins: A research tool for studying cellular networks of protein interactions. Nucleic Acids Res. 30: 303–305. [DOI] [PMC free article] [PubMed] [Google Scholar]
- Zhang, G., Gibbs, E., Kelman, Z., O'Donnell, M., and Hurwitz, J. 1999. Studies on the interactions between human replication factor C and human proliferating cell nuclear antigen. Proc. Natl. Acad. Sci. 96: 1869–1874. [DOI] [PMC free article] [PubMed] [Google Scholar]