

Tissues may adopt diverse strategies to establish specific transcriptional programs in daughter lineages. In blood, it is unclear when chromatin becomes permissive for transcription of genes expressed in distinct lineages. Luyten et al. present genome-wide analyses on chromatin dynamics and transcription factor binding at successive stages in primary mouse blood cell differentiation. The results reveal surprising features of enhancer delineation in a self-renewing tissue, distinct from the strategy applied in self-renewing intestinal crypts. This study provides a useful foundation to consider classical observations on cellular reprogramming and lineage plasticity in hematopoiesis.
Keywords: tissue differentiation, hematopoiesis, chromatin dynamics, nucleosome dynamics, tissue-selective enhancers
Abstract
Tissues may adopt diverse strategies to establish specific transcriptional programs in daughter lineages. In intestinal crypts, enhancers for genes expressed in both major cell types appear broadly permissive in stem and specified progenitor cells. In blood, another self-renewing tissue, it is unclear when chromatin becomes permissive for transcription of genes expressed in distinct terminal lineages. Using chromatin immunoprecipitation (ChIP) combined with deep sequencing (ChIP-seq) to profile activating histone marks, we studied enhancer dynamics in primary mouse blood stem, progenitor, and specified cells. Stem and multipotent progenitor cells show scant H3K4me2 marking at enhancers bound by specific transcription factors in their committed progeny. Rather, enhancers are modulated dynamically and serially, with substantial loss and gain of H3K4me2, at each cellular transition. Quantitative analysis of these dynamics accurately modeled hematopoiesis according to Waddington’s notion of epigenotypes. Delineation of enhancers in terminal blood lineages coincides with cell specification, and enhancers active in single lineages show well-positioned H3K4me2- and H3K27ac-marked nucleosomes and DNaseI hypersensitivity in other cell types, revealing limited lineage fidelity. These findings demonstrate that enhancer chronology in blood cells differs markedly from that in intestinal crypts. Chromatin dynamics in hematopoiesis provide a useful foundation to consider classical observations such as cellular reprogramming and multilineage locus priming.
A distinctive, stable transcriptional program defines the identity of each cell type. These programs are activated when cell-restricted transcription factors (TFs) acquire access to specific cis-elements (Felsenfeld and Groudine 2003; Davidson 2006), but it is unclear when in ontogeny diverse tissues modify chromatin to activate those cis-elements. Current understanding rests largely on studies in differentiating embryonic stem cells (ESCs) or reprogrammed adult stem cells (Mikkelsen et al. 2007; Koche et al. 2011; Paige et al. 2012; Wamstad et al. 2012) and few primary tissues (Cui et al. 2009; Heinz et al. 2010; Garber et al. 2012; Samstein et al. 2012; Shen et al. 2012; Xu et al. 2012; Zhang et al. 2012; Zhu et al. 2013). Such studies reveal, for example, that promoters of tissue-restricted genes carry both H3K4me3 and H3K27me3 in undifferentiated ESCs and lose the latter, repressive mark at certain genes when the cells differentiate (Bernstein et al. 2006). Lineage-specific gene activity in vivo requires cis-elements that lie far from transcription start sites (TSSs) (Heintzman et al. 2007) and show dynamic changes in nuclease sensitivity (Stergachis et al. 2013), histone modification (Shen et al. 2012; Zhu et al. 2013), and TF binding. Cell differentiation reflects selective TF access to these distal enhancers.
In current models, chromatin at lineage-specific genes allows little, if any, transcription in stem or progenitor cells, and distinct groups of enhancers become active as cells differentiate (Xie and Ren 2013). Cell-restricted TFs activate enhancers de novo in some situations (Heinz et al. 2010), but tissues might apply diverse strategies to prepare chromatin for alternative transcriptional programs in specialized cells. For example, chromatin in intestinal crypt progenitors is broadly primed to accommodate each nascent possibility: Enhancers for genes that express selectively in different intestinal lineages show features of activation—H3K4me2 and H3K27ac histone marks and DNaseI hypersensitivity (DHS)—in progenitors for each cell type as well as in intestinal stem cells (Kim et al. 2014). Thus, lineage-determining TFs bind enhancers that were rendered accessible in a previous cell generation (Kim et al. 2014). Intestinal crypt cells differentiate by lateral inhibition, whereas other self-renewing tissues, such as blood, diversify by other means. It is unknown whether hematopoiesis uses the same strategy as intestinal crypt cells to activate lineage-restricted genes.
Certain known cellular and molecular features may predict chromatin states in blood cells. First, multipotent progenitors express trace levels of transcripts that become abundant in single mature blood lineages (Hu et al. 1997; Laslo et al. 2006). Such multilineage priming hints that chromatin in primitive cells may be earmarked well ahead of robust gene expression. Long-term cultures of Id2-overexpressing lymphoid progenitors support this idea (Mercer et al. 2011), but early marks have not been studied in bona fide primary cells. Second, forced expression of single TFs can reprogram myeloblasts into erythroid cells and lymphocytes into macrophages or mast cells (Kulessa et al. 1995; Heyworth et al. 2002; Xie et al. 2004; Taghon et al. 2007). This instructive activity of certain TFs implies that they either render chromatin permissive at new loci or encounter chromatin that was previously primed. Third, lineage-restricted TFs such as GATA1 and NF-E2 drive transcriptional programs in megakaryocytes (MKs) and erythroid cells (Shivdasani et al. 1995, 1997), whereas granulocytes derive from a distinct progenitor and express PU.1 (also known as SPI1) and CEBP but not GATA1 or NF-E2 (Hromas et al. 1993). Through reciprocal antagonism, PU.1 and GATA1 control first myeloid versus lymphoid and then granulocyte versus erythroid differentiation (Rekhtman et al. 1999; Arinobu et al. 2007). Although hematopoiesis represents the outcome of these and other lineage-restricted TFs’ interactions with chromatin, the initial, intermediate, and terminal chromatin states in primary blood cells are not known.
We assessed enhancer chromatin in purified primary mouse blood cells of defined potential and lineage. This genome-wide analysis in successive blood progenitors yielded a quantitative profile of enhancer transitions that model Waddington’s classic epigenetic landscape (Waddington 1957). In hematopoietic stem cells (HSCs) and multipotent progenitors, levels of the histone activation mark H3K4me2 at thousands of blood gene enhancers barely exceeded background levels. The same regions showed robust histone activation, with strong nucleosome positioning and DHS, coincident with lineage specification. Although enhancers appeared fully delineated only after cell lineages had ostensibly diverged, this occurred with surprisingly limited lineage fidelity: TF-binding enhancers in erythroid cells, MKs, and granulocytes were reciprocally marked in other specified lineages. Our findings in primary blood cells provide fresh insights into the chronology, fidelity, and functions of TF binding and chromatin modifications that underlie hematopoiesis in vivo.
Results
H3K4me2-marked enhancers globally reflect gene activity and cell differentiation in hematopoiesis
Erythrocytes and MKs arise from a MK–erythroid progenitor (MEP), whereas granulocytes arise from distinct granulocyte–macrophage progenitors (GMPs) (Fig. 1A). Each of these progenitors in turn arises from an HSC derivative, the common myeloid progenitor (CMP). To study chromatin dynamics in hematopoiesis, we cultured mouse fetal liver cells in the presence of lineage-expanding growth factors and collected immature erythrocytes, granulocytes, and MKs after 2 d of lineage-specific culture. Following immunodepletion of other lineages to enrich each population to at least 95% purity, cell morphologies (Fig. 1A) and surface markers indicated lineage specification, and mRNA profiles confirmed lineage-restricted gene expression (Supplemental Fig. S1A–D). To obtain mature cells of each lineage, we extended the cultures for two (granulocytes) or three (erythrocytes and MKs) additional days (Supplemental Fig. S1A). We also used other growth factors to expand, and flow cytometry to isolate, progenitors and Lin−Sca1hiKithi (LSK) cells representing HSCs (Supplemental Fig. S1E).
Figure 1.

H3K4me2-marked chromatin sites identify enhancers in mouse blood cells. (A) Conventional hierarchy of HSC differentiation into CMPs, then MEPs or GMPs, and finally erythroid cells, MKs, and granulocytes. Cells were expanded using the indicated growth factors: stem cell factor (SCF), erythropoietin (EPO), thrombopoietin (TPO), and granulocyte colony-stimulating factor (G-CSF). TFs expressed selectively in the cell types are listed. (B) H3K4me2 enrichment in promoters (left; <2 kb from TSSs) or enhancers (right; ±2 to 20 kb from TSSs) of 692 genes activated during terminal MK maturation. Normalized ChIP-seq tag densities (reads per kilobase per million sequence tags [RPKM]) at each promoter or MACS-identified nonpromoter peak are plotted for immature (X-axis) and mature (Y-axis) MKs. Between the two stages, H3K4me2 marks show little variance at promoters but differ markedly at enhancers (zones of concordant marking are demarcated by dotted lines). (C) Correlation of average H3K4me2 signal strength at enhancers (Y-axis, normalized tag density in RPKM) with transcript levels (X-axis, average levels of 100-gene bins ranked by an expression index) in purified erythroid cells (ERY), MKs, and granulocytes (GRAN).
Active genes carry H3K4me2 and H3K4me3 histone marks at their promoters and H3K4me2 and H3K4me1 at distal enhancers (Barski et al. 2007; Wang et al. 2008; Heintzman et al. 2009; He et al. 2010; Verzi et al. 2010; The ENCODE Project Consortium 2012); thus, H3K4me2 is enriched at active promoters as well as enhancers (Barski et al. 2007; Wang et al. 2008; Heintzman et al. 2009; He et al. 2010; Verzi et al. 2010; The ENCODE Project Consortium 2012). Chromatin immunoprecipitation (ChIP) combined with deep sequencing (ChIP-seq) for this mark on micrococcal nuclease (MNase)-digested chromatin isolated from erythrocytes, MKs, and granulocytes identified well-positioned, marked nucleosomes at thousands of sites (Supplemental Fig. S2A,B). Among genes activated in mature MKs, for example, regions located >2 kb from TSSs showed far greater differences from immature MKs than did the corresponding promoters (<2 kb from TSSs) (Fig. 1B, signals represented outside the dashed lines). Moreover, enhancer H3K4me2 levels in each specified cell type were highly correlated with expression of nearby genes (Fig. 1C), confirming previous observations that lineage-restricted genes are regulated mainly through distal enhancers (Heintzman et al. 2007; Boyle et al. 2008). The placement of H3K4me2 at active, regulated blood cell enhancers may therefore be a key objective in cell differentiation, and we reasoned that the chronology of its appearance and resolution would shed light on the chromatin basis of hematopoiesis.
Chromatin dynamics enable delineation of blood cell epigenotypes
Some progenitor populations yielded few cells, and resolution of single nucleosomes was not essential to investigate enhancer dynamics. We therefore used sonicated chromatin for ChIP-seq analysis of HSCs and progenitor cells (Supplemental Fig. S2A,B), and, as expected, signal detection and integrity were similar to ChIP on MNase-digested chromatin (Supplemental Fig. S3A). Normalized H3K4me2 tag counts at all enhancers across all of the blood cell populations indicated that enhancers are modulated in a step-wise fashion during hematopoiesis, with similar profiles among the following groups: HSCs, CMPs, and MEPs; erythrocytes, young MKs and their common MEPs; and immature and mature granulocytes (Fig. 2A). Moreover, enhancers in immature granulocytes and erythrocytes showed the greatest divergence from other cells, indicating that the most significant global changes are concomitant with lineage specification.
Figure 2.
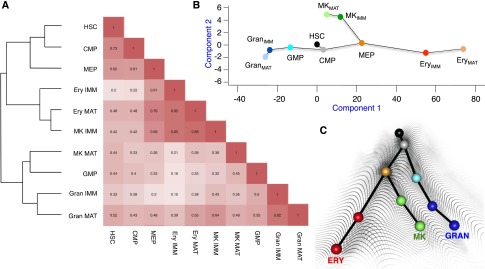
Enhancer H3K4me2 epigenotypes in hematopoiesis. (A) Correlation and hierarchical clustering of enhancer H3K4me2 peaks (±2 to 20 kb from TSSs) from all cell types examined in this study. A heat map depicts Pearson correlations between every pair of H3K4me2 profiles. (B) Quantitative map of successive changes in enhancer H3K4me2. Each dot represents a cell type, with HSCs at the origin (0, 0). Lines indicate the distances and directions of divergence between consecutive cells in the conventional hierarchy, as determined by multiple linear regression and multidimensional scaling. The response variable was differential gene expression in specified erythroid cells, MKs, and granulocytes; dynamic H3K4me2 changes at all enhancers were the regressors. (C) The derived quantitative map was rendered in three dimensions, and a sample rendition using dots of the same colors as in B is projected on a background representing Waddington’s classic epigenetic landscape (Waddington 1957).
Data on chromatin modifications and DHS in differentiating ESCs and other experimental models (Stergachis et al. 2013; Zhu et al. 2013) support Waddington’s original concept that cell differentiation reflects the sequential determination of “epigenotypes” (Waddington 1942, 1957). However, no quantitative analysis of cis-regulatory elements has previously considered a full series of differentiating primary cells. Genome-wide mapping of H3K4me2 allowed us to quantify the relationships among blood cells as a function of this canonical activation mark. We investigated how modulation of H3K4me2 at enhancers relates to step-wise differentiation of HSCs and progenitor cells toward their final destinies: erythroid cells, MKs, or granulocytes. Accounting for the known cellular hierarchy (Fig. 1A), we analyzed dynamic changes in H3K4me2 density at enhancers (2–20 kb on both sides of TSSs) for every gene and each pair of consecutive steps in hematopoiesis. To impute each step’s contribution toward cellular diversity, we applied multiple linear regressions using differential expression in specified erythroid cells, MKs, and granulocytes as the final response variable (see details in the Materials and Methods).
In the resulting quantitative map of enhancer modulation (Fig. 2B; Supplemental Fig. S3B), the direction and length of each line connecting two cell types represent the changes in H3K4me2 projected to lineage-specific gene expression. The overall transition from HSCs to CMPs is modest and does not overtly anticipate any subsequent branch or lineage, while differentiation of CMPs into MEPs or GMPs is accompanied by larger changes in enhancer chromatin in different directions. Every subsequent transition of enhancer chromatin also occurs specifically toward the target cell type; i.e., from GMPs to granulocytes and from MEPs to erythroid cells or MKs, again in different directions. The largest changes at enhancers occur when CMPs transition to MEPs or GMPs and when these bipotential progenitors produce cells with singular identities. Enhancers are comparatively stable during terminal cell maturation, indicating that cell-specific regulatory elements are largely established by the time blood cells are specified. Figure 2C projects the results of this empiric analysis onto Waddington’s classic landscape (Waddington 1957), accurately representing hematopoiesis with respect to modulation of H3K4me2 at enhancers. Delineation of lineage-specific enhancers is a central objective in cell differentiation, and our data allowed us next to determine the detailed chronology of enhancer marking in hematopoiesis.
Enhancers for specified blood cells are delineated concomitant with lineage divergence in ontogeny
In the self-renewing intestinal epithelium, many enhancers for both major intestinal lineages, absorptive and secretory, show signs of activation in undifferentiated stem cells and both classes of progenitors (Kim et al. 2014). Multilineage priming in blood progenitors (Hu et al. 1997; Laslo et al. 2006) suggests that enhancers may also be primed early in hematopoiesis, but our global analysis indicated that blood cell enhancers are significantly modulated at each point of lineage divergence (Fig. 2). To investigate H3K4me2 chronology at genes expressed in specified cells, we focused first on genes highly restricted to erythroid cells and granulocytes, which diverge earlier in ontogeny than erythroid cells and MKs (Fig. 1A). We clustered all regions within 20 kb (excluding ±2 kb from TSSs) of these lineage-specific genes according to their H3K4me2 signal in different cell populations (Fig. 3A,B). The largest clusters showed the highest H3K4me2 signals in specified erythroid cells or granulocytes, signifying lineage activity, and the diverse profiles at enhancers contrasted with the largely fixed marking at promoters, as expected (Supplemental Fig. S4A). In strongly marked areas near granulocyte-expressed genes (clusters 3 and 4 in Fig. 3A), weak H3K4me2 marks were apparent in GMPs, but the signals in HSCs, CMPs, and MEPs were similar to the background in heterologous (intestinal) cells. Similarly, areas strongly marked near erythroid-expressed genes in erythroid cells (clusters 3 and 4 in Fig. 3B) showed weak signals in MEPs and barely any H3K4me2 in HSCs, CMPs, or GMPs. The signals in progenitor cells were not trivially low as a result of inefficient ChIP, as thousands of other regions were strongly marked (clusters 1 in Fig. 3A,B; Supplemental Fig. S3A), and representative lineage-specific loci illustrate the lack of enhancer marking in distant progenitors, with weak marking in immediate progenitors for each cell type (Supplemental Fig. S4B,C). Thus, genes expressed almost exclusively in terminal blood cell types only acquire significant enhancer H3K4me2 concomitant with lineage specification.
Figure 3.

Limited priming of blood lineage enhancers in progenitor cells. (A,B) K-means clustering of 975 H3K4me2-marked enhancer regions near the 200 most erythroid-specific genes (A) and 703 regions near the 163 most granulocyte-specific genes (B) in multipotent HSCs and each progenitor. Clusters 1–4 identify distinct patterns among the represented cell populations. (C) Immunoblots for PU.1 and NF-E2 confirm lineage-specific expression. (D) Negligible overlap of PU.1-binding sites in granulocytes and NF-E2-binding sites in erythroid cells, indicating distinct enhancers in the two lineages. (E) TF binding at these enhancers is associated with cell type-specific gene expression. Groups of 200 genes, ranked by differential expression in granulocytes or erythroid cells, are arranged along the X-axis, and ChIP-seq data for PU.1 (blue) and NF-E2 (red) binding at enhancers near genes within each bin are represented on the Y-axis, normalized with respect to the genome-wide background set at 1. (F) Heat maps of H3K4me2 ChIP-seq (−500 to +500 bp from the TF-binding summit) showing strong correspondence of positioned, marked nucleosomes in specified blood cells but weak marking of those regions in progenitors.
Many additional genes are differentially regulated through enhancers that bind lineage-restricted TFs. We therefore used ChIP-seq to map binding sites for PU.1, which is expressed in granulocytes but not in erythroid cells or MKs, and for NF-E2, which is restricted to erythroid cells and MKs (Fig. 3C). NF-E2 occupied nearly 2000 sites in immature erythroid cells, mostly far from promoters, and PU.1 bound many more regions in granulocytes (Supplemental Fig. S2A,C). Nearly 80% of the 10,000 strongest PU.1-binding sites matched those reported to bind PU.1 in other leukocytes (Lefterova et al. 2010), and we considered this overlap to represent a robust sampling of PU.1 occupancy. Importantly, PU.1 occupancy in granulocytes and NF-E2 occupancy in erythroid cells occurred at distinct enhancers (Fig. 3D), and each group of binding sites was associated with transcripts expressed selectively in that cell type (Fig. 3E). In further support of their enhancer function, these binding sites coincided with nucleosome-depleted regions flanked by two or four strongly positioned H3K4me2-marked nucleosomes, and the strength of TF binding was proportional to that of H3K4me2 marks (Fig. 3F). Even at this large number of bona fide blood cell enhancers, H3K4me2 marking in multipotent or bipotential progenitors was considerably weaker than in specified blood cells and apparent mainly in the most immediate progenitor (Fig. 3F).
The broad dearth of H3K4me2 marking in progenitors indicates that enhancers in specified blood cells acquire this canonical feature of activation as or soon after lineages diverge in ontogeny. This chronology contrasts with that in the intestinal epithelium, where thousands of late-acting enhancers carry strong activation marks, including H3K4me2, in both secretory and enterocyte progenitors as well as in intestinal stem cells (Kim et al. 2014). Thus, different self-renewing tissues use fundamentally different chromatin strategies to achieve cell diversity.
Limited fidelity of enhancer delineation in committed blood cells
The late establishment of blood cell enhancers implies that they are delineated specifically in the cell type where they are required for lineage-specific gene activity. To test whether enhancers that bind lineage-restricted TFs are indeed delineated only in certain cells, we examined H3K4me2-enriched nucleosomes in each specified cell type near NF-E2- and PU.1-binding sites. Surprisingly, the chromatin at most NF-E2-binding sites in erythroid cells also carried H3K4me2 on well-positioned nucleosomes in cells that express little (immature MKs) or no (granulocytes) NF-E2 (Fig. 4A,B, top). This included enhancers near genes responsible for globin, porphyrin, and heme synthesis, which are expressed exclusively in erythroid cells (e.g., Supplemental Fig. S5A). Similarly, sites bound to PU.1 in granulocytes showed stably positioned H3K4me2-marked nucleosomes in not only these cells but also erythroid cells (Fig. 4A,B, bottom). To assess the extent of this lineage infidelity, we examined chromatin near sites of GATA1 binding in mouse erythroleukemia (MEL) cells (Yu et al. 2009), which hardly overlap with NF-E2-binding sites in fetal liver-derived primary erythroid cells (Supplemental Fig. S5B). Enhancers that bind GATA1 in MEL cells carried well-positioned H3K4me2-marked nucleosomes in immature erythroid cells and MKs, where GATA1 is expressed and active, as well as weak H3K4me2 marks in granulocytes, which lack GATA1 (Supplemental Fig. S5C).
Figure 4.

Stably positioned nucleosomes bearing active histone marks flank TF-binding sites in index and sibling lineages. (A) Heat maps demonstrating well-positioned, H3K4me2-marked nucleosomes around enhancers that NF-E2 occupies in erythroid cells (top) and that PU.1 occupies in granulocytes (bottom), exactly as shown in Figure 5D. TF-binding sites located away from promoters (>2 kb from TSSs) or exons are arranged according to H3K4me2 signal strength at nucleosomes flanking TF-bound sites in each cell type. Histone marks are present in the reference lineage as well as in the other cell type, where the TF is absent. Heat maps at the right represent H3K27ac ChIP-seq data at the same enhancers. All heat maps represent regions from −500 to +500 bp from the summit of TF binding. (B) Composite profiles of normalized H3K4me2 tag densities in erythroid cells (ERY; red), MKs (green), and granulocytes (GRAN; blue) near the 1000 strongest H3K4me2-marked erythroid NF-E2-binding (top) and granulocyte PU.1-binding (bottom) sites. (C) H3K27ac and H3K4me2 enrichment at enhancers near expressed genes. Each dot in the scatter plots represents normalized H3K27ac (left) or H3K4me2 (right) signals in specified erythroid cells (Y-axis) and granulocytes (X-axis) at each enhancer (≥2 kb from any TSS). Sites near genes expressed selectively in erythroid cells or granulocytes are colored red and blue, respectively. Both histone marks are enriched in both lineages near genes expressed in either cell type, and neither mark is better associated with expression than the other. (D) Composite profiles of DHS in immature granulocytes at the same sets of 1000 TF-binding sites as in B. Filled and dashed lines represent the negative (−) and positive (+) strands of DNase-seq reads, respectively. Sites bound by TFs restricted to one lineage are thus hypersensitive to nuclease digestion in siblings that diverged early in hematopoiesis.
Thus, activation-associated modifications and positioned nucleosomes mark enhancers not only when an index TF and its target genes are highly expressed but also in other specified blood cells. Clear H3K4me2 signals, coupled with the purity of our cell preparations, argue against their origin in contaminant cells. The same regions rarely carried H3K4me2 in thymocytes or intestinal cells (Supplemental Fig. S5D,E). Moreover, enhancers in mature cells were marked as strongly as in their immature counterparts (Supplemental Fig. S6), and the probability of equal trace contamination from sibling lineages in these independent cell isolates is extremely low after prolonged culture in lineage-specific growth factors.
Genes “poised” in ESCs may carry both activation-associated H3K4me3 and repressive H3K27me3 marks, and replacement of the latter with H3K27ac distinguishes poised from active cis-elements (Mikkelsen et al. 2007; Creyghton et al. 2010; Rada-Iglesias et al. 2010; Wamstad et al. 2012). We performed additional ChIP-seq to test whether H3K27ac might similarly distinguish true enhancer function in a particular lineage even though the H3K4me2 mark is present at many additional sites. Illustrative enhancers for erythroid-specific Ube2o and granulocyte-specific Mpo demonstrate H3K27ac and H3K4me2 marking in both lineages (Supplemental Fig. S7A). More importantly, both marks unambiguously flanked hundreds of NF-E2- and PU.1-binding sites in erythroid cells and granulocytes, respectively, in both purified sibling lineages (Fig. 4A). H3K27ac was present on strongly positioned nucleosomes, indicating well-delineated enhancers, and sibling cells often carried more than two marked, positioned nucleosomes. In general, H3K4me2 and H3K27ac marks were stronger in cells where a TF is expressed and bound (Fig. 4A, B) and where neighboring genes are expressed, but many enhancers near genes expressed in only one cell type were similarly marked in the other (Fig. 4C). Heterologous sites were not marked uniformly in sibling lineages, which further excludes contaminant cells as their source. Thus, two independent histone activation marks breach lineage fidelity to a comparable degree.
Beyond harboring well-positioned nucleosomes that bear particular histone marks, enhancers show heightened sensitivity to endonuclease digestion (Felsenfeld and Groudine 2003). To verify that enhancers are indeed well delineated in sibling lineages that lack key TFs, we mapped DHS sites (Boyle et al. 2008; Thurman et al. 2012) in immature granulocytes. DHS sites were enriched at PU.1-bound enhancers, as expected (Fig. 4D, bottom); DHS sites were clearly also present at NF-E2-bound enhancers, albeit weaker, on average, than those at PU.1-binding sites (Fig. 4D, top). Moreover, MEL cells showed prominent DHS at well-marked erythroid cell enhancers as well as granulocyte PU.1-binding enhancers, and granulocytes showed reciprocal DHS at sites that bind GATA1 in MEL cells (Supplemental Fig. S7C,D). Thus, in specified blood cells, enhancers near lineage-restricted genes show several cardinal features of activation in sibling lineages where these genes are inactive: paucity of a central nucleosome, stably positioned flanking nucleosomes, H3K4me2 as well as H3K27ac marks, and DHS.
Resolution of enhancer marks is a prominent feature of blood cell epigenotypes
The seemingly indiscriminate marking of enhancers was surprising, first because it occurs in cells that lack crucial TFs; therefore, many enhancers must be primed by either undetectably low levels of NF-E2 and PU.1 or TFs with the same binding preferences. More importantly, if enhancers are primed in lineages that express the same TFs (MKs and erythroid cells, for example, express GATA1 and NF-E2, albeit at different levels and different stages), then indiscriminate gene expression may be unavoidable. One solution could be that broadly placed enhancer marks resolve upon MK maturation to preclude TF binding at erythroid-specific genes but may not need to resolve in mature granulocytes, which lack the relevant TFs.
To test this possibility, we first examined the immature forms of each specified cell type. Correlation plots of all enhancer H3K4me2 marks revealed the major disparities and overlaps across lineages (Fig. 5A). Many enhancers were similarly marked in MKs and erythroid cells, which emerge from a common progenitor, whereas immature erythroid cells and granulocytes, which diverge earlier, showed stronger marking in one or the other cell type. Thus, marks inherited from CMPs, their last common progenitor, seemed well resolved in these distant progeny, consistent with a step-wise delineation of enhancers in hematopoiesis (Fig. 2). Comparing terminally mature cells with their immature precursors, we observed that enhancers in mature erythroid cells and granulocytes were modestly changed from those in their immature forms, whereas terminally differentiated MKs showed substantial gains and losses (Fig. 5B). Some of the losses occurred at the same sites in both erythroid cells and MKs (orange box in Fig. 5C, negative X-axis and Y-axis values). However, many more sites selectively lost H3K4me2 in MKs (green box in Fig. 5C), and these sites mapped largely to genes that are highly and specifically expressed in erythroid cells, such as Gypa and Alas2 (Fig. 5D). Indeed, enhancers that lost H3K4me2 selectively in mature MKs preferentially lie near genes that are expressed only in erythroid cells and are significantly underrepresented near genes expressed in mature MKs (Fig. 5E). Thus, terminal MK maturation is accompanied by extensive loss of marking at enhancers that serve a sibling lineage.
Figure 5.

Functionally significant gains and losses of chromatin marks accompany terminal blood cell maturation. (A) Scatter plots representing the relationship of all H3K4me2-marked enhancers in immature erythroid cells (X-axis) to those in immature MKs (left) and granulocytes (right). (B) Distribution of scores for the change in H3K4me2 levels at all MACS-identified enhancer peaks during maturation in three specified lineages. Positive values represent a gain, and negative values represent loss, of H3K4me2 signal, as explained in the Materials and Methods. (C) Scatter plot representing the dynamic change in H3K4me2 scores at each enhancer upon MK maturation (X-axis) compared with changes at the same site during erythroid cell maturation (Y-axis). The dotted box demarcates regions that lose H3K4me2 during maturation of both lineages, and the green box demarcates the 5000 regions most significantly affected in mature MKs, with minimal change (values near 0) in mature erythroid cells. (D) H3K4me2 distributions at representative erythroid (ERY)-specific loci Gypa and Alas2, showing significant signal loss during MK maturation. (E) Graphs showing the fractions of erythroid- and MK-expressed genes among those located <20 kb from H3K4me2 peaks demarcated by the green box in C.
In summary, enhancer activity in hematopoiesis is highly dynamic and closely tied to gene expression, with the profile at any stage reflecting both de novo acquisition of activation marks at many enhancers and lineage-specific loss of marking at others. Moreover, enhancers may acquire marks early at many lineage-restricted genes, proceeding to retain them in the lineage where they are required and shed them in others. The erythroid-specific gene Chchd10 illustrates our major findings nicely (Fig. 6). NF-E2 binds an upstream enhancer in erythroid cells that shows flanking well-positioned nucleosomes that bear H3K4me2 and H3K27ac in specified blood cells, including granulocytes, but not in HSCs or progenitor cells. Although PU.1 does not bind the same site in granulocytes, the region is hypersensitive to DNaseI, and H3K27ac marking in particular is robust. This example illustrates that enhancers for lineage-specific genes are delineated with limited fidelity close to the stage in hematopoiesis when terminal blood cells become specified.
Figure 6.

Chronology and infidelity of enhancer delineation at a representative locus illustrate the principal conclusions of this study. IGV traces at a representative erythroid-expressed locus, Chcd10, show strong NF-E2 binding at a distant erythroid enhancer (dashed lines) that does not bind PU.1 in granulocytes. H3K4me2-marked nucleosomes flank this enhancer in erythroid cells and MKs, and weakly in granulocytes, with significant resolution of the mark in terminally mature MKs. This region carries strong H3K27ac marks and DHS in granulocytes, indicating enhancer delineation. The promoter (arrow) is strongly marked in most blood cells, but enhancer marks are extremely weak to absent in HSC or progenitor cells.
Discussion
Access of TFs to cis-regulatory elements is a crucial barrier for tissue-restricted gene expression, and differentiation requires each cell type to delineate a unique complement of functional enhancers. (Felsenfeld and Groudine 2003; Biggin 2011). Current understanding of permissive chromatin states in mammalian cells is limited because it rests mainly on studies in ESCs and cultured cell lines. Using primary mouse blood cells, we identified telling features of the chronology and specificity with which enhancers are delineated in vivo during hematopoiesis.
Although nucleosomes carrying activating histone marks were robustly positioned at lineage-specific enhancers in specified blood cells, only rudimentary activation was evident in early progenitors. Thus, blood cell enhancers are delineated de novo, concomitant with cell specification, in sharp contrast to the considerable advance priming of enhancers for multiple daughter lineages in intestinal stem and progenitor cells (Kim et al. 2014). This difference may reflect alternative modes of cell differentiation: hierarchical in hematopoiesis and lateral inhibition in intestinal crypts. Enhancer chromatin in primary blood cells also contrasts with steroid responses in cultured cells or T-cell lineage specification. In these cases, ligand-activated glucocorticoid receptor (GR) or FOXP3, a TF acting late in T-cell ontogeny, bind mainly at enhancers where other factors had previously enabled chromatin access (Biddie et al. 2011; John et al. 2011; Samstein et al. 2012). Nuclear hormone receptors, TFs that determine lymphocyte subtypes, and lateral inhibition all operate over short time frames, which may demand rapid TF binding to cis-elements. In contrast, lineage allocation in hematopoiesis is a serial process in which progenitors sequentially narrow differentiation potential. Different blood cell proportions are not fixed but respond dynamically to physiologic needs, and delayed enhancer delineation may be a practical way for progenitors to retain choices. Because TF access to chromatin lies at the heart of cell differentiation, it will be instructive to determine how other tissues achieve the same ends.
Of note, even among enhancers that are delineated de novo during differentiation, many sites probably regulate constitutive genes, while others remain poised for future, stimulus-induced activation (John et al. 2011; Garber et al. 2012). Moreover, enhancer H3K4me2 loss accompanies cell differentiation as much as the appearance of new marks near lineage-restricted genes. In particular, thousands of enhancers shed H3K4me2 during MK maturation (Fig. 5). Terminal MK differentiation requires NF-E2-dependent genes different from NF-E2-responsive erythroid cell genes. Therefore, differentiation of MKs and erythroid cells, which use TFs such as NF-E2 and GATA1 in different contexts, may necessitate both reversal of priming at erythroid-specific enhancers and new delineation of MK-specific enhancers (Fig. 1).
Many enhancers respond to TFs in a single blood lineage or control genes with unilineage expression; surprisingly, many such enhancers showed activated histone marks, stably positioned nucleosomes, and DHS in sibling cells. This unanticipated lack of fidelity might enable broader access than is needed for lineage-restricted gene expression, and some enhancer marks persisted even in terminally mature cells, especially granulocytes (data not shown). As enhancers were primed in pure cell populations and only some sites for a lineage were marked in others, contaminant cells are unlikely to account for activated histone marks in sibling lineages. Moreover, the significance of our findings does not rest heavily on assumptions about the corresponding target genes, which may lie near the marked regions or far away. Rather, an important feature is that marked, well-positioned nucleosomes were present at exactly the same thousands of nonoverlapping sites that bind NF-E2 in one cell type and PU.1 in another.
Enhancers unexpectedly delineated in sibling lineages are not inherited from a common progenitor but arise de novo in discrete lineages. Because erythroid or granulocyte active enhancers are barely marked in GMPs and MEPs, progenitors that arise after lineage divergence, enhancer properties must appear separately in specialized cells irrespective of target gene expression. Moreover, strong nucleosome positioning, histone marks, and DHS in cells that do not express nearby genes indicate that these features are maintained without active transcription. These observations raise the question as to which TFs prime these enhancers. Our search for DNA sequence motifs enriched among high-affinity NF-E2- and PU.1-binding sites returned only motifs associated with the index TF (data not shown). As enhancer priming coincides with lineage specification, low-level expression of these or other TFs that recognize the same motifs may initiate the priming. The presence of enhancer marks and DHS in cells that categorically lack PU.1 or NF-E2 also indicates that high levels of these TFs are not necessary to maintain priming. That role must therefore fall to other TFs, much as AP1 and FoxA1 enable chromatin access for nuclear hormone receptors with different binding specificities (Carroll et al. 2005; Biddie et al. 2011). In blood cells, such factors might position nucleosomes and help modify histones but fail to activate genes fully in the absence of other required factors.
Our findings may shed light on classical observations in hematopoiesis, such as multilineage priming and lineage reprogramming. First, if enhancer marks at many blood genes are present at all in multipotent progenitors, they are rudimentary, commensurate with low-level transcription of genes associated with cell maturity (Hu et al. 1997; Laslo et al. 2006). The weak enhancer H3K4me2 marking in primary mouse myeloid progenitors differs from the robust H3K4me1 marking reported in Id2-overexpressing lymphoid progenitors (Mercer et al. 2011). We attribute this difference to the divergent experimental models and not the examination of subtly different histone marks. H3K4me1 and H3K4me2 are highly correlated at enhancers (Barski et al. 2007; The ENCODE Project Consortium 2012), and the profiles across primary blood cells indicate that H3K4me2 does not merely track with transcriptional activity but is a bona fide enhancer feature. Second, to reprogram committed blood cells into a different lineage without intermediate cell replication (Kulessa et al. 1995; Heyworth et al. 2002; Xie et al. 2004; Taghon et al. 2007), TFs such as GATA1 and C/EBP must enable access to new enhancers or bind enhancers that were already primed. Our findings suggest that transdifferentiation may exploit blood cells’ inherent delineation of enhancers for alternative cell programs. This indiscriminate process may normally be tolerated because it is inconsequential when key TFs are absent and may allow forcibly expressed TFs to activate certain programs. Lineage reprogramming is efficient only with select combinations of TFs and cells (Heyworth et al. 2002; Xie et al. 2004; Taghon et al. 2007), perhaps those in which primed enhancers can productively engage the exogenous TF. Epigenomes may thus define the potential and limits of transdifferentiation.
Waddington (1957) used the now iconic metaphor of a hilly terrain to illustrate his original conception of “epigenotypes,” referring to the “causal interactions…which bring the phenotype into being.” Changes in chromatin configuration at selected genes and cis-elements have long been thought to underlie differentiation decisions (Goldberg et al. 2007). To date, however, chromatin dynamics have not been measured systematically in any series of differentiating primary cells. Our quantitative analysis of a canonical active histone mark at blood cell genes in stem, progenitor, specified, and terminally mature cells in three distinct lineages accurately represents enhancer modulation during hematopoiesis (Fig. 2). Different tissues will probably show diverse topologies for enhancer modulation, depending on when and how faithfully they enable latent transcriptional potential in daughter cells.
Materials and methods
Cell expansion, isolation, and flow cytometry
Mature, immature, and progenitor blood cells were expanded from mouse fetal livers harvested on gestational day 14 and cultured in Dulbecco’s modified Eagle medium supplemented with 10% fetal bovine serum (FBS). To expand erythroid cells, granulocytes, or MKs, cultures were supplemented, respectively, with 0.02 μg/10 mL stem cell factor (SCF; R&D Systems) and 2 ng/mL erythropoietin (EPO; R&D Systems); 5 μg/mL SCF and granulocyte colony-stimulating factor (G-CSF; R&D Systems); or thrombopoietin (TPO; 1/100 dilution of a producer cell culture supernatant [Villeval et al. 1997]). Blood progenitors were cultured in medium supplemented with 5 ng/mL each SCF and interleukin-3 (IL-3) (R&D Systems). Cell purity was monitored by May-Grünwald-Giemsa staining of cytocentrifuged preparations and flow cytometry analysis using FITC-labeled CD41, APC-labeled TER119, APC-labeled GR1, or PE-labeled CD11b monoclonal antibodies (mAb; 1:200; BD Pharmingen) and a FACSCanto II flow cytometer (BD Pharmingen). Thymocytes and intestinal villus cells were taken from 4-wk-old mice.
Specified blood cells were isolated by depleting the other lineages using TER119, GR1, CD41, and CD11b (BD Pharmingen) mAb and immunomagnetic Dynabeads (Invitrogen) or by positive flow cytometry selection using GR1 or TER119 mAb. MK isolations included additional passage over triple (4%, 3%, and 1.5%) gradients of bovine serum albumin, with collection of the supernatant (immature MKs) or pellet (mature MKs). HSCs, CMPs, MEPs, and GMPs were isolated as described (Wang et al. 2010). Lineage-committed cells were depleted using biotinylated Ter119, CD41, CD11b, and GR1 mAb (BD Pharmingen) and streptavidin beads. Washed residual cells were incubated with PE cy7-conjugated Sca1, APC-conjugated kit, FITC-conjugated CD34, PE-conjugated FCRγΙΙ/ΙΙΙ Ab (BD Pharmingen), and DAPI for 30 min at 4°C; filtered; and sorted in a FACSAria II SORP (BD Pharmingen). Live KithiSca1lo progenitors were sorted further to isolate progenitor populations (Supplemental Fig. S1E).
Expression analyses and correlation with nucleosomal marks and TF occupancy
RNA was isolated from purified MKs, erythroid cells, and granulocytes using the RNeasy minikit (Qiagen) and analyzed on Mouse Genome 430A 2.0 arrays (Affymetrix) following the manufacturer’s instructions. mRNA profiles were analyzed by robust multiarray analysis (RMA) to normalize expression indices (Irizarry et al. 2003). Genes with a unique RefSeq ID assigned to the probe set and called as “present” in at least one sample were retained for analysis. Differential gene expression in MK maturation was identified using LIMMA (Smyth 2004) with P < 0.05. For enrichment or depletion of tissue-specific genes, Fisher’s exact test was used to calculate the P-value. Erythroid- and granulocyte-specific genes were identified using a twofold cutoff in differences between average expression indices. Portions of the integrative analyses were performed in the Cistrome pipeline (Liu et al. 2011).
ChIP-seq for modified histones or TFs and DHS sequencing (DHS-seq)
Mononucleosomes, collected after digesting chromatin with MNase (Sigma, N-3755) for 6 min at 37°C, were immunoprecipitated with H3K4me2 (Millipore, 07-030) or H3K27ac (Abcam, ab4729) Ab. ChIP for TFs and for histone modifications in progenitor cells used published conditions (Verzi et al. 2010) for cross-linked, sonicated chromatin and rabbit NF-E2 (Lecine et al. 2000) or PU.1 (Santa Cruz Biotechnology, SC-352) antisera. At least 20 ng of precipitated or input DNA from pools of at least three replicates was processed for deep sequencing using TruSeq (Illumina) library preparation kits for specified blood cells and ThruPLEX-FD kits (Rubicon Genomics) for progenitors.
To map DHS in granulocytes, we digested nuclear extracts as reported (Sabo et al. 2006). Cell mixtures depleted of MKs, erythroid cells, and macrophages were washed and resuspended in 6 mL of buffer A (15 mM Tris-Cl at pH 8.0, 15 mM NaCl, 60 mM KCl, 1 mM EDTA, 0.5 mM EGTA, 0.5 mM spermidine, 0.15 mM spermine). Nuclei, released by drop-wise addition of 2 mL of 0.2% NP-40 and incubation for 10 min on ice, were collected by centrifugation, washed in buffer A lacking spermidine or spermine, and resuspended in 2 mL of DNase I digestion buffer (60 mM CaCl2, 100 mM NaCl, 10 mM CaCl2, 400 mM Tris-HCl) at 37°C. Nuclei were divided among four tubes, and 25 U, 40 U, 50 U, or no DNase I (Roche, 04716728001) was added. Digestion was terminated by incubating in an equal volume of stop buffer (50 mM Tris-HCl at pH 8.0, 100 mM NaCl, 0.1% SDS, 100 mM EDTA, 20 mg/mL proteinase K) for 2 h at 55°C. DNA, extracted using phenol and chloroform, was treated with 1 U of RNase (Roche) for 30 min at 37°C and resolved on 2% agarose gels; fractions between 50 base pairs (bp) and 100 bp were purified. DHS fragments and ChIP libraries were sequenced by Illumina HiSeq2000
Computational analysis of ChIP-seq and DHS-seq
ChIP-seq reads were aligned to mouse genome build mm9, and uniquely mapped, nonredundant reads were retained (Zang et al. 2009). Nucleosome-resolution genomic profiles of H3K4me2 and H3K27ac in MNase-digested chromatin were generated using NPS (Zhang et al. 2008b) with default parameters. Profiles of histone marks or TF-binding sites in sonicated chromatin and DHS sites were generated using MACS (Zhang et al. 2008a). Genomic wiggle traces were additionally normalized by levels in the top 1% of signals. Nucleosome pairs were identified and analyzed using BINOCh (Meyer et al. 2011). Histone modification peaks and TF-binding sites were identified using MACS 1.4 under a P-value threshold of 10−5 with default parameters. For analyses centered on ChIP peaks, nonpromoter (>2 kb from any TSS) MACS peaks from different cell samples were merged into a union peak set. Read densities (in reads per kilobase per million tags [RPKM]) were calculated by normalizing the read count on each peak region in the union set based on sequencing depth and region width. Analyses centered on genes were based on read densities between 2-kb and 20-kb regions on both sides of the TSSs of coding genes. Dynamic changes in histone modification level Δ in a given region i were calculated using the formula (He et al. 2010)
where
 |
is the average read count for all peaks in the genome per sample, for k = c (control) or t (treated), representing the two samples being compared. Additional information is provided in the Supplemental Material, and all primary data are available under Gene Expression Omnibus (GEO) accession code GSE42110.
Association of chromatin dynamics with lineage-specific gene expression
We calculated the dynamic change in H3K4me2 levels at each gene locus between every two consecutive stages in differentiation and used a multiple linear regression model to estimate the contribution of each step toward gene expression in the final cell destination.
where  is the differential expression of gene i in cell type k (k in {ERY, MK, Gran}) compared with the other two mature cell types,
  is the dynamic change in H3K4me2 levels in the process j on gene i, and j refers to a dynamic process between two consecutive differentiation steps; i.e., HSC to CMP, CMP to GMP or MEP, GMP to GRANIMM, GRANIMM to GRANMAT, etc. A three-dimensional vector
  was then estimated as the contributing factor for process j. In the three-dimensional space, HSCs are positioned at (0, 0, 0), and the position of each differentiation stage is determined from the recursive relation
where j = AB is the dynamic process from stage A to stage B. Final coordinates of every cell type (Supplemental Fig. S3B) were then transformed to a two-dimensional plane using multidimensional scaling (MDS) (Fig. 2B). The Waddington landscape representation of the map was finally generated using the distance between each pair of consecutive steps as the attitude difference in the down direction from the hilltop.
Composite profiling of ChIP-seq read density on a set of regions
Regions were aligned by the summit positions at 1-bp resolution, and ChIP-seq reads were tallied in nonoverlapping 5-bp windows. The genomic location of a sequence read was shifted in the 3′ direction by half the average ChIP DNA fragment size to represent the center of the relevant fragment, estimated by calculating the cross-correlation between all 5′ and 3′ reads (Zang et al. 2009). Total read counts were then normalized to RPKM. For composite profiling of DHS-seq data, 5′ and 3′ read densities were calculated separately, without shifting (Jin et al. 2009).
RNA expression
cDNA prepared using the QuantiTect reverse transcription kit (Qiagen) was analyzed by quantitative RT–PCR using the following oligonucleotide primers (5′ to 3′): Ube2o (forward, TGGTGCCAAACTCTACGATG; reverse, ACCACACGGAACTTGCTCTT), Hprt (forward, ACCCCACGAAGTGTTGGATA; reverse, AAGCAGATGGCCACAGAACT), Alas2 (forward, TTCCCCACCTGATTCAGAAC; reverse, CCATAGATGCCTCGGAGAAG), Fhr1 (forward, GTGTCCAAGGATGGCAAGAT; reverse, CCAATGACTTGCTTGCAGTT), Tspo2 (forward, ATGGGCTATGCCTCCTACCT; reverse, ACACCAGGCTTGCTACCAGT), and Prokr1 (forward, GCTACAAAAAGCTCCGCAAC; reverse, GTAGTTGACAGAGGCGCACA).
Immunoblotting
Cells were lysed in radioimmunoprecipitation assay (RIPA) buffer and boiled for 5 min in SDS sample buffer before resolving proteins in 10% SDS-PAGE and electrotransfer to nitrocellulose membranes. Blots were blocked with 5% milk powder in Tris-buffered saline (TBS; pH 7.5) containing 0.1% Tween-20 and incubated overnight at 4°C with NF-E2 (1:1000) (Tiwari et al. 2003) or PU.1 (1:200; Santa Cruz Biotechnology, SC-352) Ab in 5% milk powder or GATA1 Ab (1:1000; Cell Signaling, 3535) in 3% bovine serum albumin. Blots were washed with TBS-Tween and incubated with horseradish peroxidase-conjugated goat anti-rabbit IgG (1:2000; Santa Cruz Biotechnology), and signals were detected using ECL detection reagents (Santa Cruz Biotechnology).
Acknowledgments
We thank Myles Brown, Henry Long, and members of our groups for constructive discussions. This work was supported by National Institutes of Health grants R01HL63143 (R.A.S.) and R01GM099409 (X.S.L.) and a fellowship from the Leukemia and Lymphoma Society (C.Z.).
Footnotes
Supplemental material is available for this article.
Article is online at http://www.genesdev.org/cgi/doi/10.1101/gad.240101.114.
References
- Arinobu Y, Mizuno S, Chong Y, Shigematsu H, Iino T, Iwasaki H, Graf T, Mayfield R, Chan S, Kastner P, et al. 2007. Reciprocal activation of GATA-1 and PU.1 marks initial specification of hematopoietic stem cells into myeloerythroid and myelolymphoid lineages. Cell Stem Cell 1: 416–427 [DOI] [PubMed] [Google Scholar]
- Barski A, Cuddapah S, Cui K, Roh TY, Schones DE, Wang Z, Wei G, Chepelev I, Zhao K. 2007. High-resolution profiling of histone methylations in the human genome. Cell 129: 823–837 [DOI] [PubMed] [Google Scholar]
- Bernstein BE, Mikkelsen TS, Xie X, Kamal M, Huebert DJ, Cuff J, Fry B, Meissner A, Wernig M, Plath K, et al. 2006. A bivalent chromatin structure marks key developmental genes in embryonic stem cells. Cell 125: 315–326 [DOI] [PubMed] [Google Scholar]
- Biddie SC, John S, Sabo PJ, Thurman RE, Johnson TA, Schiltz RL, Miranda TB, Sung MH, Trump S, Lightman SL, et al. 2011. Transcription factor AP1 potentiates chromatin accessibility and glucocorticoid receptor binding. Mol Cell 43: 145–155 [DOI] [PMC free article] [PubMed] [Google Scholar]
- Biggin MD 2011. Animal transcription networks as highly connected, quantitative continua. Dev Cell 21: 611–626 [DOI] [PubMed] [Google Scholar]
- Boyle AP, Davis S, Shulha HP, Meltzer P, Margulies EH, Weng Z, Furey TS, Crawford GE. 2008. High-resolution mapping and characterization of open chromatin across the genome. Cell 132: 311–322 [DOI] [PMC free article] [PubMed] [Google Scholar]
- Carroll JS, Liu XS, Brodsky AS, Li W, Meyer CA, Szary AJ, Eeckhoute J, Shao W, Hestermann EV, Geistlinger TR, et al. 2005. Chromosome-wide mapping of estrogen receptor binding reveals long-range regulation requiring the forkhead protein FoxA1. Cell 122: 33–43 [DOI] [PubMed] [Google Scholar]
- Creyghton MP, Cheng AW, Welstead GG, Kooistra T, Carey BW, Steine EJ, Hanna J, Lodato MA, Frampton GM, Sharp PA, et al. 2010. Histone H3K27ac separates active from poised enhancers and predicts developmental state. Proc Natl Acad Sci 107: 21931–21936 [DOI] [PMC free article] [PubMed] [Google Scholar]
- Cui K, Zang C, Roh TY, Schones DE, Childs RW, Peng W, Zhao K. 2009. Chromatin signatures in multipotent human hematopoietic stem cells indicate the fate of bivalent genes during differentiation. Cell Stem Cell 4: 80–93 [DOI] [PMC free article] [PubMed] [Google Scholar]
- Davidson EH. 2006. The regulatory genome: gene regulatory networks in development and evolution. Academic Press, San Diego, CA. [Google Scholar]
- The ENCODE Project Consortium. 2012. An integrated encyclopedia of DNA elements in the human genome. Nature 489: 57–74 [DOI] [PMC free article] [PubMed] [Google Scholar]
- Felsenfeld G, Groudine M. 2003. Controlling the double helix. Nature 421: 448–453 [DOI] [PubMed] [Google Scholar]
- Garber M, Yosef N, Goren A, Raychowdhury R, Thielke A, Guttman M, Robinson J, Minie B, Chevrier N, Itzhaki Z, et al. 2012. A high-throughput chromatin immunoprecipitation approach reveals principles of dynamic gene regulation in mammals. Mol Cell 47: 810–822 [DOI] [PMC free article] [PubMed] [Google Scholar]
- Goldberg AD, Allis CD, Bernstein E. 2007. Epigenetics: a landscape takes shape. Cell 128: 635–638 [DOI] [PubMed] [Google Scholar]
- He HH, Meyer CA, Shin H, Bailey S, Wei G, Wang Q, Zhany Y, Xu K, Ni M, Lupien M, et al. 2010. Positioned nucleosomes flanking a labile nucleosome characterize transcriptional enhancers. Nat Genet 42: 343–347 [DOI] [PMC free article] [PubMed] [Google Scholar]
- Heintzman ND, Stuart RK, Hon G, Fu Y, Ching CW, Hawkins RD, Barrera LO, Van Calcar S, Qu C, Ching KA, et al. 2007. Distinct and predictive chromatin signatures of transcriptional promoters and enhancers in the human genome. Nat Genet 39: 311–318 [DOI] [PubMed] [Google Scholar]
- Heintzman ND, Hon GC, Hawkins RD, Kheradpour P, Stark A, Harp LF, Ye Z, Lee LK, Stuart RK, Ching CW, et al. 2009. Histone modifications at human enhancers reflect global cell-type-specific gene expression. Nature 459: 108–112 [DOI] [PMC free article] [PubMed] [Google Scholar]
- Heinz S, Benner C, Spann N, Bertolino E, Lin YC, Laslo P, Cheng JX, Murre C, Singh H, Glass CK. 2010. Simple combinations of lineage-determining transcription factors prime cis-regulatory elements required for macrophage and B cell identities. Mol Cell 38: 576–589 [DOI] [PMC free article] [PubMed] [Google Scholar]
- Heyworth C, Pearson S, May G, Enver T. 2002. Transcription factor-mediated lineage switching reveals plasticity in primary committed progenitor cells. EMBO J 21: 3770–3781 [DOI] [PMC free article] [PubMed] [Google Scholar]
- Hromas R, Orazi A, Neiman RS, Maki R, Van Beveran C, Moore J, Klemsz M. 1993. Hematopoietic lineage- and stage-restricted expression of the ETS oncogene family member PU.1. Blood 82: 2998–3004 [PubMed] [Google Scholar]
- Hu M, Krause D, Greaves M, Sharkis S, Dexter M, Heyworth C, Enver T. 1997. Multilineage gene expression precedes commitment in the hemopoietic system. Genes Dev 11: 774–785 [DOI] [PubMed] [Google Scholar]
- Irizarry RA, Hobbs B, Collin F, Beazer-Barclay YD, Antonellis KJ, Scherf U, Speed TP. 2003. Exploration, normalization, and summaries of high density oligonucleotide array probe level data. Biostat 4: 249–264 [DOI] [PubMed] [Google Scholar]
- Jin C, Zang C, Wei G, Cui K, Peng W, Zhao K, Felsenfeld G. 2009. H3.3/H2A.Z double variant-containing nucleosomes mark ‘nucleosome-free regions’ of active promoters and other regulatory regions. Nat Genet 41: 941–945 [DOI] [PMC free article] [PubMed] [Google Scholar]
- John S, Sabo PJ, Thurman RE, Sung MH, Biddie SC, Johnson TA, Hager GL, Stamatoyannopoulos JA. 2011. Chromatin accessibility pre-determines glucocorticoid receptor binding patterns. Nat Genet 43: 264–268 [DOI] [PMC free article] [PubMed] [Google Scholar]
- Kim TH, Li F, Ferreiro-Neira I, Ho L-L, Luyten A, Nalapareddy K, Long H, Verzi M, Shivdasani RA. 2014. Broadly permissive intestinal chromatin underlies lateral inhibition and cell pasticity. Nature 506: 511–515 [DOI] [PMC free article] [PubMed] [Google Scholar]
- Koche RP, Smith ZD, Adli M, Gu H, Ku M, Gnirke A, Bernstein BE, Meissner A. 2011. Reprogramming factor expression initiates widespread targeted chromatin remodeling. Cell Stem Cell 8: 96–105 [DOI] [PMC free article] [PubMed] [Google Scholar]
- Kulessa H, Frampton J, Graf T. 1995. GATA-1 reprograms avian myelomonocytic cell lines into eosinophils, thromboblasts, and erythroblasts. Genes Dev 9: 1250–1262 [DOI] [PubMed] [Google Scholar]
- Laslo P, Spooner CJ, Warmflash A, Lancki DW, Lee HJ, Sciammas R, Gantner BN, Dinner AR, Singh H. 2006. Multilineage transcriptional priming and determination of alternate hematopoietic cell fates. Cell 126: 755–766 [DOI] [PubMed] [Google Scholar]
- Lecine P, Italiano JE Jr, Kim SW, Villeval JL, Shivdasani RA. 2000. Hematopoietic-specific β 1 tubulin participates in a pathway of platelet biogenesis dependent on the transcription factor NF-E2. Blood 96: 1366–1373 [PubMed] [Google Scholar]
- Lefterova MI, Steger DJ, Zhuo D, Qatanani M, Mullican SE, Tuteja G, Manduchi E, Grant GR, Lazar MA. 2010. Cell-specific determinants of peroxisome proliferator-activated receptor γ function in adipocytes and macrophages. Mol Cell Biol 30: 2078–2089 [DOI] [PMC free article] [PubMed] [Google Scholar]
- Liu T, Ortiz JA, Taing L, Meyer CA, Lee B, Zhang Y, Shin H, Wong SS, Ma J, Lei Y, et al. 2011. Cistrome: an integrative platform for transcriptional regulation studies. Genome Biol 12: R83. [DOI] [PMC free article] [PubMed] [Google Scholar]
- Mercer EM, Lin YC, Benner C, Jhunjhunwala S, Dutkowski J, Flores M, Sigvardsson M, Ideker T, Glass CK, Murre C. 2011. Multilineage priming of enhancer repertoires precedes commitment to the B and myeloid cell lineages in hematopoietic progenitors. Immunity 35: 413–425 [DOI] [PMC free article] [PubMed] [Google Scholar]
- Meyer CA, He HH, Brown M, Liu XS. 2011. BINOCh: binding inference from nucleosome occupancy changes. Bioinformatics 27: 1867–1868 [DOI] [PMC free article] [PubMed] [Google Scholar]
- Mikkelsen TS, Ku M, Jaffe DB, Issac B, Lieberman E, Giannoukos G, Alvarez P, Brockman W, Kim TK, Koche RP, et al. 2007. Genome-wide maps of chromatin state in pluripotent and lineage-committed cells. Nature 448: 553–560 [DOI] [PMC free article] [PubMed] [Google Scholar]
- Paige SL, Thomas S, Stoick-Cooper CL, Wang H, Maves L, Sandstrom R, Pabon L, Reinecke H, Pratt G, Keller G, et al. 2012. A temporal chromatin signature in human embryonic stem cells identifies regulators of cardiac development. Cell 151: 221–232 [DOI] [PMC free article] [PubMed] [Google Scholar]
- Rada-Iglesias A, Bajpai R, Swigut T, Brugmann SA, Flynn RA, Wysocka J. 2010. A unique chromatin signature uncovers early developmental enhancers in humans. Nature 470: 279–283 [DOI] [PMC free article] [PubMed] [Google Scholar]
- Rekhtman N, Radparvar F, Evans T, Skoultchi AI. 1999. Direct interaction of hematopoietic transcription factors PU.1 and GATA-1: functional antagonism in erythroid cells. Genes Dev 13: 1398–1411 [DOI] [PMC free article] [PubMed] [Google Scholar]
- Sabo PJ, Kuehn MS, Thurman R, Johnson BE, Johnson EM, Cao H, Yu M, Rosenzweig E, Goldy J, Haydock A, et al. 2006. Genome-scale mapping of DNase I sensitivity in vivo using tiling DNA microarrays. Nat Methods 3: 511–518 [DOI] [PubMed] [Google Scholar]
- Samstein RM, Arvey A, Josefowicz SZ, Peng X, Reynolds A, Sandstrom R, Neph S, Sabo P, Kim JM, Liao W, et al. 2012. Foxp3 exploits a pre-existent enhancer landscape for regulatory T cell lineage specification. Cell 151: 153–166 [DOI] [PMC free article] [PubMed] [Google Scholar]
- Shen Y, Yue F, McCleary DF, Ye Z, Edsall L, Kuan S, Wagner U, Dixon J, Lee L, Lobanenkov VV, et al. 2012. A map of the cis-regulatory sequences in the mouse genome. Nature 488: 116–120 [DOI] [PMC free article] [PubMed] [Google Scholar]
- Shivdasani RA, Rosenblatt MF, Zucker-Franklin D, Jackson CW, Hunt P, Saris CJ, Orkin SH. 1995. Transcription factor NF-E2 is required for platelet formation independent of the actions of thrombopoietin/MGDF in megakaryocyte development. Cell 81: 695–704 [DOI] [PubMed] [Google Scholar]
- Shivdasani RA, Fujiwara Y, McDevitt MA, Orkin SH. 1997. A lineage-selective knockout establishes the critical role of transcription factor GATA-1 in megakaryocyte growth and platelet development. EMBO J 16: 3965–3973 [DOI] [PMC free article] [PubMed] [Google Scholar]
- Smyth GK 2004. Linear models and empirical Bayes methods for assessing differential expression in microarray experiments. Stat Appl Genet Mol Biol 3: 1544–6115 [DOI] [PubMed] [Google Scholar]
- Stergachis AB, Neph S, Reynolds A, Humbert R, Miller B, Paige SL, Vernot B, Cheng JB, Thurman RE, Sandstrom R, et al. 2013. Developmental fate and cellular maturity encoded in human regulatory DNA landscapes. Cell 154: 888–903 [DOI] [PMC free article] [PubMed] [Google Scholar]
- Taghon T, Yui MA, Rothenberg EV. 2007. Mast cell lineage diversion of T lineage precursors by the essential T cell transcription factor GATA-3. Nat Immunol 8: 845–855 [DOI] [PMC free article] [PubMed] [Google Scholar]
- Thurman RE, Rynes E, Humbert R, Vierstra J, Maurano MT, Haugen E, Sheffield NC, Stergachis AB, Wang H, Vernot B, et al. 2012. The accessible chromatin landscape of the human genome. Nature 489: 75–82 [DOI] [PMC free article] [PubMed] [Google Scholar]
- Tiwari S, Italiano JE Jr, Barral DC, Mules EH, Novak EK, Swank RT, Seabra MC, Shivdasani RA. 2003. A role for Rab27b in NF-E2-dependent pathways of platelet formation. Blood 102: 3970–3979 [DOI] [PubMed] [Google Scholar]
- Verzi MP, Shin H, He HH, Sulahian R, Meyer CA, Montgomery RK, Fleet JC, Brown M, Liu XS, Shivdasani RA. 2010. Differentiation-specific histone modifications reveal dynamic chromatin interactions and partners for the intestinal transcription factor CDX2. Dev Cell 19: 713–726 [DOI] [PMC free article] [PubMed] [Google Scholar]
- Villeval JL, Cohen-Solal K, Tulliez M, Giraudier S, Guichard J, Burstein SA, Cramer EM, Vainchenker W, Wendling F. 1997. High thrombopoietin production by hematopoietic cells induces a fatal myeloproliferative syndrome in mice. Blood 90: 4369–4383 [PubMed] [Google Scholar]
- Waddington CH 1942. The epigenotype. Endeavour 1: 18–20 [Google Scholar]
- Waddington CH. 1957. The strategy of the genes. Allen and Unwin, London, U.K. [Google Scholar]
- Wamstad JA, Alexander JM, Truty RM, Shrikumar A, Li F, Eilertson KE, Ding H, Wylie JN, Pico AR, Capra JA, et al. 2012. Dynamic and coordinated epigenetic regulation of developmental transitions in the cardiac lineage. Cell 151: 206–220 [DOI] [PMC free article] [PubMed] [Google Scholar]
- Wang Z, Zang C, Rosenfeld JA, Schones DE, Barski A, Cuddapah S, Cui K, Roh TY, Peng W, Zhang MQ, et al. 2008. Combinatorial patterns of histone acetylations and methylations in the human genome. Nat Genet 40: 897–903 [DOI] [PMC free article] [PubMed] [Google Scholar]
- Wang Y, Krivtsov AV, Sinha AU, North TE, Goessling W, Feng Z, Zon LI, Armstrong SA. 2010. The Wnt/β-catenin pathway is required for the development of leukemia stem cells in AML. Science 327: 1650–1653 [DOI] [PMC free article] [PubMed] [Google Scholar]
- Xie W, Ren B. 2013. Developmental biology. Enhancing pluripotency and lineage specification. Science 341: 245–247 [DOI] [PubMed] [Google Scholar]
- Xie H, Ye M, Feng R, Graf T. 2004. Stepwise reprogramming of B cells into macrophages. Cell 117: 663–676 [DOI] [PubMed] [Google Scholar]
- Xu J, Shao Z, Glass K, Bauer DE, Pinello L, Van Handel B, Hou S, Stamatoyannopoulos JA, Mikkola HK, Yuan G-C, et al. 2012. Combinatorial assembly of developmental stage-specific enhancers controls gene expression programs during human erythropoiesis. Dev Cell 23: 1–16 [DOI] [PMC free article] [PubMed] [Google Scholar]
- Yu M, Riva L, Xie H, Schindler Y, Moran TB, Cheng Y, Yu D, Hardison R, Weiss MJ, Orkin SH, et al. 2009. Insights into GATA-1-mediated gene activation versus repression via genome-wide chromatin occupancy analysis. Mol Cell 36: 682–695 [DOI] [PMC free article] [PubMed] [Google Scholar]
- Zang C, Schones DE, Zeng C, Cui K, Zhao K, Peng W. 2009. A clustering approach for identification of enriched domains from histone modification ChIP-Seq data. Bioinformatics 25: 1952–1958 [DOI] [PMC free article] [PubMed] [Google Scholar]
- Zhang Y, Liu T, Meyer CA, Eeckhoute J, Johnson DS, Bernstein BE, Nussbaum C, Myers RM, Brown M, Li W, et al. 2008a. Model-based analysis of ChIP-Seq (MACS). Genome Biol 9: R137. [DOI] [PMC free article] [PubMed] [Google Scholar]
- Zhang Y, Shin H, Song JS, Lei Y, Liu XS. 2008b. Identifying positioned nucleosomes with epigenetic marks in human from ChIP-Seq. BMC Genomics 9: 537. [DOI] [PMC free article] [PubMed] [Google Scholar]
- Zhang JA, Mortazavi A, Williams BA, Wold BJ, Rothenberg EV. 2012. Dynamic transformations of genome-wide epigenetic marking and transcriptional control establish T cell identity. Cell 149: 467–482 [DOI] [PMC free article] [PubMed] [Google Scholar]
- Zhu J, Adli M, Zou JY, Verstappen G, Coyne M, Zhang X, Durham T, Miri M, Deshpande V, De Jager PL, et al. 2013. Genome-wide chromatin state transitions associated with developmental and environmental cues. Cell 152: 642–654 [DOI] [PMC free article] [PubMed] [Google Scholar]