

Abstract
Polycystic ovarian syndrome (PCOS), the most common female endocrine disorder of unknown etiology, is characterized by reproductive abnormalities and associated metabolic conditions comprising insulin resistance, type 2 diabetes mellitus, and dyslipidemia. We previously reported that transgenic overexpression of nerve growth factor (NGF), a marker of sympathetic hyperactivity, directed to the ovary by the mouse 17α-hydroxylase/C17–20 lyase promoter (17NF mice), results in ovarian abnormalities similar to those seen in PCOS women. To investigate whether ovarian overproduction of NGF also induces common metabolic alterations of PCOS, we assessed glucose homeostasis by glucose tolerance test, plasma insulin levels, and body composition by dual-energy x-ray absorptiometry scan in young female 17NF mice and wild-type mice. 17NF mice exhibited increased body weight and alterations in body fat distribution with a greater accumulation of visceral fat compared with sc fat (P < .01). 17NF mice also displayed glucose intolerance (P < .01), decreased insulin-mediated glucose disposal (P < .01), and hyperinsulinemia (P < .05), which, similar to PCOS patients, occurred independently of body weight. Additionally, 17NF mice exhibited increased sympathetic outflow observed as increased interscapular brown adipose tissue temperature. This change was evident during the dark period (7 pm to 7 am) and occurred concomitant with increased interscapular brown adipose tissue uncoupling protein 1 expression. These findings suggest that overexpression of NGF in the ovary may suffice to cause both reproductive and metabolic alterations characteristic of PCOS and support the hypothesis that sympathetic hyperactivity may contribute to the development and/or progression of PCOS.
Polycystic ovarian syndrome (PCOS) is the most common endocrine disorder affecting women of reproductive age, with a worldwide prevalence of 6%–10% (1, 2). PCOS is also the most common cause of female infertility. This complex disorder is characterized by reproductive abnormalities, including hyperandrogenemia, menstrual disorders, and infertility (3). PCOS is also associated with a number of metabolic perturbations. Insulin resistance (IR) is a common manifestation in PCOS women with an estimated prevalence of 70% (4–6) and likely plays a role in the pathology of PCOS. Moreover, women with PCOS are at greater risk of metabolic syndrome, type 2 diabetes mellitus, dyslipidemia, and premature atherosclerosis (7). Importantly, although these risks are exacerbated by obesity, they are still heightened in patients with a normal body mass index (BMI) (8). Despite decades of research, the etiology of PCOS remains poorly understood. This in part reflects the heterogeneous nature of the disorder.
An alteration in sympathetic nerve activity has been proposed to contribute to the etiology of PCOS. Indeed, many of the common clinical symptoms of PCOS, including central obesity, hyperinsulinemia, and hyperandrogenemia, are associated with chronic increased activity of the sympathetic nervous system (9, 10). It has been previously demonstrated that adolescent PCOS patients exhibit a reduction in peripheral norepinephrine deamination and/or reuptake, suggestive of enhanced peripheral sympathetic activity (11). Additional indirect markers of such activity include enhanced heart rate variability (HRV) and a slow heart rate recovery after exercise, suggesting that in PCOS women, the sympathetic component of HRV is enhanced, whereas the parasympathetic component is reduced (12–14). Furthermore, direct assessment of muscle sympathetic nerve activity (MSNA) by microneurography revealed increased MSNA in lean PCOS women compared with lean controls (15).
An increased ovarian sympathetic tone in PCOS is supported by the finding of a greater density of catecholaminergic nerve fibers in polycystic ovaries (16) and an increased ovarian sympathetic outflow preceding the development of ovarian cysts in estradiol (E2)-valerate-treated rats (17). Additional studies in this rat model demonstrated an association between the development of follicular cysts and chronic increased production of nerve growth factor (NGF) in the ovary (18), a hallmark of sympathetic hyperactivity. NGF not only plays a role in maintaining the integrity of the peripheral nervous system but also a specific role within the ovary itself, where it facilitates the ovulatory process (19, 20). However, an overproduction of NGF has been shown to initiate pathological changes in endocrine and nonendocrine tissues (21, 22), and selective increase in intraovarian NGF content via grafting of NGF-producing neural progenitor cells in the rat ovary induced aberrant ovarian follicular dynamics and increased androstenodione levels (19). Therefore, excessive ovarian NGF production may be capable of initiating ovarian pathology in PCOS.
The association between NGF and PCOS was strengthened by the finding of excess production of the neurotrophin in PCOS women (23). In the same study, transgenic mice were generated carrying the NGF gene under the control of the 17α-hydroxylase/C17–20 lyase promoter (17NF mice). These mice showed overexpression of NGF in thecal/interstitial cells of the ovary, the normal site of NGF production in rodents. 17NF mice also had a greater density of tyrosine hydroxylase-positive nerve fibers in the ovary, indicative of sympathetic hyperinnervation. The ovaries of these mice exhibited an accumulation of antral follicles arrested at a medium-intermediate stage and enhanced granulosa cell apoptosis. Additionally, androgen synthesis increased in response to FSH-like stimulation, and the prevalence of follicular cysts increased after a persistent elevation in serum LH levels. These steroidal and morphological alterations were accompanied by compromised reproductive function characterized by delay in the age of vaginal opening and age of the first fertile estrous cycle as well as reduced litter sizes and lengthened reproductive cycles. The aforementioned observations suggest that both sympathetic hyperactivity and an excess of NGF in the ovary play a role in the development of the reproductive phenotype of PCOS. Here, we report the metabolic consequences of an excess production of ovarian NGF.
Materials and Methods
Animals
The transgenic mice used (termed 17NF) were previously described (23). The transgenic mice were generated by pronuclear microinjection of the transgene construct into fertilized eggs obtained from B6D2F1/J mice followed by transfer of the injected eggs into the uterus of a surrogate mother, using standard procedures. Mice of B6D2 background were used as controls and are hereafter referred to as wild-type (WT) mice.
Mice (Monash Animal Services) were fed a regular rodent diet (Specialty Feeds). They were housed in a controlled environment entrained to a 12-hour light, 12-hour dark cycle (lights on at 7 am, off at 7 pm). Food and water were available ad libitum. All procedures were performed in accordance with the approval of the Monash University Animal Ethics Committee.
Study design
Circulating sex steroid levels and plasma NGF levels were measured in adult 17NF and WT mice at 10 and 20 weeks of age. Metabolic studies, including body composition assessment, glucose tolerance tests (GTTs), and plasma insulin level measurements, were evaluated in 17NF and WT mice also at 10 and 20 weeks of age. Hyperinsulinemic-euglycemic clamps were performed in mice at 10 weeks of age. Mice were killed at either 10 or 20 weeks of age, and blood and tissues were collected. Approximately 0.6–1 mL of blood was collected from each mouse. Mice were euthanized at all stages of the estrous cycle. However, only blood collected from mice in estrus was analyzed, because 17NF mice spend a significant fraction of their adult reproductive life in this stage of the estrous cycle.
Assessment of sexual maturation
WT and 17NF mice were weaned at 21 days of age and placed in groups of 4–5 females per cage. The mice were observed daily for vaginal opening starting at postnatal day 21. After vaginal opening, vaginal lavages were collected daily (1–3 pm) for 14 consecutive days.
Food intake
Food intake was measured at 10 and 20 weeks of age during the time periods of 7 am to 1 pm, 1 pm to 7 pm, 7 pm to 10 pm, and 10 pm to 7 am over 3 consecutive days by calculating the difference in the amount of food given at the start of the time period and the amount remaining at the end of each period.
Body composition
Body composition was assessed in all mice at 5, 10, 15, and 20 weeks of age in using a dual-energy x-ray absorptiometry (DEXA) scanner (PIXImus2; Lunar/GE Medical Systems). This system is able to ascertain total fat content, lean mass, bone mineral density (BMD), and bone mineral content (BMC) of the mice. Mice were anesthetized for the duration of the procedure (3–5 min) by exposure to 2%–3% isoflurane/oxygen.
Abdominal and visceral fat mass could then be estimated from the DEXA scans using a method validated previously (24). Abdominal fat mass was estimated by measuring a specific region of interest in the abdominal area (L3-L5). Visceral fat was then estimated from the abdominal fat mass measurement by subtracting a bias factor to account for sc fat interference. The visceral fat to nonvisceral fat ratio was calculated by the following formula: visceral fat/(total fat − visceral fat).
Immunoassays
To improve the detection of sex steroids expressed at low concentrations, 200- to 300-μL plasma was extracted twice with 1 mL of hexane: toluene (2:1 by volume). The organic phase, containing testosterone (T) and E2, was recovered after freezing the aqueous phase and dried completely at 35°C in a vacuum centrifuge (SpeedVac; Thermo Scientific).
Plasma E2 was determined in duplicate by a specific and sensitive RIA (Ultrasensitive Estradiol RIA; Beckman Coulter, Inc) after organic extraction. The antibody used is highly specific for E2, and low cross-reactivity was obtained with related molecules, mainly estrone (2.4%), and E2 3-glucuronide (2.6%). The sensitivity was 2.7 pg/mL. The intraassay coefficient of variation (CV%) was 10.3% for a concentration of 19.0 pg/mL. The recovery processing of one sample with known quantities of E2 was approximately 91%.
Plasma T was determined using a T enzyme immunoassay kit (Cayman Chemical Co). The antibody used is highly specific for T. The antibody has significant cross-reactivity with 5α-dihydroT (27%) and 5β-dihydroT (19%), less than 5% for others androgens, such as MethylT, androstenedione, and less than 0.02% for dehydroepiandrosterone sulfate-sulfate. The time and temperature of incubation was modified to enhance the sensitivity (4°C instead of room temperature; and overnight incubation instead of 1–2 h). The sensitivity was 6.0 pg/mL. The intraassay CV% was 7.5% for a concentration of 31.3 pg/mL.
Plasma LH and FSH were measured by specific RIAs as previously described and validated (25, 26). Briefly, LH and FSH were measured in sera using rabbit antisera (LH antiserum S-11 1/187,500 [National Institute of Arthritis, Metabolism, and Digestive Disease] and FSH antiserum S-11 [National Institute of Diabetes and Digestive and Kidney Diseases]) and goat antirabbit IgG (Monash Institute of Medical Research).
Plasma insulin was measured by an in-house ELISA using a capture antibody (1:2500 purified guinea pig antiinsulin antibody) coated to the wells, a detection antibody (1:2000 biotin-conjugated antiinsulin), a Poly-horseradish peroxidase streptavidin conjugate solution (1:8000 streptavidin protein conjugated to a polymerized form of horseradish peroxidase), and chromogenic substrate (tetramethyl benzidine [TMB]). Serum samples, quality controls, standards (ranging from 0.1 to 10 ng/mL), and detection antibody were incubated at room temperature. After 2 hours, the wells were washed and incubated with Poly-horseradish peroxidase streptavidin conjugate solution for 30 minutes. Next, the wells were washed, the TMB substrate solution was added, and the incubation was continued for an additional 45 minutes. Stop solution (100 μL of H2SO4) was added immediately afterward, and the absorbance was measured at 450–630 nm. The intraassay CV% was less than 15%.
Plasma NGF was measured with a ChemiKine murine NGF ELISA kit (sensitivity, >10 pg/m; Chemicon) according to the manufacturer's instructions. A total of 100-μL standard or plasma per well was incubated overnight at 4°C followed by incubation with mouse antimouse NGF monoclonal antibodies for 2 hours at room temperature and peroxidase-labeled donkey antimouse IgG polyclonal antibodies for 2 hours at room temperature. A total 100 μL of TMB solution (3,3′,5′5′-tetramethylbenzidine) was added to each well, and the reaction was stopped by adding 100 μL of HCl. The plate was immediately read at 450 nm.
Telemetric transponder implantation, locomotor activity (LA), and measurement of interscapular brown adipose tissue (iBAT) temperature
Remote biotelemetry was performed using precalibrated sensitive transmitters (PDT-4000 G2 E-Mitter sensors; Mini Mitter Co). Under isoflurane anesthesia temperature sensors (E-Mitters) were surgically implanted beneath the iBAT pad between the scapulae. iBAT temperature and LA were measured as previously described (27). Signals were detected by a receiver positioned underneath the animals cage and analyzed using VitalView software. For all experiments, activity counts and interscapular temperature measurements were taken every 5 minutes.
Uncoupling protein 1 (UCP1) expression
UCP1 expression was determined by Western blotting in samples obtained from the iBAT as previously described (27). Briefly, tissues were homogenized in a modified ice-cold radio-immunoprecipitation assay lysis buffer. Proteins were separated by 10% precast Nu-PAGE (Invitrogen) gel electrophoresis and transferred onto a polyvinylidene difluoride membrane (Millipore). Target proteins were identified using primary anti-UCP1 (1:4000; kindly provided by Professor J Nedergaard, Wenner Gren Institute, Stockholm, Sweden) and anti-α/β-tubulin (1:4000; Cell Signaling Technology, Inc), together with their corresponding secondary antibodies antirabbit horse radish peroxidase antibody (1:1000 and 1:5000, respectively; Invitrogen). Protein bands were visualized with enhanced chemiluminescence reagents (PerkinElmer) in a ChemiDoc MP Imaging system (Bio-Rad).
Intraperitoneal GTT (IPGTT)
After a 4-hour fast, samples were obtained from tail vein bleeds from 17NF and WT mice. Blood glucose was measured using a glucometer (Accu-check; Roche Diagnostic Corp) at 0, 15, 30, 60, and 120 minutes after an ip injection of glucose (1 mg/g).
Hyperinsulinemic, euglycemic clamp
Mice were subjected to jugular vein catheterization (SILASTIC catheter; Dow Corning) 5 days before clamp studies. The catheters were kept patent with heparin sodium (10 IU/mL; Pfizer) and sealed with a stainless steel plug. After surgery, mice were individually housed, and body weight was recorded daily.
Clamps were performed on 5-hour fasted, conscious restrained mice. The infusion protocol consisted of a 60-minute tracer equilibration period (t = −60 to 0 min), followed by a 120-minute experimental period (t = 0 to 120 min). A bolus of [3-3H]glucose (2.5 μCi; PerkinElmer) was administered at t = −60 minutes, followed by a constant infusion of 0.05 μCi/min for 60 minutes, starting at 9 am. At t = −15 and −5 minutes, blood samples (∼50 μL) were obtained from the tail vein to assess basal plasma glucose concentration, plasma insulin, and glucose-specific activity. Clamp was initiated at t = 0 minutes with an infusion of human insulin (4 mU/kg · min; ActRapid; Novo Nordisk). To minimize changes in glucose specific activity, the continuous infusion of [3-3H]glucose was increased to 0.1 μCi/min and maintained throughout the procedure. Blood glucose was measured every 5 minutes, and 30% dextrose (3 g of D(+)-glucose in 10 mL of saline; Merck) was infused at variable rates to maintain euglycemia (∼6.5–7.5 mmol/L). Blood samples (10 μL) were taken every 10 minutes from t = 90–120 minutes to determine glucose-specific activity. At the end of the procedure, plasma insulin was determined from samples obtained from cardiac puncture.
Blood samples were deproteinized with barium hydroxide and zinc sulfate, and radioactivity was assessed in the supernatant. The rate of glucose appearance (endogenous glucose production) and disappearance (Rd) were calculated using isotopic steady-state equations of Steele (28). Endogenous glucose production was calculated by subtracting the glucose infusion rate (GIR) from whole body Rd. The insulin-stimulated component of the Rd is equal to clamp Rd minus the basal glucose turnover rate (29).
Statistical analyses
All values are expressed as mean ± SEM. Data were analyzed by two-way ANOVA for changes in body weight, fat tissue, lean mass, BMD, BMC, visceral fat, the ratio visceral fat/sc fat content, blood glucose levels during GTT, plasma T, E2, NGF, and insulin concentrations over time followed by Bonferroni's multiple comparisons. Two-way ANOVA was used to assess GIR-response curve over a 2-hour clamp period basal, hyperinsulinemic, and whole body Rd. Area under the curve (AUC) was calculated by trapezoid analysis and was compared by Student's t test for iBAT temperature, LA, 0- to 120-minute blood glucose levels during GTT, and GIR-response curve over a 2-hour hyperinsulinemic-euglycemic clamp period. Group mean differences were assessed using Student's unpaired t test for GIR, hepatic glucose production (HGP), HGP suppression, BMD (femur), BMD (vertebrae), LH/FSH, and UCP1 expression. Data were checked for normality using D'Agostino and Pearson tests. The relationship between T levels with the AUC of iBAT temperature was analyzed with a Spearman rank test. P < .05 was considered statistically significant. Analyses were performed using statistical software (GraphPad Prism 4.0; GraphPad Software, Inc).
Results
Overproduction of NGF in the ovary causes reproductive abnormalities and results in circulating sex steroid levels similar to those seen in PCOS women
17 NF mice exhibited prolonged estrous cycles (6.8 ± 0.6 vs 3.6 ± 0.1 d, P < .001) with an increase in the number of days spent in estrus and a reduction in the number of days spent in diestrus (Figure 1A), which is in agreement with our previous publication (23). Because we previously found that peripubertal 17NF mice have an increased ovarian steroid response to pregnant mare serum gonadotropin stimulation (23), it was of interest to investigate whether sex steroid levels were altered in unstimulated conditions in young adult 17NF mice. As indicated before, we performed this analysis in plasma samples obtained from mice in the estrous phase of the estrous cycle. We found that 17NF mice had increased T and E2 levels at 10 weeks of age compared with WT mice, and this increase was maintained at 20 weeks of age (Figure 1, B and C). We also found that gonadotropins were similar in WT and 17NF mice (LH, 0.47 ± 0.16 vs 0.16 ± 0.04 ng/mL, P = not significant; and FSH, 3.99 ± 0.54 vs 2.98 ± 1.09 ng/mL, P = not significant)
Figure 1.

17NF transgenic mice overexpressing NGF in the ovary exhibit disrupted estrous cyclicity, increased plasma T, and E2 levels and increased plasma NGF levels during the normal estrous cycle. A, Estrous cycle illustrated as the percentage of days spent in estrus or diestrus in WT (open bar; n = 31) and 17NF (closed bar; n = 25) mice. If a mouse showed a normal 4-day cycle, it would spend 50% of the time in estrus and 50% of the time in diestrus (dotted horizontal line marks 50%). Vaginal lavages were collected from the first day of vaginal opening for 14 consecutive days. Mice were assigned an estrous cycle stage each day after evaluation of relative proportion of cells present in the vaginal smears. B, Plasma T concentrations in WT (open bar; n = 7) and 17NF (closed bar; n = 10–14) mice at 10 and 20 weeks of age during estrus. C, Plasma E2 concentrations in WT (open bar; n = 16) and 17NF (closed bar; n = 10–12) mice at 10 and 20 weeks of age during estrus. D, NGF plasma concentrations in WT (open bar; n = 15 at 10 wk; n = 17 at 20 wk) and 17NF (closed bar; n = 12 at 10 wk; n = 17 at 20 wk) mice at 10 and 20 weeks of age during estrus. Results are presented as mean ± SEM. *, P < .05; **, P < .01; ***, P < .001 vs WT mice.
Because 17NF mice have increased ovarian production of NGF (23), we wanted to determine whether there was also an increase in plasma concentrations of NGF. We found there was a tendency towards increased plasma NGF levels in 17NF mice at 10 weeks of age, which became significant by 20 weeks of age (Figure 1D).
Overexpression of NGF in the ovary results in increased body weight, body fat, and visceral fat.
To investigate whether ovarian overproduction of NGF can result in metabolic changes similar to those seen in PCOS women, we measured body weight and body composition in 17NF and WT mice. Beginning at 5 weeks of age, 17NF mice had increased body weight compared with WT mice, which persisted until at least 20 weeks of age, the last age studied (Figure 2A). The gain in body weight occurred independently of food intake and body length, because both were similar in 17NF and WT mice (Figure 2, B and C). Also, at 10 weeks of age, 17NF mice had increased total fat mass, which was maintained at 20 weeks of age (Figure 2D). To investigate whether there is an alteration in the distribution of body fat in 17NF mice, abdominal and visceral fat mass was estimated from DEXA scans using a method that we have validated previously (24). The visceral fat to nonvisceral fat ratio was calculated as an index of visceral fat to sc fat distribution. We found that 17NF mice had increased visceral fat mass and increased ratio of visceral fat to nonvisceral fat compared with WT mice by 10 weeks of age (Figure 2, E and F). This pattern of fat distribution was maintained at 20 weeks of age. Interestingly, 17NF mice also had greater lean mass than WT mice (Figure 2G). These results show that overproduction of ovarian NGF results in increased body weight and visceral fat accumulation that is independent of food intake.
Figure 2.

Overexpression of NGF in the ovary of 17NF mice leads to increased body weight, body fat, visceral fat, and lean mass. A, Body weight in WT (open bar; n = 52 at 3–10 wk; n = 28 at 15–20 wk) and 17NF (closed bar; n = 52 at 3–10 wk; n = 26 at 15–20 wk) mice. B, Daily food intake in WT (open bar; n = 15) and 17NF (closed bar; n = 12) mice at 10 weeks of age. C, Body length in WT (open bar; n = 21 at 10 wk; n = 8 at 15–20ks) and 17NF (closed bar; n = 26 at 10 wk; n = 11 at 15–20 wk) mice. D–G, Body composition measured by DEXA in WT (open bar; n = 52 at 10 wk; n = 20 at 15–20 wk) and 17NF (closed bar; n = 52 at 10 wk; n = 26 at 15–20 wk) mice. Total body fat (D), visceral fat mass (E), ratio of visceral to nonvisceral fat (F), and total lean mass (G). Results are presented as mean ± SEM. *, P < .05; **, P < .01; ***, P < .001 vs WT mice.
Ovarian overproduction of NGF causes increased BMD and BMC
Because hyperandrogenism has been linked to increases in BMD and BMC (30, 31), we analyzed these parameters in 17NF and WT mice using DEXA scan. We found that 17NF mice had increased BMC and BMD than WT mice at 5 weeks of age, and this was maintained for the duration of the study, ie, 20 weeks of age (Figure 3, A and B). To determine whether there was a differential effect on BMD in cortical and trabecular bone, we measured the BMD of the femoral shaft and the vertebrae (L3–L5), respectively. We found that BMD was only increased in the femoral shaft of 17NF mice compared with WT mice and that there was no difference in BMD in the vertebrae (Figure 3, C and D). Thus, increased total BMD was caused by increased cortical but not trabecular BMD.
Figure 3.

Ovarian overproduction of NGF in transgenic 17NF mice results in increased cortical BMD. A, Total BMC and B, Total BMD in WT (open bar; n = 45–52 at 5–10 wk; n = 20 at 15–20 wk) and 17NF (closed bar; n = 52 at 5–10 wk; n = 27–36 at 15–20 wk) mice. C, BMD of the femoral shaft as a measure of cortical BMD and D, BMD of the lumbar vertebrae (L3–L5) as a measure of trabecular BMD in WT (open bar; n = 38) and 17NF (closed bar; n = 42) mice at 10 weeks of age. Results are presented as mean ± SEM. **, P < .01; ***, P < .001 vs WT mice.
Ovarian over production of NGF leads to systemic sympathetic hyperactivity
Because we have previously established that 17NF mice display increased extrinsic sympathetic input to the ovary (23), we wanted to determine whether overexpression of NGF localized to the ovary is capable of altering sympathetic outflow systemically. An indirect measurement of sympathetic outflow in rodents can be achieved via the measurement of iBAT thermogenesis, which is almost exclusively controlled by sympathetic nervous system innervation (27). We found that 17NF mice had increased iBAT temperature compared with WT mice at 10 and 20 weeks of age during the dark period (7 pm to 7 am) (Figure 4, A–D). LA was similar between 17NF and WT mice throughout the 24-hour period at 10 weeks (Figure 4E) and 20 weeks of age (data not shown).
Figure 4.

Overexpression of NGF in the ovary of transgenic 17NF mice leads to systemic sympathetic hyperactivity. A and C, iBAT temperature during 24 hours at 10 and 20 weeks of age, respectively, in WT (gray line; n = 14 at 10 wk; n = 10 at 20 wk) and 17NF (black line; n = 9 at 10 wk; n = 10 at 20 wk) mice. Boxed area represents the dark period. B and D, AUC of iBAT temperature during the dark period at 10 and 20 weeks of age, respectively, in WT (open bar) and 17NF (closed bar) mice. E, LA during 24 hours at 10 weeks of age in WT (gray line; n = 40) and 17NF (black line; n = 28) mice. Boxed area represents the dark period. F, Food intake measured during different time intervals of a 24-hour period in WT (open bar; n = 15) and 17NF (closed bar; n = 12) mice at 10 weeks of age. G, Correlation between T levels and AUC of iBAT temperature during the dark period in WT and 17NF mice together (n = 14) at 10 weeks of age. H, Western blot analysis of UCP1 expression in tissue extracts from iBAT of WT and 17NF mice at 10 weeks of age. Ten micrograms of protein were loaded in each lane and blotted with UCP1 antibody followed by α/β-tubulin antibody. I, Quantification of the UCP1 Western blotting as a ratio of α/β-tubulin (housekeeping) in WT (open bar; n = 6) and 17NF (closed bar; n = 7) mice. Results are presented as mean ± SEM. *, P < .05; **, P < .01 vs WT mice.
Because feeding can produce a thermogenic effect (32), we measured food intake at multiple time points throughout a 24-hour period and found that food intake was similar in 17NF mice and WT mice at all time points (Figure 4F). Therefore, the increase in iBAT temperature observed during the dark period was independent of food intake. Interestingly, there was a positive correlation between T levels and the AUC of iBAT temperature during the dark period (Figure 4G). Furthermore, an additional marker of iBAT thermogenesis, UCP1 protein expression, was increased in 17NF mice compared with WT mice at 10 weeks of age (Figure 4, H and I). These results suggest that ovarian overproduction of NGF not only causes sympathetic hyperinnervation of the ovary but also results in systemic sympathetic hyperactivity.
Overproduction of ovarian NGF leads to IR
To investigate whether alterations in body composition and sympathetic hyperactivity in 17NF mice had adverse effects on glucose homeostasis, an IPGTT was performed, and basal plasma insulin levels were measured in 17NF and WT mice. We found that 17NF mice exhibited glucose intolerance at 10 weeks of age compared with WT mice as assessed by significant increases in blood glucose levels compared with WT mice (Figure 5A) and a significant increase in the 0- to 120-minute AUC value (Figure 5B). To ensure that this was not a temporary alteration, we performed an IPGTT again at 20 weeks and found that impaired glucose tolerance was maintained (Figure 5, C and D). Additionally, 17NF mice exhibited increased basal plasma insulin levels at both 10 and 20 weeks of age (Figure 5E). Because 17NF mice had increased body weight than WT mice at the same age, we examined body weight-matched mice (22.7 ± 0.4 vs 22.9 ± 0.2 g) to determine whether body weight influenced glucose tolerance. We found that glucose intolerance remained to be greater in 17NF mice compared with WT mice (Figure 5F). Therefore, impaired glucose tolerance in 17NF mice occurred independently of body weight.
Figure 5.

17NF transgenic mice overexpressing NGF in the ovary exhibit glucose intolerance and hyperinsulinemia. A and C, Glucose levels during IPGTT at 10 and 20 weeks of age, respectively, in WT (open circle with dotted line; n = 39 at 10 wk; n = 13 at 20 wk) and 17NF (closed circle with solid line; n = 43 at 10 wk; n = 16 at 20 wk) mice. B and D, AUC of IPGTT in WT (open bar) and 17NF (closed bar) at 10 and 20 weeks of age, respectively. E, Basal plasma insulin levels at 10 and 20 weeks of age in WT (open bar; n = 9 at 10 wk; n = 16 at 20 wk) and 17NF (closed bar; n = 9 at 10 wk; n = 16 at 20 wk) mice. F, IPGTT in weight-matched WT (open circle, dotted line; n = 26) and 17NF (closed circle, solid line; n = 28) mice (body weight, 22.76 ± 0.4 vs 22.98 ± 0.2 g) at 10 weeks of age. Results are presented as mean ± SEM. *, P < .05; **, P < .01; ***, P < .001 vs WT mice.
To determine whether glucose intolerance and hyperinsulinemia was a result of a state of IR, we performed a hyperinsulinemic-euglycemic clamp in WT and 17NF mice. To avoid confounding effects of body weight, we analyzed body weight-matched mice only. We found that 17NF mice required a significantly lower GIR during a 2-hour clamp (Figure 6, A and B). This was primarily due to decreased peripheral insulin sensitivity, because 17NF mice displayed lower glucose disposal rate in the presence of insulin (Figure 6C). This is consistent with our glucose tolerance data and suggests an insulin resistant phenotype in these mice. In contrast, we did not observe any differences in the suppression of hepatic glucose production (Figure 6D), indicating that hepatic insulin action was preserved in 17NF mice. Thus, overexpression of ovarian NGF results in a defect in insulin sensitivity primarily in skeletal muscle and not the liver.
Figure 6.

Overexpression of NGF in the ovary of transgenic 17NF mice leads to IR. A, GIR-response curve during a 2-hour hyperinsulinemic-euglycemic clamp in WT (open square; n = 7) and 17NF (closed circle; n = 8) mice at 10 weeks of age. B, Average GIR during the last 20 minutes of the hyperinsulinemic-euglycemic clamp in WT (open bar; n = 7) and 17NF (closed bar; n = 8) mice. C, Glucose disposal rate in WT (open bar; n = 7) and 17NF (closed bar; n = 8) mice. D, Percentage of hepatic glucose production suppression during the clamp in WT (open bar; n = 7) and 17NF (closed bar; n = 8) mice. Results are presented as mean ± SEM. *, P < .05; **, P < .01 vs WT mice.
Discussion
Here, we show that in addition to affecting reproductive competence, excess ovarian production of NGF in mice results in metabolic abnormalities, including hyperinsulinemia, increased body weight, body fat and visceral fat, glucose intolerance, IR, and increased lean mass and BMD, all of which are commonly observed in PCOS women (3, 7, 33).
NGF plays a trophic role in the central and peripheral nervous systems as well as in nonneuronal tissues, including the endocrine and immune systems (34). It would be therefore expected that circulating NGF levels are determined by the relative contribution of several peripheral tissues that, targeted by the sympathetic innervation, produce NGF to maintain the density of this innervation. Our results show that plasma NGF levels were higher in 17NF mice at 10 weeks of age and became statistically significant by 20 weeks of age. It is possible that this increase is initially due to enhanced release of excessive NGF from the ovary into the blood stream. Subsequently, additional sources of NGF may contribute to the increase. A major source may be provided by adipocytes, because NGF is directly secreted from both murine and human adipocytes (35, 36) and increased plasma NGF in obese women correlated with percentage body fat and waist circumference (37).
Hyperandrogenism is considered a fundamental characteristic and a diagnostic criterion of PCOS. We have previously demonstrated that ovarian overproduction of NGF in peripubertal 17NF mice (28–30 d of age) induces increased release of 17-hydroxyprogesterone, T, and E2 compared with WT mice in response to pregnant mare serum gonadotropin stimulation. The current study shows that adult 17NF mice at 10 and 20 weeks of age exhibited elevated circulating T and E2 levels, evaluated during the estrous phase of the cycle. Because 17NF mice have delayed puberty and normal LH and FSH levels, the increased levels of these steroids cannot be attributed to gonadotropin stimulation of the ovary. Instead, a more likely explanation is that increased NGF concentrations directly stimulated thecal cells to produce androgens (20), which were then converted into E2 by granulosa cells. Other factors that may have contributed to maintaining elevated levels of T and E2 are ovarian sympathetic hyperactivity and hyperinsulinemia, both of which are observed in 17NF mice and have independently been shown to facilitate androgen excess in PCOS (38–40). Additionally, increased visceral adiposity in 17NF mice also may have influenced circulating sex steroid levels, because adipose tissue produces and metabolizes sex steroids (41) and secretes adipokines and cytokines, such as leptin, TNF-α, and IL-6, that are known to influence ovarian steroidogenesis (42, 43).
An estimated 40%–60% of PCOS women are overweight or obese (44). Likewise, we found that body weight was consistently increased in 17NF mice from 5 to 20 weeks of age due to increases in both lean mass and fat mass. However, metabolic diseases have a stronger association with body fat distribution than the amount of body fat per se. In contrast to sc adipose tissue, visceral adipose tissue is strongly associated with metabolic disturbances and cardiovascular diseases, including diabetes mellitus, dyslipidemia, and hypertension. We found that excess production of ovarian NGF induced preferential accumulation of adipose tissue in the visceral depot of 17NF mice. Likewise, women with PCOS have increased visceral fat accumulation, independent of obesity (2, 45, 46). This could be due to hyperandrogenemia, because abdominal obesity in women has been found to be associated with elevated plasma T levels (47). Importantly, increased visceral fat could be responsible for glucose intolerance and hyperinsulinemia, which in turn could increase steroidogenesis in the ovary resulting in a vicious cycle.
In addition to increased central adiposity, women with PCOS are reported to have increased lean body mass (48, 49). Likewise, 17NF mice had increased lean mass compared with WT mice from 5 to 15 weeks of age. Similar to the effect on visceral fat mass, this finding might reflect the actions of hyperandrogenemia and/or hyperinsulinemia, because previous studies have found both to be related to increases in lean mass (49, 50). We also found that 17NF mice exhibited increased BMC and BMD. Conflicting results have been reported regarding BMD in PCOS women. However, most studies tend to show normal to increased BMD in PCOS women (49, 51, 52). Both increased T and E2 levels could result in enhanced bone density (53). In line with this, previous studies in PCOS found sex steroids positively correlated with BMD (54). Furthermore, insulin may inhibit bone turnover, and a positive correlation has been demonstrated between insulin and BMD in PCOS, independent of BMI (33). Therefore, increased BMD observed in 17NF mice could be due to hyperestrogenemia, hyperandrogenemia, hyperinsulinemia, or a combination of all these factors. Because these entities may have differential effects on cortical BMD and trabecular BMD, we measured the BMD of the femoral shaft in 17NF mice as an estimate of cortical BMD and the BMD of vertebrae L3–L5 as an estimate of trabecular BMD. We found that 17NF mice had increased cortical BMD than WT mice, whereas trabecular BMD was unaffected. This is similar to findings in PCOS women where peripheral quantitative computed tomography revealed increased cortical bone density in the distal tibia of PCOS women compared with control women (55).
Overproduction of ovarian NGF also induced glucose intolerance, hyperinsulinemia, and IR independently of body weight in 17NF mice. These results are in support of the hypothesis that a unique intrinsic-related IR exists in PCOS independently of obesity where lean PCOS women have greater IR and glucose intolerance than lean controls (6, 56–58). However, fat excess in particular body regions may be linked to IR independently of the total quantity of body fat, whereby central adiposity has been found to be an independent predictor of defects in glucose homeostasis (46, 59–61). 17NF mice exhibited increased visceral fat mass compared with WT mice, despite no difference in total percentage fat between them. Thus, it cannot be excluded that increased visceral fat mass contributed to their IR and hyperinsulinemia. This is in accordance with PCOS studies showing that lean women with PCOS display increased central adiposity compared with BMI-matched controls in addition to decreases in glucose disposal rate and insulin sensitivity index (62). Hyperandrogenemia has also been proposed to contribute to IR through the direct effects of androgens on skeletal muscle and adipose tissue insulin action (63, 64), as well as indirectly by favoring visceral fat accumulation (47). Because 17NF mice also exhibited increased plasma T levels, it is possible that hyperandrogenemia also contributed to IR in these mice. Additionally, we found that hepatic insulin action was preserved in 17NF mice. Interestingly, this is similar to what is seen in PCOS women, whereby lean PCOS women have decreased insulin-mediated glucose disposal compared with lean controls, yet suppression of HGP is maintained (65, 66).
In addition to increased ovarian sympathetic outflow, women with PCOS also display a generalized increase in sympathetic nerve activity. Increases in indirect markers of sympathetic activity, including alterations in HRV components (12–14) and plasma and urinary catecholamine/catecholamine metabolite levels (11), suggest augmented sympathetic outflow in PCOS women. Moreover, Sverrisdóttir et al (15) found significantly increased MSNA in lean PCOS women compared with age-BMI-matched control women. We have previously demonstrated that 17NF mice exhibit an increase in sympathetic nerve fibers to the ovary, as evidenced by a marked increase in ovarian tyrosine hydroxylase content (23). In the present study, we showed that 17NF mice displayed increased iBAT thermogenesis, a marker of central sympathetic outflow, suggesting that sympathetic hyperactivity is not only localized to the ovary in 17NF mice but also occurs systemically. This could be due to increased plasma T, because we found a direct association between T levels and iBAT temperature. Our results are in agreement with Sverrisdóttir et al (15), which showed that plasma T was an independent predictor of increased MSNA in PCOS women.
Altogether, our findings demonstrate that overproduction of NGF in the ovary induces not only reproductive but also metabolic features of PCOS, including increased visceral fat and lean mass, in addition to hyperinsulinemia and IR. A possible mechanism behind these alterations is that overproduction of NGF in the ovary not only increases ovarian sympathetic innervation and androgen production but also leads to enhanced sympathetic outflow to several tissues. The mechanisms underlying this alteration have not been elucidated, but we speculate that they may result from the ovary-directed activation of at least 2 different mechanisms. One is hormonal and is provided by T itself, which as indicated above may be directly affecting adipose tissue function and/or the activity of target cells (eg, muscle) to insulin (15). The other mechanism may involve 2 different, but not necessarily exclusive, neuronal circuitries. The ovary receives sympathetic innervation from neuronal cell bodies located in the celiac and mesenteric ganglia (67), which arise from preganglionic axons originating in T5-L3 spinal levels. Sympathetic nervous system innervation of visceral adipose tissue in rodents appears to also arise from neurons at the T5-L3 spinal levels with most innervation arising from T13-L1 (67). These neurons also innervate other abdominal organs, including the pancreas, kidney, and liver. In addition, they appear to be connected to hypothalamic neurons via a multisynaptic relay system that originates at least in part in the paraventricular nucleus of the hypothalamus (68). It is therefore possible that once the trophic effect of NGF on the ovarian sympathetic innervation is detected by neuronal cell bodies of the celiac and mesenteric ganglia, the increased activity of these neurons is directly conveyed to the adipocytes and/or pancreatic β-cells that they innervate and/or to the hypothalamus. These neurons, which form part of central command neurons regulating sympathetic outflow (69), would then increase the sympathetic outflow to peripheral tissues involved in metabolic regulation.
A combination of these abnormalities (increased sympathetic outflow, increased circulating NGF levels, and hyperandrogenemia) may favor visceral fat deposition, which in turn may induce IR and hyperinsulinemia. This could then further increase peripheral and central sympathetic activity, perpetuating a vicious cycle (Figure 7). Increased sympathetic activity may not only have detrimental consequences on glucose homeostasis but also on the cardiovascular and renal systems (68), resulting in hypertension and heart disease. Overall, the current findings implicate sympathetic hyperactivity as a pathological factor in the development and progression of PCOS.
Figure 7.
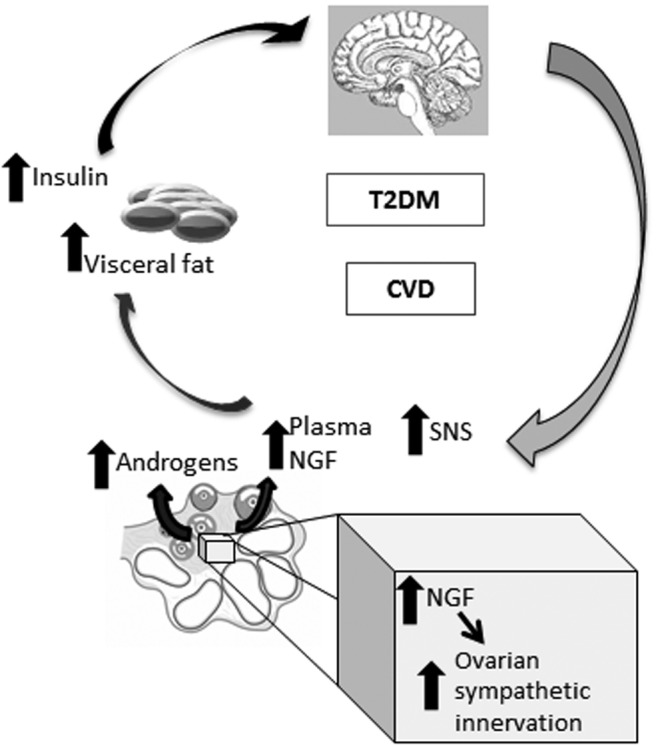
Proposed mechanism. Chronic increased production of NGF in the ovary increases ovarian sympathetic innervation and androgen production. This hyperandrogenemia and/or increased NGF will then 1) increase visceral fat deposition, which in turn favors hyperinsulinemia and IR, and 2) IR, NGF, or androgens will increase central sympathetic hyperactivity. All of these alterations will perpetuate a vicious cycle and might trigger T2D and CVD.
Acknowledgments
This work was supported by grants from Veski, Monash University, and Pfizer Australia; the National Health and Medical Research Council of Australia Grant 606662; the National Heart Foundation of Australia Grant G 09M 4306; and National Institutes of Health Grants HD24870 and HD24870-ARRA (to S.R.O.) and 8P51OD011092 (to G.A.D. and S.R.O.).
Disclosure Summary: The authors have nothing to disclose.
Footnotes
- AUC
- area under the curve
- BMC
- bone mineral content
- BMD
- bone mineral density
- BMI
- body mass index
- CV%
- coefficient of variation
- DEXA
- dual-energy x-ray absorptiometry
- E2
- estradiol
- GIR
- glucose infusion rate
- GTT
- glucose tolerance test
- HGP
- hepatic glucose production
- HRV
- heart rate variability
- iBAT
- interscapular brown adipose tissue
- IPGTT
- intraperitoneal GTT
- IR
- insulin resistance
- LA
- locomotor activity
- MSNA
- muscle sympathetic nerve activity
- NGF
- nerve growth factor
- PCOS
- polycystic ovarian syndrome
- T
- testosterone
- TMB
- tetramethyl benzidine
- UCP1
- uncoupling protein 1
- WT
- wild type.
References
- 1. Asunción M, Calvo RM, San Millán JL, Sancho J, Avila S, Escobar-Morreale HF. A prospective study of the prevalence of the polycystic ovary syndrome in unselected Caucasian women from Spain. J Clin Endocrinol Metab. 2000;85(7):2434–2438. [DOI] [PubMed] [Google Scholar]
- 2. Azziz R, Woods KS, Reyna R, Key TJ, Knochenhauer ES, Yildiz BO. The prevalence and features of the polycystic ovary syndrome in an unselected population. J Clin Endocrinol Metab. 2004;89(6):2745–2749. [DOI] [PubMed] [Google Scholar]
- 3. Franks S. Polycystic ovary syndrome. Medicine (United Kingdom). 2013;41(10):553–556. [Google Scholar]
- 4. Carmina E, Lobo RA. Use of fasting blood to assess the prevalence of insulin resistance in women with polycystic ovary syndrome. Fertil Steril. 2004;82(3):661–665. [DOI] [PubMed] [Google Scholar]
- 5. DeUgarte CM, Bartolucci AA, Azziz R. Prevalence of insulin resistance in the polycystic ovary syndrome using the homeostasis model assessment. Fertil Steril. 2005;83(5):1454–1460. [DOI] [PubMed] [Google Scholar]
- 6. Stepto NK, Cassar S, Joham AE, et al. Women with polycystic ovary syndrome have intrinsic insulin resistance on euglycaemic-hyperinsulaemic clamp. Hum Reprod. 2013;28(3):777–784. [DOI] [PubMed] [Google Scholar]
- 7. Fauser BCJM, Tarlatzis BC, Rebar RW, et al. Consensus on women's health aspects of polycystic ovary syndrome (PCOS): the Amsterdam ESHRE/ASRM-Sponsored 3rd PCOS Consensus Workshop Group. Fertil Steril. 2012;97(1):28–38.e25. [DOI] [PubMed] [Google Scholar]
- 8. Lansdown A, Rees DA. The sympathetic nervous system in polycystic ovary syndrome: a novel therapeutic target? Clin Endocrinol. 2012;77(6):791–801. [DOI] [PubMed] [Google Scholar]
- 9. Alvarez GE, Beske SD, Ballard TP, Davy KP. Sympathetic neural activation in visceral obesity. Circulation. 2002;106(20):2533–2536. [DOI] [PubMed] [Google Scholar]
- 10. Rahmouni K, Morgan DA, Morgan GM, et al. Hypothalamic PI3K and MAPK differentially mediate regional sympathetic activation to insulin. J Clin Invest. 2004;114(5):652–658. [DOI] [PMC free article] [PubMed] [Google Scholar]
- 11. Garcia-Rudaz C, Armando I, Levin G, Escobar ME, Barontini M. Peripheral catecholamine alterations in adolescents with polycystic ovary syndrome. Clin Endocrinol (Oxf). 1998;49(2):221–228. [DOI] [PubMed] [Google Scholar]
- 12. Giallauria F, Palomba S, Manguso F, et al. Abnormal heart rate recovery after maximal cardiopulmonary exercise stress testing in young overweight women with polycystic ovary syndrome. Clin Endocrinol. 2008;68(1):88–93. [DOI] [PubMed] [Google Scholar]
- 13. Tekin G, Tekin A, Kiliçarslan EB, et al. Altered autonomic neural control of the cardiovascular system in patients with polycystic ovary syndrome. Int J Cardiol. 2008;130(1):49–55. [DOI] [PubMed] [Google Scholar]
- 14. Yildirir A, Aybar F, Kabakci G, Yarali H, Oto A. Heart rate variability in young women with polycystic ovary syndrome. Ann Noninvasive Electrocardiol. 2006;11(4):306–312. [DOI] [PMC free article] [PubMed] [Google Scholar]
- 15. Sverrisdóttir YB, Mogren T, Kataoka J, Janson PO, Stener-Victorin E. Is polycystic ovary syndrome associated with high sympathetic nerve activity and size at birth? Am J Physiol Endocrinol Metab. 2008;294:E576–E581. [DOI] [PubMed] [Google Scholar]
- 16. Heider U, Pedal I, Spanel-Borowski K. Increase in nerve fibers and loss of mast cells in polycystic and postmenopausal ovaries. Fertil Steril. 2001;75(6):1141–1147. [DOI] [PubMed] [Google Scholar]
- 17. Lara HE, Ferruz JL, Luza S, Bustamante DA, Borges Y, Ojeda SR. Activation of ovarian sympathetic nerves in polycystic ovary syndrome. Endocrinology. 1993;133(6):2690–2695. [DOI] [PubMed] [Google Scholar]
- 18. Lara HE, Dissen GA, Leyton V, et al. An increased intraovarian synthesis of nerve growth factor and its low affinity receptor is a principal component of steroid-induced polycystic ovary in the rat. Endocrinology. 2000;141(3):1059–1072. [DOI] [PubMed] [Google Scholar]
- 19. Dissen GA, Lara HE, Leyton V, et al. Intraovarian excess of nerve growth factor increases androgen secretion and disrupts estrous cyclicity in the rat. Endocrinology. 2000;141(3):1073–1082. [DOI] [PubMed] [Google Scholar]
- 20. Dissen GA, Parrott JA, Skinner MK, Hill DF, Costa ME, Ojeda SR. Direct Effects of Nerve Growth Factor on Thecal Cells from Antral Ovarian Follicles. Endocrinology. 2000;141:4736–4750. [DOI] [PubMed] [Google Scholar]
- 21. Hoyle GW, Graham RM, Finkelstein JB, Nguyen KP, Gozal D, Friedman M. Hyperinnervation of the airways in transgenic mice overexpressing nerve growth factor. Am J Respir Cell Mol Biol. 1998;18(2):149–157. [DOI] [PubMed] [Google Scholar]
- 22. Davis BM, Fundin BT, Albers KM, Goodness TP, Cronk KM, Rice FL. Overexpression of nerve growth factor in skin causes preferential increases among innervation to specific sensory targets. J Comp Neurol. 1997;387(4):489–506. [DOI] [PubMed] [Google Scholar]
- 23. Dissen GA, Garcia-Rudaz C, Paredes A, Mayer C, Mayerhofer A, Ojeda SR. Excessive ovarian production of nerve growth factor facilitates development of cystic ovarian morphology in mice and is a feature of polycystic ovarian syndrome in humans. Endocrinology. 2009;150(6):2906–2914. [DOI] [PMC free article] [PubMed] [Google Scholar]
- 24. Chen W, Wilson JL, Khaksari M, Cowley MA, Enriori PJ. Abdominal fat analyzed by DEXA scan reflects visceral body fat and improves the phenotype description and the assessment of metabolic risk in mice. Am J Physiol Endocrinol Metab. 2012;303(5):E635–E643. [DOI] [PMC free article] [PubMed] [Google Scholar]
- 25. Britt KL, Drummond AE, Cox VA, et al. An age-related ovarian phenotype in mice with targeted disruption of the Cyp 19 (aromatase) gene. Endocrinology. 2000;141(7):2614–2623. [DOI] [PubMed] [Google Scholar]
- 26. Moody S, Goh H, Bielanowicz A, Rippon P, Loveland KL, Itman C. Prepubertal mouse testis growth and maturation and androgen production are acutely sensitive to di-n-butyl phthalate. Endocrinology. 2013;154(9):3460–3475. [DOI] [PubMed] [Google Scholar]
- 27. Enriori PJ, Sinnayah P, Simonds SE, Garcia Rudaz C, Cowley MA. Leptin action in the dorsomedial hypothalamus increases sympathetic tone to brown adipose tissue in spite of systemic leptin resistance. J Neurosci. 2011;31(34):12189–12197. [DOI] [PMC free article] [PubMed] [Google Scholar]
- 28. Steele R, Wall JS, De Bodo RC, Altszuler N. Measurement of size and turnover rate of body glucose pool by the isotope dilution method. Am J Physiol. 1956;187(1):15–24. [DOI] [PubMed] [Google Scholar]
- 29. Matsuda M, DeFronzo RA. Insulin sensitivity indices obtained from oral glucose tolerance testing: comparison with the euglycemic insulin clamp. Diabetes Care. 1999;22(9):1462–1470. [DOI] [PubMed] [Google Scholar]
- 30. Di Carlo C, Shoham Z, MacDougall J, Patel A, Hall ML, Jacobs HS. Polycystic ovaries as a relative protective factor for bone mineral loss in young women with amenorrhea. Fertil Steril. 1992;57(2):314–319. [DOI] [PubMed] [Google Scholar]
- 31. Simberg N, Tiitinen A, Silfvast A, Viinikka L, Ylikorkala O. High bone density in hyperandrogenic women: effect of gonadotropin-releasing hormone agonist alone or in conjunction with estrogen-progestin replacement. J Clin Endocrinol Metab. 1996;81(2):646–651. [DOI] [PubMed] [Google Scholar]
- 32. Schwartz RS, Jaeger LF, Silberstein S, Veith RC. Sympathetic nervous system activity and the thermic effect of feeding in man. Int J Obes. 1987;11(2):141–149. [PubMed] [Google Scholar]
- 33. Yüksel O, Dökmetaş HS, Topcu S, Erselcan T, Sencan M. Relationship between bone mineral density and insulin resistance in polycystic ovary syndrome. J Bone Miner Metab. 2001;19(4):257–262. [DOI] [PubMed] [Google Scholar]
- 34. Fiore M, Chaldakov GN, Aloe L. Nerve growth factor as a signaling molecule for nerve cells and also for the neuroendocrine-immune systems. Rev Neurosci. 2009;20(2):133–145. [DOI] [PubMed] [Google Scholar]
- 35. De Nicola F, Pepe I, Agrusa A, et al. Body composition of individuals with polycystic ovary syndrome. Acta Medica Mediterranea. 2009;25(1):11–17. [Google Scholar]
- 36. Aydogdu A, Tasci I, Kucukerdonmez O, et al. Increase in subcutaneous adipose tissue and fat free mass in women with polycystic ovary syndrome is related to impaired insulin sensitivity. Gynecol Endocrinol. 2013;29(2):152–155. [DOI] [PubMed] [Google Scholar]
- 37. Bulló M, Peeraully MR, Trayhurn P, Folch J, Salas-Salvadó J. Circulating nerve growth factor levels in relation to obesity and the metabolic syndrome in women. Eur J Endocrinol. 2007;157(3):303–310. [DOI] [PubMed] [Google Scholar]
- 38. Luna SL, Neuman S, Aguilera J, Brown DI, Lara HE. In vivo β-adrenergic blockade by propranolol prevents isoproterenol-induced polycystic ovary in adult rats. Horm Metab Res. 2012;44(9):676–681. [DOI] [PubMed] [Google Scholar]
- 39. Barria A, Leyton V, Ojeda SR, Lara HE. Ovarian steroidal response to gonadotropins and β-adrenergic stimulation is enhanced in polycystic ovary syndrome: role of sympathetic innervation. Endocrinology. 1993;133(6):2696–2703. [DOI] [PubMed] [Google Scholar]
- 40. Nestler JE, Jakubowicz DJ, de Vargas AF, Brik C, Quintero N, Medina F. Insulin stimulates testosterone biosynthesis by human thecal cells from women with polycystic ovary syndrome by activating its own receptor and using inositolglycan mediators as the signal transduction system. J Clin Endocrinol Metab. 1998;83(6):2001–2005. [DOI] [PubMed] [Google Scholar]
- 41. Wake DJ, Strand M, Rask E, et al. Intra-adipose sex steroid metabolism and body fat distribution in idiopathic human obesity. Clin Endocrinol (Oxf). 2007;66(3):440–446. [DOI] [PubMed] [Google Scholar]
- 42. Duggal PS, Van Der Hoek KH, et al. The in vivo and in vitro effects of exogenous leptin on ovulation in the rat. Endocrinology. 2000;141(6):1971–1976. [DOI] [PubMed] [Google Scholar]
- 43. Roby KF, Terranova PF. Effects of tumor necrosis factor-α in vitro on steroidogenesis of healthy and atretic follicles of the rat: theca as a target. Endocrinology. 1990;126(5):2711–2718. [DOI] [PubMed] [Google Scholar]
- 44. Lim SS, Davies MJ, Norman RJ, Moran LJ. Overweight, obesity and central obesity in women with polycystic ovary syndrome: a systematic review and meta-analysis. Hum Reprod Update. 2012;18(6):618–637. [DOI] [PubMed] [Google Scholar]
- 45. Escobar-Morreale HF, San Millán JL. Abdominal adiposity and the polycystic ovary syndrome. Trends Endocrinol Metab. 2007;18(7):266–272. [DOI] [PubMed] [Google Scholar]
- 46. Carmina E, Bucchieri S, Esposito A, et al. Abdominal fat quantity and distribution in women with polycystic ovary syndrome and extent of its relation to insulin resistance. J Clin Endocrinol Metab. 2007;92(7):2500–2505. [DOI] [PubMed] [Google Scholar]
- 47. Evans DJ, Barth JH, Burke CW. Body fat topography in women with androgen excess. Int J Obes. 1988;12(2):157–162. [PubMed] [Google Scholar]
- 48. Comerford KB, Almario RU, Kim K, Karakas SE. Lean mass and insulin resistance in women with polycystic ovary syndrome. Metabolism. 2012;61(9):1256–1260. [DOI] [PubMed] [Google Scholar]
- 49. Carmina E, Guastella E, Longo RA, Rini GB, Lobo RA. Correlates of increased lean muscle mass in women with polycystic ovary syndrome. Eur J Endocrinol. 2009;161(4):583–589. [DOI] [PubMed] [Google Scholar]
- 50. Lebrasseur NK, Achenbach SJ, Melton LJ, 3rd, Amin S, Khosla S. Skeletal muscle mass is associated with bone geometry and microstructure and serum insulin-like growth factor binding protein-2 levels in adult women and men. J Bone Miner Res. 2012;27(10):2159–2169. [DOI] [PMC free article] [PubMed] [Google Scholar]
- 51. Berberoglu Z, Aktas A, Fidan Y, Yazici AC, Aral Y. Association of plasma GDF-9 or GDF-15 levels with bone parameters in polycystic ovary syndrome. J Bone Miner Metab. 2014;1–8. [DOI] [PubMed] [Google Scholar]
- 52. Noyan V, Yucel A, Sagsoz N. The association of bone mineral density with insulin resistance in patients with polycystic ovary syndrome. Eur J Obstet Gynecol Reprod Biol. 2004;115(2):200–205. [DOI] [PubMed] [Google Scholar]
- 53. Kuchuk NO, Van Schoor NM, Pluijm SMF, Smit JH, De Ronde W, Lips P. The association of sex hormone levels with quantitative ultrasound, bone mineral density, bone turnover and osteoporotic fractures in older men and women. Clin Endocrinol (Oxf). 2007;67(2):295–303. [DOI] [PubMed] [Google Scholar]
- 54. Glintborg D, Andersen M, Hagen C, Hermann AP. Higher bone mineral density in Caucasian, hirsute patients of reproductive age. Positive correlation of testosterone levels with bone mineral density in hirsutism. Clin Endocrinol. 2005;62(6):683–691. [DOI] [PubMed] [Google Scholar]
- 55. Kassanos D, Trakakis E, Baltas CS, et al. Augmentation of cortical bone mineral density in women with polycystic ovary syndrome: a peripheral quantitative computed tomography (pQCT) study. Hum Reprod. 2010;25(8):2107–2114. [DOI] [PubMed] [Google Scholar]
- 56. Flannery CA, Rackow B, Cong X, Duran E, Selen DJ, Burgert TS. Polycystic ovary syndrome in adolescence: impaired glucose tolerance occurs across the spectrum of BMI. Pediatr Diabetes. 2013;14(1):42–49. [DOI] [PMC free article] [PubMed] [Google Scholar]
- 57. Hudecova M, Holte J, Olovsson M, Larsson A, Berne C, Poromaa IS. Diabetes and impaired glucose tolerance in patients with polycystic ovary syndrome-a long term follow-up. Hum Reprod. 2011;26(6):1462–1468. [DOI] [PubMed] [Google Scholar]
- 58. Legro RS, Kunselman AR, Dodson WC, Dunaif A. Prevalence and predictors of risk for type 2 diabetes mellitus and impaired glucose tolerance in polycystic ovary syndrome: a prospective, controlled study in 254 affected women. J Clin Endocrinol Metab. 1999;84(1):165–169. [DOI] [PubMed] [Google Scholar]
- 59. Carey DG, Jenkins AB, Campbell LV, Freund J, Chisholm DJ. Abdominal fat and insulin resistance in normal and overweight women: direct measurements reveal a strong relationship in subjects at both low and high risk of NIDDM. Diabetes. 1996;45(5):633–638. [DOI] [PubMed] [Google Scholar]
- 60. Garg A. Regional adiposity and insulin resistance. J Clin Endocrinol Metab. 2004;89(9):4206–4210. [DOI] [PubMed] [Google Scholar]
- 61. Kirchhoff K, Kantartzis K, Machann J, et al. Impact of different fat depots on insulin sensitivity: predominant role of liver fat. J Diabetes Sci Technol. 2007;1(5):753–759. [DOI] [PMC free article] [PubMed] [Google Scholar]
- 62. Svendsen PF, Nilas L, Nørgaard K, Jensen JE, Madsbad S. Obesity, body composition and metabolic disturbances in polycystic ovary syndrome. Hum Reprod. 2008;23(9):2113–2121. [DOI] [PubMed] [Google Scholar]
- 63. Allemand MC, Irving BA, Asmann YW, et al. Effect of testosterone on insulin stimulated IRS1 ser phosphorylation in primary rat myotubes - a potential model for PCOS-related insulin resistance. PLoS One. 2009;4(1):e4274. [DOI] [PMC free article] [PubMed] [Google Scholar]
- 64. Corbould A. Chronic testosterone treatment induces selective insulin resistance in subcutaneous adipocytes of women. J Endocrinol. 2007;192(3):585–594. [DOI] [PubMed] [Google Scholar]
- 65. Dunaif A, Segal KR, Futterweit W, Dobrjansky A. Profound peripheral insulin resistance, independent of obesity, in polycystic ovary syndrome. Diabetes. 1989;38(9):1165–1174. [DOI] [PubMed] [Google Scholar]
- 66. Dunaif A, Segal KR, Shelley DR, Green G, Dobrjansky A, Licholai T. Evidence for distinctive and intrinsic defects in insulin action in polycystic ovary syndrome. Diabetes. 1992;41(10):1257–1266. [DOI] [PubMed] [Google Scholar]
- 67. Nguyen NLT, Randall J, Banfield BW, Bartness TJ. Central sympathetic innervations to visceral and subcutaneous white adipose tissue. Am J Physiol. 2014;306(6):R375–R386. [DOI] [PMC free article] [PubMed] [Google Scholar]
- 68. Dissen G, Ojeda S. Ovarian innervation. In: Knobil E, Neill JD, eds. Encyclopedia of Reproduction. Vol 3 San Diego, CA: Academic Press;1999:583–589. [Google Scholar]
- 69. Jansen AS, Nguyen XV, Karpitskiy V, Mettenleiter TC, Loewy AD. Central command neurons of the sympathetic nervous system: basis of the fight-or-flight response. Science. 1995;270(5236):644–646. [DOI] [PubMed] [Google Scholar]