

Abstract
Objective
Lacunar strokes are a leading cause of cognitive impairment and vascular dementia. However, adequate characterization of cognitive impairment is lacking. The aim of this study was to estimate the prevalence and characterize the neuropsychological impairment in lacunar stroke patients.
Methods
All English-speaking participants in the SPS3 trial (NCT: 00059306) underwent neuropsychological testing at baseline. Raw scores were converted to z-scores using published norms. Those with impairment (z≤-1.5) in memory and/or non-memory domains were classified as having Mild Cognitive Impairment (MCI).
Results
Among the 1636 participants, average z scores on all tests were below zero with the largest deficits seen on tests of episodic memory (range of means -0.65 to -0.92), verbal fluency (mean -0.89), and motor dexterity (mean -2.5). Forty-seven percent were classified as having MCI: 36% amnestic, 37% amnestic multidomain, 28% non-amnestic. Of those with Rankin score 0-1 and Barthel score=100, 41% had MCI. Younger age [odds ratio (OR) per 10-yr increase=0.87], male sex (OR 1.3), less education (OR 0.13-0.66 compared to 0-4 yrs education), post-stroke disability (OR 1.4), and impaired activities of daily living (OR 1.8) were independently associated with MCI.
Conclusions
In this large, well characterized cohort of lacunar stroke patients, MCI was present in nearly half, including many with minimal or no physical disabilities. Cognitive dysfunction in lacunar stroke patients may commonly be overlooked in clinical practice but may be as important as motor and sensory sequelae.
Keywords: Small subcortical stroke, lacunar stroke, Vascular cognitive impairment, Neuropsychological tests, Mild Cognitive Impairment
Introduction
Small subcortical strokes (S3), also known as lacunar strokes, are a leading cause of cognitive impairment and dementia1-3. Based on diagnostic criteria for subcortical vascular dementia4, efforts have been devoted to defining the neuropsychological profile of mild cognitive impairment (MCI) associated with subcortical vascular features5, but no general consensus based on adequate empirical data has been established yet2. A recent statement from the American Stroke Association emphasizes the complex nature of the neurocognitive patterns associated with these states6. Neuropsychological studies of lacunar stroke patients have reliably shown performance impairments but these have been challenging to integrate into the profile generally associated with subcortical ischemic disease, viz. impaired information processing speed, attention, working memory, executive, and motor function2. While some studies have described data consistent with such a profile7-9, others have reported equal or greater impairment in episodic memory and language10, 11.
In this study we aim to characterize the presence, pattern, and severity of cognitive impairment in a large, clinically well-described group of participants of the Secondary Prevention of Small Subcortical Strokes (SPS3) trial10. SPS3 is a randomized trial that enrolled patients with a recent small subcortical stroke (S3) in North America, Latin America, and Spain. The trial was aimed to define interventions to prevent stroke recurrence, cognitive decline and major vascular events in S3 patients. Here we report on the neuropsychological data collected at baseline for all English speaking participants randomized at US and Canadian sites.
Subjects and Methods
The study group included all SPS3 participants enrolled at any of the 58 US or Canadian clinical centers who received neuropsychological testing (NPT) in English, and who reported English as their preferred spoken language, or if two languages were spoken at home, reported English as spoken >50% of the time. Eligibility for SPS3 has been described in detail elsewhere10. Briefly, eligible participants had a recent symptomatic S3 confirmed by MRI and no evidence of cortical stroke, cardioembolic disease or amenable carotid stenosis. At study entry, between 2 weeks to 6 months after the qualifying stroke, NPT, Mini Mental State Examination (MMSE)12, Barthel Activities of Daily Living Index13, and modified Rankin Scale (m-Rankin)14 were administered. Patients with significant cognitive impairment (MMSE >= 2 SD below the mean for age and education, that is, an adjusted score ≤2415, generally accepted as the cutoff for mild dementia) or disability due to stroke (m-Rankin>4) were excluded. Utilizing clinical and MRI information, local investigators classified the location of the symptomatic S3 as anterior circulation (basal ganglia, internal capsule, corona radiata, or centrum semiovale), thalamus, or posterior circulation (midbrain, pons, medulla or cerebellum). Participants were randomized in a 2 × 2 factorial design to both an antiplatelet intervention (aspirin plus placebo vs. aspirin plus clopidogrel) and to target levels of systolic blood pressure. Recruitment was completed in April 2011. The SPS3 trial was approved by the institutional review boards of all participating centers, and all patients provided written informed consent.
The SPS3 NPT battery was selected to combine broad domain coverage with acceptable administration times. The Cognitive Assessment Screening Instrument (CASI), with a wider measurement range and more comprehensive coverage than the MMSE, was included for the assessment of global cognition16. NPT were included to assess episodic memory (California Verbal Learning Test [CVLT], short and long delay), visuo-construction (Block Design [BD]), processing speed (Symbol Search [SS]), motor dexterity (Grooved Pegboard [GP]), verbal fluency (Controlled Oral Word Association [COWA]), attention (Digit Span [DS]), and executive functioning (Clock Drawing to Command [Clox]) (online supplemental Table 2). Tests were administered by SPS3-certified examiners. SPS3 NPT examiner certification included reviewing written training materials, taking a 30-item knowledge test, watching and scoring a videotaped administration, and performing an audio-taped practice administration with a volunteer. These materials were then reviewed by a Coordinating Center (CC) neuropsychologist. SPS3 examiners were typically licensed clinical psychologists with neuropsychological expertise or technicians/students under their direct supervision. Each administration is audio-recorded and submitted to the CC along with a copy of the data form. The first two administrations performed by each examiner post-certification are reviewed by a CC neuropsychologist. Subsequently, at least two administrations are reviewed annually for each examiner and feedback given. Tests are locally scored with the exception of the Clox, which is scored centrally by one of the by CC neuropsychologists (RC) (online supplemental Table 1) (the correlation coefficient for intra-rater reliability on a random sample of 60 drawings was 0.94).
MCI was classified psychometrically on the basis of obtained NPT scores, in accordance with some of the recent American Heart Association/American Stroke Association (AHA/ASA) criteria for Probable Vascular MCI6. MCI was operationalized as a cutoff z-score≤ -1.5 in at least one test domain5, 17. Amnestic and non-amnestic MCI, and within the former, single and multiple domain impairment were distinguished18. Neuropsychological (NP) status was assigned as follows: NCI if no definite impairment was present in any cognitive domain; MCI single amnestic type (MCIa) if there was definite impairment on at least two memory test scores, with non-memory scores normal; MCI amnestic multidomain (MCImd) if there was definite impairment on at least two memory test scores, and definite impairment on at least two non-memory test scores among BD, SS, COWA, and DS, and/or definite impairment on the Clox test score; MCI non-amnestic (MCIna) if there was definite impairment on non-memory test scores only .
Statistical methods included conversion of raw NPT scores into standardized scores with reference to published normative data either by direct look-up19, by computation on the basis of normative means and standard deviations11, 20, 21,16 or by derivation from percentiles22. To separate the effect of upper extremity motor impairment on performance, data were reported separately for a subgroup of subjects defined as motor intact, i.e. subjects without incoordination, weakness or sensory deficits on upper extremity on neurological exam. Z-scores were compared with the m-Rankin and Barthel index scores for concurrent validation of results. The relationship between the performance on the CASI and NPT z-scores were explored with Pearson's correlation coefficient.
Participants were classified into NCI or MCI subtypes according to the described criteria, with scores considered normal if z > -1.5 and impaired if z ≤ -1.5. NPT domains were identified by exploratory principal component analysis (PCA) with varimax rotation on raw and standardized z-scores with entry of all neuropsychological test variables with the exception of the CASI and GP scores (global cognition and non-cognitive measures, respectively).
Distributions of test scores were tested for normality using Kolmogorov-Smirnov test and for a median different from 0 using the Wilcoxon signed rank test. Demographic, clinical, functional characteristics, and test scores were compared by neuropsychological status (NCI and MCI subtypes) using ANOVA and Chi-square tests. Multivariate relationships of neuropsychological status (MCI vs. NCI) with patient demographics, pre-stroke factors including vascular risk factors and prior S3, and stroke-related factors including, location of stroke, upper extremity motor/sensory loss or incoordination, Barthel Index and modified Rankin, and finally pre-stroke and stroke-related factors combined, were assessed with logistic regression models (likelihood ratio test). Statistical significance was accepted at the 0.01 level, and all tests were two-sided. Statistical analyses were done using SPSS 19.0 and MedCalc 12.1.0.
Results
A total of 3020 patients were randomized into SPS3. Of the 1960 participants randomized in the USA and Canada, 1636 of the 1663 (98%) English speaking had NPT and formed the study sample (Figure 1). The study group was younger, with fewer males, and more educated than Non-English speaking groups, with higher prevalence of hypertension and ischemic heart disease (Table 1). Median time from qualifying stroke to NPT for the study sample was 63 days with 47% tested between 6 weeks and 3 months from the S3. Half of the S3 were located in anterior circulation, and the rest in thalamus, brainstem and cerebellum. The proportions of right and left S3 were comparable. Eighty-five percent of the study sample scored at or above the 25th percentile adjusted for age and education on the MMSE and ≥95 on the Barthel index.
Figure 1. Patient flow chart.
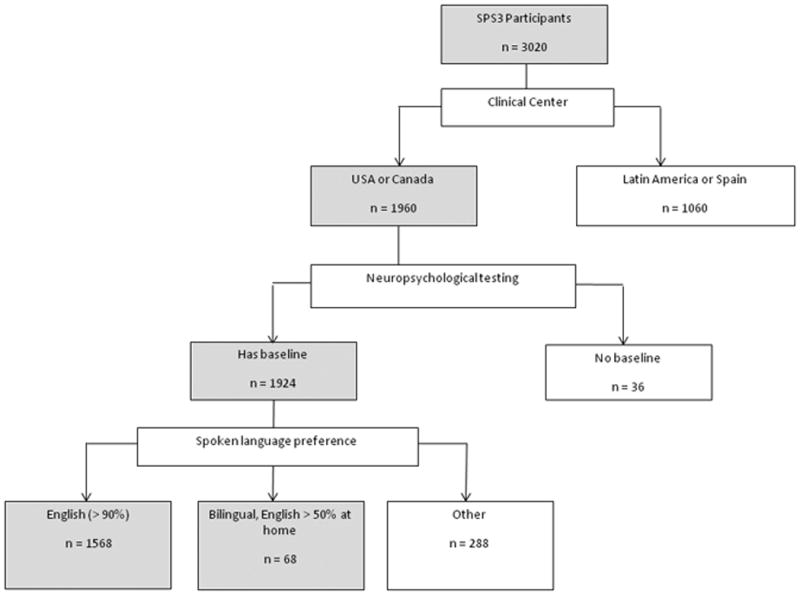
Table 1. Demographic and clinical characteristics of SPS3 participants.
| Overall | No Baseline Testing Done* | Has Baseline Testing | ||||
|---|---|---|---|---|---|---|
|
| ||||||
| USA and Canada: English Speaking | USA and Canada: Not English Speaking | Latin America and Spain | p-value | |||
|
| ||||||
| n | 3020 | 40 | 1636 | 288 | 1056 | |
|
| ||||||
| Age, mean (sd) | 63 (11) | 63 (13) | 62 (11) | 61 (10) | 65 (11) | < 0.001 |
|
| ||||||
| Male, % | 63 | 68 | 59 | 67 | 68 | < 0.001 |
|
| ||||||
| Education, % | < 0.001 | |||||
| 0-4 yrs | 11 | 5 | 2 | 14 | 23 | |
| 5-8 yrs | 16 | 18 | 5 | 22 | 30 | |
| 9-12 yrs | 38 | 43 | 40 | 36 | 36 | |
| any college | 36 | 35 | 53 | 29 | 11 | |
|
| ||||||
| Race/ethnicity, % | < 0.001 | |||||
| Hispanic | 30 | 13 | 7 | 38 | 65 | |
| White, not Hispanic | 51 | 68 | 63 | 39 | 34 | |
| Black | 16 | 10 | 28 | 12 | 0.4 | |
| Other or multiracial | 2 | 10 | 2 | 11 | 0 | |
|
| ||||||
| Medical history: | ||||||
| Diabetes, % | 37 | 25 | 36 | 42 | 37 | 0.1 |
| Hypertension, % | 75 | 73 | 79 | 72 | 70 | < 0.001 |
| Ischemic heart disease, % | 10 | 13 | 14 | 9 | 4 | < 0.001 |
| Symptomatic S3, % | 10 | 10 | 10 | 10 | 10 | 1.0 |
| Symptomatic subcortical TIA, % | 5 | 5 | 6 | 6 | 4 | 0.2 |
|
| ||||||
| Time from qualifying S3 to testing, % | n/a | < 0.001 | ||||
| < 6 weeks | 30 | 25 | 30 | 36 | ||
| 6 weeks - 3 mo | 41 | 47 | 40 | 32 | ||
| > 3 mo | 29 | 28 | 30 | 32 | ||
|
| ||||||
| Location of Qualifying S3, % | < 0.001 | |||||
| Anterior | 52 | 65 | 49 | 51 | 55 | |
| Thalamic | 22 | 20 | 26 | 22 | 17 | |
| Posterior | 26 | 15 | 25 | 26 | 28 | |
| Lateralization of Qualifying S3, % | 0.5 | |||||
| Right anterior or thalamic | 46 | 47 | 47 | 45 | 44 | |
| Left anterior or thalamic | 54 | 53 | 53 | 55 | 56 | |
|
| ||||||
| Modified Rankin stroke disability score, % | 0.002 | |||||
| 0 | 15 | 18 | 15 | 18 | 15 | |
| 1 | 51 | 50 | 52 | 54 | 50 | |
| 2 | 25 | 25 | 26 | 21 | 23 | |
| 3+ | 9 | 8 | 7 | 8 | 12 | |
|
| ||||||
| MMSE, raw score, median (IQR) | 29 (3) | 28 (3) | 29 (2) | 28 (4) | 28 (4) | < 0.001 |
|
| ||||||
| MMSE, age and education adjusted, % | < 0.001 | |||||
| below 25th percentile | 12 | 13 | 15 | 14 | 6 | |
| 25th to below 75th percentile | 40 | 48 | 37 | 43 | 42 | |
| at or above 75th percentile | 49 | 40 | 48 | 43 | 52 | |
|
| ||||||
| Barthel index score ≥ 95, % | 80 | 88 | 85 | 84 | 71 | < 0.001 |
Location of patients: 36 NA, 3 Spain, 1 LA
S3=Small subcortical stroke; MMSE=Mini Mental Status Exam
Neither raw test scores nor z-scores were distributed normally (all p < 0.001; Table 2). Distributions for the CASI, CVLT, and Clox were negatively skewed whereas those for the BD, COWA, and DS were positively skewed (data not shown). Performances on all tests were lower than expected for age, and where applicable, for education and gender, i.e. median z-scores were significantly below 0 (all p< 0.001). The largest deficits were seen on the CVLT, COWA, and GP. On the CVLT, short- and long-delay recall scores were equally impaired, with median z-scores=-1.0. Recognition memory was less affected (median z-score=0, mean z-score=-0.65). Verbal fluency on the COWA was similarly impaired, the median z-score=-0.96 (almost an SD below age- and education adjusted norms). GP performance was well below age- and sex-adjusted norms (median z-scores=-2.5). Tests of attention, visuo-construction and perceptual speed showed smaller deficits (median z-scores=-0.33). CASI and Clox performances reinforced this pattern, with median performances below the norms (-0.34 and -0.42, respectively).
Table 2. Raw and z- or standard scores for NA English speaking subjects.
| n | Raw score | Z-score | Normative data used | |||
|---|---|---|---|---|---|---|
|
|
|
|||||
| mean (sd) | median | mean (sd) | median | |||
|
| ||||||
| CASI | Norms for ages 65-95 by education (3-11 yrs vs. 12-21 yrs)16 | |||||
| All patients | 1633 | 90 (8) | 92 | -0.70 (1.6) | -0.34 | |
| Motor intact patients* | 661 | 91 (7) | 93 | -0.45 (1.4) | -0.12 | |
|
| ||||||
| CVLT | Raw scores converted to standard scores (-5 to 5) by age and sex19 | |||||
| All patients | ||||||
| Short delay free recall | 1627 | 7.6 (3.5) | 8 | -0.92 (1.4) | -1.0 | |
| Short delay cued recall | 1626 | 9.2 (3.3) | 9 | -0.83 (1.3) | -1.0 | |
| Long delay free recall | 1624 | 8.2 (3.6) | 8 | -0.83 (1.3) | -1.0 | |
| Long delay cued recall | 1624 | 9.2 (3.3) | 9 | -0.85 (1.4) | -1.0 | |
| Discriminability | 1620 | 89 (9) | 91 | -0.65 (1.2) | 0.0 | |
| Motor intact patients* | ||||||
| Short delay free recall | 658 | 7.8 (3.5) | 8 | -0.82 (1.4) | -1.0 | |
| Short delay cued recall | 658 | 9.3 (3.3) | 10 | -0.74 (1.3) | -1.0 | |
| Long delay free recall | 658 | 8.2 (3.5) | 8 | -0.78 (1.3) | -1.0 | |
| Long delay cued recall | 658 | 9.2 (3.3) | 9 | -0.78 (1.3) | -1.0 | |
| Discriminability | 658 | 89 (8) | 91 | -0.59 (1.2) | 0.0 | |
|
| ||||||
| Block Design | Raw scores converted to scaled scores then z-scores by country (US, Canada) and age20 | |||||
| All patients | 1614 | 28 (12) | 28 | -0.37 (1.1) | -0.33 | |
| Motor intact patients* | 651 | 30 (13) | 29 | -0.18 (1.1) | -0.33 | |
|
| ||||||
| Symbol Search | Raw scores converted to scaled scores then z-scores by country (US, Canada) and age20 | |||||
| All patients | 1592 | 21 (8) | 21 | -0.53 (1.0) | -0.33 | |
| Motor intact patients* | 650 | 22 (8) | 23 | -0.31 (1.0) | -0.33 | |
|
| ||||||
| Grooved Pegboard | Norms for ages 16-70 by sex11 | |||||
| All patients | ||||||
| dominant time (sec) | 1620 | 126 (67) | 103 | -4.9 (6.7) | -2.5 | |
| non-dominant time (sec) | 1617 | 139 (70) | 112 | -4.6 (5.8) | -2.5 | |
| Motor intact patients* | ||||||
| dominant time (sec) | 656 | 107 (48) | 93 | -2.9 (4.4) | -1.6 | |
| non-dominant time (sec) | 655 | 120 (54) | 102 | -3.0 (4.2) | -1.6 | |
|
| ||||||
| COWA total | Norms for ages 16-95 by education (0-8, 9-12, 13-21 yrs)22 | |||||
| All patients | 1625 | 30 (13) | 29 | -0.89 (1.0) | -0.96 | |
| Motor intact patients* | 658 | 31 (13) | 31 | -0.76 (1.0) | -0.79 | |
|
| ||||||
| Digit Span total | Raw scores converted to scaled scores then z-scores by country (US, Canada) and age20 | |||||
| All patients | 1628 | 15 (4) | 14 | -0.27 (0.89) | -0.33 | |
| Motor intact patients* | 658 | 15 (4) | 15 | -0.18 (0.89) | -0.33 | |
|
| ||||||
| Clox Draw to Command | Norms are for young adults and independent living retirees21 | |||||
| All patients | 1622 | 11.4 (2.4) | 12 | -0.64 (1.2) | -0.42 | |
| Motor intact patients* | 659 | 11.5 (2.4) | 12 | -0.56 (1.2) | -0.13 | |
663 patients without upper extremity weakness or sensory loss, or incoordination on neurological exam.
CASI=Cognitive Assessment Screening Instrument; CVLT=California Verbal Learning Test; COWA=Controlled Oral Word Association
Impaired coordination and/or upper extremity function accounted for a portion of these deficits. Median z-scores on all tests except the CVLT and Clox were significantly lower (all p < 0.01) for compromised patients. Patients with intact motor function in upper extremities performed better than those with affected function on the CASI, BD, SS, GP, and Clox tests, but not importantly so on the the motor-neutral CVLT, COWA and DS.
CASI scores were significantly correlated with performance on each of the other tests. Correlation coefficients between 0.47 and 0.59 were observed between CASI z-scores and z-scores for the CVLT, BD, SS, COWA, and DS. Correlation coefficients for the CASI with GP and Clox were lower (range 0.31 to 0.34). Correlation coefficients were comparable when only motor intact participants were included.
Higher education (any college vs. 9-12 yrs vs. 5-8 yrs vs. 0-4 yrs) was significantly associated (all p < 0.001) with higher z-scores, regardless of whether norms were adjusted for education (CASI, COWA) or not (data not shown). When participants with 0-4 yrs (n = 32) and 5-8 yrs (n = 83) of education were excluded from this analysis, those with any college averaged higher z-scores when compared to those with 9-12 yrs education (all p ≤ 0.002 except the CASI, with p = 0.02). When only motor intact participants with at least 9-12 yrs or any college education were analyzed, those with any college averaged higher z-scores (all p ≤ 0.006) for all except the CASI (p = 0.2) and GP (p ≥ 0.03).
Higher m-Rankin scores and lower Barthel index scores were associated with increasing cognitive impairment (online supplemental Table 3). Of note, among participants with m-Rankin ratings of 0, there were still substantial performance impairments on CVLT, COWA, Clox and GP. Participants with a Barthel index score below 95 had significantly lower z-scores for all tests except the COWA (p = 0.04) and the Clox (p = 0.4).
PCA, with specification of three factors, accounted for 73% of the variance (online supplemental Table 4). The first factor included episodic memory measures (CVLT), the second measures of perceptual and verbal processing speed (BD, SS, COWA, DS), and the third the Clox, which measures aspects of executive functioning. Based on these results, criteria for classification of NP status were refined: memory domain impairment=definite impairment (z≤-1.5) on at least two CVLT measures; perceptual-verbal processing speed domain impairment=definite impairment (z≤ -1.5) on at least two tests among BD, SS, COWA and DS; executive functioning domain impairment=definite impairment (z≤-1.5) on the Clox. NCI classification was assigned if there was no domain impairment; MCIa if there was only memory domain impairment; MCImd if, in addition to memory, there was perceptual-verbal processing speed and/or executive functioning domain impairment; MCIna if there was only perceptual-verbal processing speed and/or executive functioning domain impairment. Fifty-three percent of participants were classified as NCI and 47% met criteria for MCI, with roughly equal numbers for MCIa, MCImd and MCIna (Table 3).
Table 3. Characteristics of subjects by cognitive impairment status*.
| NCI | MCI amnestic | MCI amnestic multi-domain | MCI non-amnestic | p-value | |
|---|---|---|---|---|---|
|
| |||||
| n (%) | 861 (53) | 270 (17) | 278 (17) | 211 (13) | |
|
| |||||
| Age, mean (sd) | 62 (10) | 61 (12) | 61 (11) | 61 (10) | 0.07 |
|
| |||||
| Male, % | 56 | 61 | 58 | 67 | 0.04 |
|
| |||||
| Education, % | < 0.001 | ||||
| 0-4 yrs | 1 | 1 | 6 | 2 | |
| 5-8 yrs | 3 | 5 | 12 | 6 | |
| 9-12 yrs | 33 | 47 | 51 | 40 | |
| any college | 63 | 47 | 31 | 52 | |
|
| |||||
| Race/ethnicity, % | < 0.001 | ||||
| Hispanic | 6 | 7 | 7 | 8 | |
| White, not Hispanic | 77 | 59 | 32 | 57 | |
| Black | 16 | 30 | 58 | 32 | |
| Other or multiracial | 1 | 4 | 4 | 4 | |
|
| |||||
| Medical history: | |||||
| Diabetes, % | 32 | 35 | 41 | 43 | 0.002 |
| Hypertension, % | 77 | 76 | 86 | 80 | 0.01 |
| Ischemic heart disease, % | 14 | 11 | 14 | 19 | 0.1 |
| Symptomatic S3, % | 8 | 11 | 17 | 9 | < 0.001 |
| Symptomatic subcortical TIA, % | 5 | 9 | 5 | 7 | 0.3 |
|
| |||||
| Time from qualifying S3 to test, % | 0.2 | ||||
| < 6 weeks | 24 | 24 | 31 | 23 | |
| 6 weeks - 3 mo | 46 | 50 | 46 | 47 | |
| > 3 mo | 29 | 26 | 23 | 30 | |
|
| |||||
| Location of qualifying S3, % | 0.003 | ||||
| Anterior | 49 | 53 | 43 | 51 | 0.03 |
| Thalamic | 28 | 28 | 25 | 20 | |
| Posterior | 23 | 19 | 32 | 29 | |
| Lateralization of Qualifying S3, % | |||||
| Right anterior or thalamic | 50 | 41 | 40 | 51 | |
| Left anterior or thalamic | 50 | 59 | 60 | 49 | |
|
| |||||
| Modified Rankin stroke disability score, % | < 0.001 | ||||
| 0 | 18 | 13 | 8 | 11 | |
| 1 | 56 | 53 | 40 | 53 | |
| 2 | 22 | 26 | 37 | 31 | |
| 3+ | 5 | 7 | 15 | 5 | |
|
| |||||
| CASI z-score, mean (sd) | -0.03 (0.97) | -0.80 (1.21) | -2.46 (1.99) | -0.89 (1.38) | < 0.001 |
|
| |||||
| MMSE, raw score, median (IQR) | 30 (2) | 29 (3) | 27 (4) | 29 (3) | < 0.001 |
|
| |||||
| MMSE, age and education adjusted, % | 8 | 16 | 32 | 17 | |
| below 25th percentile | 32 | 46 | 44 | 41 | |
| 25th to below 75th percentile | 60 | 38 | 25 | 42 | |
| at or above 75th percentile | |||||
|
| |||||
| Barthel index score ≥ 95, % | 87 | 85 | 76 | 85 | < 0.001 |
Results for16 of 1632 participants were too incomplete to determine status. Results did not change appreciably when the 68 bilingual participants were excluded.
NCI=no cognitive impairment; MCI=mild cognitive impairment; CASI=Cognitive Assessment Screening Instrument; MMSE=Mini Mental Status Exam
Participants with MCI had lower education than those with NCI (57% vs. 37% ≤ 12 yrs, p < 0.001), and were more likely to have diabetes (40% vs. 32%, p = 0.001), a prior S3 (13% vs. 8%, p = 0.002), and a more severe qualifying stroke (41% vs. 26% m-Rankin ≥2, p < 0.001). However, of the 872 participants with at least some college education, 37% had MCI, and of the 952 participants with no significant disability (Rankin = 0-1 and Barthel index = 100), 41% had MCI. Participants with MCI performed more poorly on measures of global cognition including CASI and MMSE. Overall, those with memory impairment (MCIa or MCImd) were similar to those without memory impairment except they were less educated (p < 0.001), more likely to have had a prior S3 (p < 0.001) and a more severe qualifying stroke (p < 0.001) (Table 3). Participants with MCImd had the highest levels of functional and cognitive impairment among all MCI subtypes (Table 3).
Younger age, male sex, and less education, were independently associated with a higher likelihood of MCI (Table 4). Among pre-stroke factors, only prior S3 contributed to a higher likelihood of MCI, whereas among stroke-related factors, Barthel < 95 and Rankin > 0 each did so independently. When pre-stroke and stroke-related factors were combined, only Barthel < 95 and Rankin > 0 remained in the model. Vascular risk factors, location and lateralization of index stroke, and upper extremity motor or sensory loss or incoordination did not add information about likelihood of MCI.
Table 4. Multivariate models of neuropsychological status.
| Odds ratio (95% CI) | ||
|---|---|---|
|
| ||
| Full Model | Final Model | |
|
| ||
| Model 1: Demographic factors | ||
| Age, per 10 yr increase | 0.88 (0.80, 0.97) | 0.87 (0.79, 0.96) |
| Male sex | 1.30 (1.06, 1.60) | 1.30 (1.06, 1.60) |
| Education | ||
| 0-4 yr | reference group | reference group |
| 5-8 yr | 0.65 (0.25, 1.73) | 0.66 (0.25, 1.74) |
| 9-12 yr | 0.32 (0.13, 0.75) | 0.33 (0.13, 0.74) |
| any college | 0.15 (0.06, 0.35) | 0.15 (0.06, 0.35) |
| Time from qualifying S3 to testing | * | |
| < 6 weeks | reference group | |
| 6 weeks - 3 mo | 0.96 (0.75, 1.23) | |
| > 3 mo | 0.84 (0.63, 1.10) | |
|
| ||
| Model 2, Pre-stroke factorsˆ | ||
| Diabetes | 1.24 (1.00, 1.54) | * |
| Hypertension | 1.22 (0.94, 1.57) | * |
| Ischemic Heart disease | 0.89 (0.66, 1.19) | * |
| Prior S3 | 1.51 (1.07, 2.12) | 1.57 (1.12, 2.20) |
|
| ||
| Model 3, Stroke-related factorsˆ | ||
| Location of lesion | * | |
| anterior | reference group | |
| thalamic | 0.88 (0.69, 1.12) | |
| posterior | 1.06 (0.82, 1.36) | |
| Lateralization of lesion# | * | |
| left | reference group | |
| right | 0.79 (0.62, 1.00) | |
| UE motor or sensory loss or incoordination | 1.12 (0.90, 1.40) | * |
| Barthel Index < 95 | 1.37 (1.02, 1.83) | 1.42 (1.07, 1.90) |
| Rankin Score > 0 | 1.59 (1.16, 2.17) | 1.67 (1.24, 2.26) |
|
| ||
| Model 4: Pre-stroke and Stroke-related factorsˆ | ||
| Diabetes | 1.18 (0.95, 1.47) | * |
| Hypertension | 1.16 (0.90, 1.50) | * |
| Ischemic Heart disease | 0.89 (0.66, 1.19) | * |
| Prior S3 | 1.14 (1.00, 1.99) | * |
| Location of lesion | * | |
| anterior | reference group | |
| thalamic | 0.90 (0.70, 1.15) | |
| posterior | 1.02 (0.79, 1.32) | |
| Lateralization of lesion# | * | |
| left | reference group | |
| right | 0.77 (0.61, 0.98) | |
| UE motor or sensory loss or incoordination | 1.09 (0.88, 1.37) | * |
| Barthel Index < 95 | 1.34 (1.00, 1.80) | 1.42 (1.07, 1.90) |
| Rankin Score > 0 | 1.52 (1.11, 2.09) | 1.67 (1.24, 2.26) |
not significant in model, i.e. p > 0.01
OR for right vs. left in subgroup of patients with anterior or thalamic lesion
adjusted for demographic variables in final model
Discussion
In this study we evaluated the severity and pattern of performance deficits on neuropsychological testing (NPT) in a large cohort of 1636 US and Canadian English speaking subjects with symptomatic, MRI confirmed small subcortical stroke (S3) enrolled in the Secondary Prevention of Small Subcortical Strokes (SPS3) trial. On average, participants presented modest to substantial impairments compared to normative data. The majority of deficits remained when those with upper extremity weakness, incoordination, and/or sensory loss were excluded. Deficits were particularly prominent on tests of verbal episodic memory, verbal fluency, clock drawing and motor dexterity, and validated by clinical measures of global cognition (CASI), disability (Rankin) and ADLs (Barthel). Half of the cohort met psychometric criteria for MCI with amnestic deficits as prevalent as non-amnestic. MCI was associated with younger age, male sex, less education, post-stroke disability, and impaired ADLs.
Our finding of impaired processing speed, motor dexterity and executive functioning is consistent with the impairment pattern hypothesized for subcortical ischemic disease2 and with neuropsychological studies on S3 populations8, 10, 11, 23. However, our findings of equally prominent episodic memory deficits in S3 subjects do not readily fit this pattern. Reports of episodic memory impairment have been sparse to date5,8, 10, 23, 24 and incident lacunes have been reported to impact processing speed and motor control but not memory25. Discrepancies may be due to differences in the time lag between stroke and NPT, in the type of memory assessments and in lacunar stroke definition. The magnitude of episodic memory impairment and its centrality in the MCI of our S3 subjects raises questions about co-existing AD pathology23, 26. However, subjects with amnestic MCI were not older than those with NCI or non-amnestic MCI. Older age, a well-established risk factor for AD27 was not associated with a higher likelihood of MCI in our data. In addition, the pattern of episodic memory impairment, with impaired delayed recall but relatively spared recognition, suggests disruption of prefrontal cortex-based strategic retrieval rather than hippocampus-based associative processes28 expected in the presence of AD.
Estimates of MCI prevalence in S3 populations vary considerably. We found that 47% of our subjects met MCI criteria. Estimates from other studies of similar populations have ranged from 7 to 75% 23, 29. In general population-based studies, the prevalence of different definitions of MCI ranges from 16 to 23% in individuals aged 65 or older30. Discrepancies are likely due to MCI definitions. Our definition is based on post-hoc application of psychometric criteria, and the resulting prevalence estimate of MCI must be weighed against the expected proportion scoring below the cut off in normal populations (∼7 %). MCI classifications similar to ours have served as a basis for prevalence estimates in epidemiological studies31, 32 As per the recent AHA/ASA criteria for VaMCI6, we have applied a 1.5 SD below normal cut off and determined the independence of cognitive from motor/sensory deficits. We have imaging evidence of cerebrovascular disease, albeit without a clear temporal relationship between the S3 and MCI. We have insufficient information to firmly establish a decline from pre-stroke functioning, and the preservation of instrumental activities of daily living (IADL). We cannot rule out that a proportion of our subjects with MCI may have already been cognitively impaired prior to study entry as result of clinically silent small vessel disease, vascular risk factors or a nonvascular neurodegenerative disorder. However, we failed to find an association between vascular risk factors and risk of MCI. Subjects with an age- and education adjusted MMSE score < 24 were excluded from the SPS3 trial10.
On these grounds we suggest that MCI, identified in half of our participants, is an important clinical sequela of lacunar stroke, more prevalent than physical disability defined by Rankin score ≥ 2 (33%), and present in 41% of patients with no significant disability (Rankin=0-1, Barthel index=100). We observed cognitive deficits in the order of z=-0.4 to -0.8 in participants with no significant physical limitations. It should be noted that these subjects may have functional limitations not captured by the Rankin and Barthel ratings. We speculate that the cognitive effects of lacunar stroke are at least as important as disability related to motor or sensory deficits, and occur in their absence, particularly in younger patients. The association between young age and cognitive impact of lacunar stroke is not readily explainable and could be an artifact due to limitations in normative data for older adults including a larger variability.
The strengths of our study are a large, well characterized sample of patients with MRI-confirmed small subcortical stroke likely resulting from cerebral small vessel disease, and broad coverage provided by our NPT battery. We recognize limitations in the generalizability of our findings. There may be a selection bias towards lesser stroke severity in our SPS3 trial participants, with underestimate of the true impact on cognition. The findings may be specific to US and Canadian English speaking subjects. Another limitation is our use of different sets of normative data for comparative purposes. These normative data have been developed on different populations, some on small study samples, and are not adjusted consistently for age, sex, and education. Our findings may be, at least in part, due to having used different norms for tests of episodic memory, processing speed, motor and executive function. However the consistent relationships of our norm-based NPT scores with CASI, m-Rankin and Barthel support their validity. Future studies will benefit not only from a harmonized approach to post-stroke neuropsychological assessment but also from properly stratified norms from a population-based sample of healthy subjects.
In summary, this study has shown significant cognitive impairments following lacunar strokes. It has provided empirical confirmation of impairments in processing speed, motor dexterity, and executive function, conceptually linked to subcortical ischemic disease, and drawn attention to episodic memory impairment as an equally central feature. Our findings have implications for clinical practice where cognitive dysfunction in lacunar stroke patients may be as common and as important as motor and sensory sequelae, but overlooked.
Supplementary Material
Supplemental Table 1: Clox Draw to Command (Clox) scoring criteria used in SPS3
Supplemental Table 2. Neuropsychological Test Battery in SPS3
Supplemental Table 3: Mean (sd) z-score/standard score by modified Rankin Stroke Disability Score and Barthel Index score.
Supplemental Table 4: Three-factor Principal Component analysis of z-scores with varimax rotation: Loadings > 0.5 are bolded
Acknowledgments
The Secondary Prevention of Small Subcortical Strokes (SPS3) trial is funded by the US National Institute of Health and Neurological Disorders and Stroke (NIH/NINDS) grant # U01 NS38529-04A1, PI Dr. Oscar R. Benavente. Dr. Claudia Jacova gratefully acknowledges funding through the Ralph Fisher Professorship in Alzheimer's Research (Alzheimer Society of British Columbia, Canada).
Funding: The Secondary Prevention of Small Subcortical Strokes (SPS3) trial is funded by the US National Institute of Health and Neurological Disorders and Stroke (NIH/NINDS) grant # U01 NS38529-04A1, PI Dr. Oscar R Benavente and CoPI Dr. Robert G. Hart Sanofi/BMS USA donated study medication (clopidogrel and placebo).
References
- 1.Morris HR, Waite AJ, Williams NM, Neal JW, Blake DJ. Recent advances in the genetics of the ALS-FTLD complex. Curr Neurol Neurosci Rep. 2012;12:243–250. doi: 10.1007/s11910-012-0268-5. [DOI] [PubMed] [Google Scholar]
- 2.Andreason PJ, Zametkin AJ, Guo AC, Baldwin P, Cohen RM. Gender-related differences in regional cerebral glucose metabolism in normal volunteers. Psychiatry Res. 1994;51:175–183. doi: 10.1016/0165-1781(94)90037-x. [DOI] [PubMed] [Google Scholar]
- 3.Frackowiak RS, Friston KJ, Frith CD, Dolan RJ, Price CJ, Zeki S, Ashburner JT, Penny WD. Human Brain Function. 2nd. Elsevier Inc.; 2004. [Google Scholar]
- 4.Erkinjuntti T, Inzitari D, Pantoni L, et al. Research criteria for subcortical vascular dementia in clinical trials. Journal of Neural Transmission - Supplementum. 2000;59:23–30. doi: 10.1007/978-3-7091-6781-6_4. [DOI] [PubMed] [Google Scholar]
- 5.Gur RC, Mozley LH, Mozley PD, et al. Sex differences in regional cerebral glucose metabolism during a resting state. Science. 1995;267:528–531. doi: 10.1126/science.7824953. [DOI] [PubMed] [Google Scholar]
- 6.Whitwell JL, Weigand SD, Boeve BF, et al. Neuroimaging signatures of frontotemporal dementia genetics: C9ORF72, tau, progranulin and sporadics. Brain. 2012;135:794–806. doi: 10.1093/brain/aws001. [DOI] [PMC free article] [PubMed] [Google Scholar]
- 7.O'Sullivan M, Morris RG, Markus HS. Brief cognitive assessment for patients with cerebral small vessel disease. J NeurolNeurosurgPsychiatry. 2005;76:1140–1145. doi: 10.1136/jnnp.2004.045963. [DOI] [PMC free article] [PubMed] [Google Scholar]
- 8.Babikian VL, Wolfe N, Linn R, Knoefel JE, Albert ML. Cognitive changes in patients with multiple cerebral infarcts. Stroke. 1990;21:1013–1018. doi: 10.1161/01.str.21.7.1013. [DOI] [PubMed] [Google Scholar]
- 9.Lowe VJ, Kemp BJ, Jack CR, Jr, et al. Comparison of 18F-FDG and PiB PET in cognitive impairment. Journal of nuclear medicine: official publication, Society of Nuclear Medicine. 2009;50:878–886. doi: 10.2967/jnumed.108.058529. [DOI] [PMC free article] [PubMed] [Google Scholar]
- 10.Mackenzie IR, Baker M, Pickering-Brown S, et al. The neuropathology of frontotemporal lobar degeneration caused by mutations in the progranulin gene. Brain. 2006;129:3081–3090. doi: 10.1093/brain/awl271. [DOI] [PubMed] [Google Scholar]
- 11.Snowden JS, Pickering-Brown SM, Mackenzie IR, et al. Progranulin gene mutations associated with frontotemporal dementia and progressive non-fluent aphasia. Brain. 2006;129:3091–3102. doi: 10.1093/brain/awl267. [DOI] [PubMed] [Google Scholar]
- 12.Folstein MF, Folstein S, McHugh PR. Mini-mental state: A practical method for grading the cognitive state of patients for the clinician. Journal of Psychiatric Research. 1975;12:189–198. doi: 10.1016/0022-3956(75)90026-6. [DOI] [PubMed] [Google Scholar]
- 13.Forman MS, Mackenzie IR, Cairns NJ, et al. Novel ubiquitin neuropathology in frontotemporal dementia with valosin-containing protein gene mutations. J Neuropathol Exp Neurol. 2006;65:571–581. doi: 10.1097/00005072-200606000-00005. [DOI] [PubMed] [Google Scholar]
- 14.Neumann M, Sampathu DM, Kwong LK, et al. Ubiquitinated TDP-43 in frontotemporal lobar degeneration and amyotrophic lateral sclerosis. Science. 2006;314:130–133. doi: 10.1126/science.1134108. [DOI] [PubMed] [Google Scholar]
- 15.Crum RM, Anthony JC, Bassett SS, Folstein MF. Population-based norms for the Mini-Mental State examination by age and educational level. Journal of the American Medical Association. 1993;269:2386–2391. [PubMed] [Google Scholar]
- 16.Mackenzie IR, Baborie A, Pickering-Brown S, et al. Heterogeneity of ubiquitin pathology in frontotemporal lobar degeneration: classification and relation to clinical phenotype. Acta Neuropathol. 2006;112:539–549. doi: 10.1007/s00401-006-0138-9. [DOI] [PMC free article] [PubMed] [Google Scholar]
- 17.Winblad B, Palmer K, Kivipelto M, et al. Mild cognitive impairment--beyond controversies, towards a consensus: report of the International Working Group on Mild Cognitive Impairment. J InternMed. 2004;256:240–246. doi: 10.1111/j.1365-2796.2004.01380.x. [DOI] [PubMed] [Google Scholar]
- 18.Petersen RC, Doody R, Kurz A, et al. Current concepts in mild cognitive impairment. Archives of Neurology. 2001;58(12):1985–1992. doi: 10.1001/archneur.58.12.1985. [DOI] [PubMed] [Google Scholar]
- 19.Delis DC, Kramer JH, Kaplan E, Ober BA. California Verbal Learning Learning Test: Adult Version. San Antonio, TX: The Psychological Corporation; 1987. [Google Scholar]
- 20.Wechsler D. WAIS-III: Administration and scoring manual. San Antonio, TX: The Psychological Corporation - Harcourt Brace & Company; 1997. [Google Scholar]
- 21.Gass J, Cannon A, Mackenzie IR, et al. Mutations in progranulin are a major cause of ubiquitin-positive frontotemporal lobar degeneration. Hum Mol Genet. 2006;15:2988–3001. doi: 10.1093/hmg/ddl241. [DOI] [PubMed] [Google Scholar]
- 22.Mackenzie IR, Butland SL, Devon RS, et al. Familial frontotemporal dementia with neuronal intranuclear inclusions is not a polyglutamine expansion disease. BMC neurology. 2006;6:32. doi: 10.1186/1471-2377-6-32. [DOI] [PMC free article] [PubMed] [Google Scholar]
- 23.Reed BR, Mungas DM, Kramer JH, et al. Profiles of neuropsychological impairment in autopsy-defined Alzheimer's disease and cerebrovascular disease. Brain. 2007;130:731–739. doi: 10.1093/brain/awl385. [DOI] [PubMed] [Google Scholar]
- 24.de Silva R, Lashley T, Strand C, et al. An immunohistochemical study of cases of sporadic and inherited frontotemporal lobar degeneration using 3R- and 4R-specific tau monoclonal antibodies. Acta Neuropathol. 2006;111:329–340. doi: 10.1007/s00401-006-0048-x. [DOI] [PubMed] [Google Scholar]
- 25.Mackenzie IR, Baker M, West G, et al. A family with tau-negative frontotemporal dementia and neuronal intranuclear inclusions linked to chromosome 17. Brain. 2006;129:853–867. doi: 10.1093/brain/awh724. [DOI] [PubMed] [Google Scholar]
- 26.Jacova C, Kertesz A, Blair M, Fisk JD, Feldman H. Neuropsychological testing and assessment for dementia. Alzheimer's & Dementia. 2007;3:299–317. doi: 10.1016/j.jalz.2007.07.011. [DOI] [PubMed] [Google Scholar]
- 27.Graham JE, Rockwood K, Beattie BL, et al. Prevalence and severity of cognitive impairment with and without dementia in an elderly population. lanc. 1997;349:1793–1796. doi: 10.1016/S0140-6736(97)01007-6. [DOI] [PubMed] [Google Scholar]
- 28.Moscovitch M. Memory and Working-with-Memory - a Component Process Model Based on Modules and Central Systems. J Cognitive Neurosci. 1992;4:257–267. doi: 10.1162/jocn.1992.4.3.257. [DOI] [PubMed] [Google Scholar]
- 29.Anderson JF, Saling MM, Srikanth VK, Thrift AG, Donnan GA. Individuals with first-ever clinical presentation of a lacunar infarction syndrome: Is there an increased likelihood of developing mild cognitive impairment in the first 12 months after stroke? J Neuropsychol. 2008;2:373–385. doi: 10.1348/174866408x288846. [DOI] [PubMed] [Google Scholar]
- 30.Jacova C, Feldman H. Mild Cognitive Impairment. In: Gelder M, Lopez-Ibor J, Andreasen N, Geddes J, editors. New Oxford Textbook of Psychiatry 2/e. 2010. [Google Scholar]
- 31.Gass J, Prudencio M, Stetler C, Petrucelli L. Progranulin: An emerging target for FTLD therapies. Brain Res. 2012;1462:118–128. doi: 10.1016/j.brainres.2012.01.047. [DOI] [PMC free article] [PubMed] [Google Scholar]
- 32.Larrieu S, Letenneur L, Orgogozo JM, et al. Incidience and outcome of mild cognitive impairment in a population-based prospective cohort. Neurology. 2002;59:1594–1599. doi: 10.1212/01.wnl.0000034176.07159.f8. [DOI] [PubMed] [Google Scholar]
Associated Data
This section collects any data citations, data availability statements, or supplementary materials included in this article.
Supplementary Materials
Supplemental Table 1: Clox Draw to Command (Clox) scoring criteria used in SPS3
Supplemental Table 2. Neuropsychological Test Battery in SPS3
Supplemental Table 3: Mean (sd) z-score/standard score by modified Rankin Stroke Disability Score and Barthel Index score.
Supplemental Table 4: Three-factor Principal Component analysis of z-scores with varimax rotation: Loadings > 0.5 are bolded