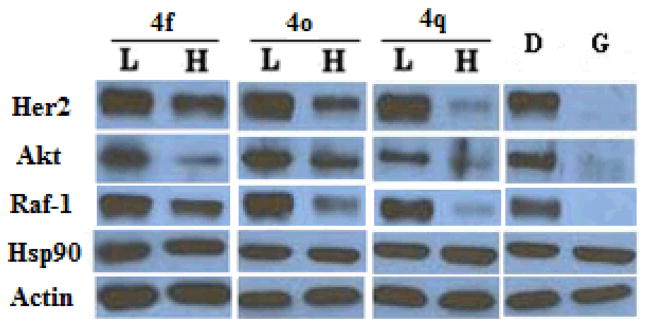
Figure 2.

Western blot analyses of the Hsp90 client protein degradation in MCF-7 breast cancer cells lysis after treatment of triazole analogues. L represents a concentration 1/2 of the anti-proliferative IC50 value, while H represents a concentration 5 times the antiproliferative IC50 value. Geldanamycin (G, 500 nM) represents a positive control, while DMSO (D), vehicle, serves as the negative control.
