

Abstract
Several common genetic variants influence cholesterol levels, which play a key role in overall health. Myelin synthesis and maintenance are highly sensitive to cholesterol concentrations, and abnormal cholesterol levels increase the risk for various brain diseases, including Alzheimer's disease (AD). We report significant associations between higher serum cholesterol (CHOL) levels and high-density lipoproteins (HDL) and higher fractional anisotropy in 403 young adults (23.8±2.4 years) scanned with diffusion imaging and anatomical MRI at 4 Tesla. By fitting a multi-locus genetic model within white matter areas associated with CHOL, we found that a set of 18 cholesterol-related SNPs implicated in AD risk predicted FA. We focused on the SNP with the largest individual effects - CETP (rs5882) – and found that increased G-allele dosage was associated with higher FA and lower radial and mean diffusivities in voxel-wise analyses of the whole brain. A follow-up analysis detected WM associations with rs5882 in the opposite direction in 78 older individuals (74.3±7.3 years). Cholesterol levels may influence WM integrity, and cholesterol-related genes may exert age-dependent effects.
Keywords: brain structure, DTI, imaging genetics, cholesterol, development, aging
Introduction
Nearly a quarter of the body's cholesterol lies in the central nervous system (CNS) (Dietschy & Turley, 2004), where it serves as the rate-limiting factor for myelin biosynthesis (Saher et al, 2005). The available pool of cholesterol in the brain also governs CNS synaptogenesis (Mauch et al, 2001). Thus, cholesterol is essential for brain maturation and white matter (WM) development, and decreased cholesterol early in life may limit both the number and efficacy of synapses. CNS cholesterol concentration is largely independent of serum cholesterol levels due to the low permeability of cholesterol through the blood brain barrier (Saher & Simons, 2010). Even so, changes in serum concentrations have been associated with variations in the healthy brain's WM structure (Cohen et al., 2011; Williams et al, 2013).
The WM fiber structure of the living human brain can be assessed non-invasively using diffusion tensor imaging (DTI). DTI has been used to both characterize patterns of the developing brain (Hüppi & Dubois, 2006; Tamnes et al., 2010) and to demonstrate differences between healthy and unhealthy brains in many disease processes (Le Bihan et al., 2001; Nir et al, 2013). Regional differences in DTI-derived WM metrics are highly heritable (Jahanshad et al, 2013; Jin et al, 2011; Thomason & Thompson, 2011) and are associated with differences in a variety of factors including serum biomarker measures (Jahanshad et al, 2012) and cognitive performance (Chiang et al, 2009; Grieve et al, 2007; Kochunov et al, 2010).
Variations in plasma lipid and lipoprotein levels are also highly heritable, and differences even within the healthy range of cholesterol values may exert influence over the brain. 40%-60% of the normal variation in total cholesterol (CHOL), high-density lipoprotein (HDL), and low-density lipoprotein (LDL) concentrations are attributable to genetic influences (Asselbergs et al, 2012), and several genetic variants have been identified that are associated with lipoprotein levels (Asselbergs et al., 2013). Cholesterol levels may have age-dependent effects on cognition, suggesting a changing need for cholesterol in the brain over the lifespan. Multiple studies suggest that higher cholesterol levels in younger adults may be associated with higher fluid intelligence (speed and/or flexibility of mental processing) (Waldstein, 2001). Specifically, university undergraduate students with higher serum cholesterol levels showed faster decision-making and movement times on a choice reaction time test (Benton, 1995), and non-elderly adults with higher cholesterol levels performed better on the WAIS-R Block Design test, which requires rapid, adaptive problem solving skills (Waldstein, 2001). While some studies similarly correlate lower cholesterol with poorer executive function in older adults (Elias et al., 2005; Manilio et al., 1993), late-life hypercholesterolemia is strongly associated with an increased risk for Alzheimer's disease (Refolo et al., 2000; Shobab et al., 2005) – a neurodegenerative disease characterized by cognitive deficit (Derouesné et al., 1999). In general, faster processing and motor speeds are associated with higher FA (Aukema et al., 2009; Chiang et al., 2009), and poorer cognitive performance in executive tasks is associated with lower FA (Grieve et al., 2007). As cognition is associated with cholesterol levels as well as differences in WM, we hypothesize that cholesterol concentration also predict white matter microstructure.
Currently, the role of the serum cholesterol and cholesterol gene variants on brain development and risk for disease are not well understood. As WM continues to mature well beyond age 30 (Bartzokis et al., 2004; Kochunov et al., 2010; Tamnes et al., 2010), we set out to determine whether serum cholesterol concentrations measured during adolescence (mean age: 15) might predict WM integrity almost a decade later in early adulthood (mean age: 24) in a large cohort of 403 healthy individuals. We further hypothesized that genetic risk factors for high cholesterol, particularly those with known neurological associations, might relate to WM microstructure, as defined by FA and mean, radial, and axial diffusivity measures, and that these same specific genetic variants would be associated with axonal integrity in an independent sample of elderly adults. Our goal was to determine if serum cholesterol levels and common cholesterol-related genetic variants were associated with white matter (WM) microstructural integrity, and, further, if the relationship differed in younger and older age groups.
Materials and Methods
We examined two different cohorts – young Australian twins (the QTIM cohort) and elderly individuals scanned across North America as part of the Alzheimer's Disease Neuroimaging Initiative (ADNI). An overview of the analyses performed in each of these cohorts is summarized in Supplementary Figure 1.
QTIM Cohort
The QTIM (Queensland Twin IMaging study) is a project recruiting healthy Australian twins, to identify genes influencing brain health and to better understand genetic factors that affect the brain. Participants were excluded if they had a history of significant head injury, neurological or psychiatric illness, substance abuse or dependence, or had a first-degree relative with a psychiatric disorder. Participants were also assessed with a range of cognitive tasks. Handedness was assessed using 12 items from Annett's Handedness Questionnaire (Annett, 1970). Our study included 403 right-handed, Caucasian participants (146 men/257 women). Their mean age was 23.8 years (SD: 2.4).
Determining Cholesterol Levels
Multiple (average 2.2, SD 1.0) non-fasting serum cholesterol samples were collected from 449 scanned participants in the QTIM study. Lipid measurements were assessed at 12, 14, and/or 16 years old. If multiple measures were available for any given subject, the cholesterol values - and, separately, the ages at measurement - were averaged. The participants' mean age at the time of the cholesterol measurements was 15.2 years (SD 2.3). The lipid panel directly measured total cholesterol (CHOL) and high-density lipoprotein (HDL) levels; low-density lipoprotein (LDL) was indirectly calculated (and will thus be referred to as LDL-c) from the Friedewald equation (Warnick et al., 1990):
| Eq. 1 |
Measuring lipid levels in the fasting state is typical, but some studies argue that this may be detrimental to accurate risk assessment based on blood lipid levels (Langsted et al., 2008; Mora et al, 2008). Proponents of fasting lipid measurements often cite the increase in triglyceride levels during a fat tolerance test (Schaefer et al, 2001). In a study of 33,391 individuals, Langsted et al. (2008) reported that non-fasting levels of lipids, lipoproteins, and apolipoproteins vary only minimally from levels in the fasting state. Furthermore, multiple averaged non-fasting measures may better reflect the body's typical lipid profile, as more time is spent in the post-absorptive state than the “fasting” state. In the same study, non-fasting LDL-c differed only slightly from fasting measures, but was more useful for predicting risk of cardiovascular events. Thus non-fasting CHOL, HDL, and LDL-c were all analyzed in the present study.
Selection of Genes of Interest
In a genome-wide association study (GWAS) of 66,240 individuals, Asselbergs et al. (2012) found 945 single nucleotide polymorphisms (SNPs) involved in cholesterol metabolism, 170 of which were genotyped as part of the Illumina Quad-610 BeadChip in our QTIM cohort (genotyping protocol is available in the Supplementary Methods.). We eliminated SNPs with a minor allele frequency (MAF) < 0.2236 or a linkage disequilibrium (LD) > 0.4 to assure that the homozygous minor allele carriers always represented at least 5% of our population, and that associations found were independent of variations in other SNPs included in the model. All SNPs passing the initial inclusion criteria (genotyped with passing MAFs and LDs) were included in keyword searches using Google Scholar to search for prior reports of associations with Alzheimer's disease. Of these, 18 SNPs had been associated with AD, and were included as SNPs of interest in our study (Astarita et al., 2010; Baum et al., 1999; Dzamko, 2011; Gustafsen et al., 2013; Ikeda & Yamada, 2010; Kysenius et al., 2012; Lamsa et al., 2008; Mulder et al., 2012; Natunen et al., 2012; Page et al., 2012; Rodriguez-Rodriguez et al., 2009; Roses et al., 2010; Solfrizzi et al., 2002; Vuletic et al., 2003; Wollmer et al., 2003; Xiao et al., 2012). The SNPs we included are summarized in Table 1.
Table 1.
SNPs included in the multi-SNP model. The gene (or the nearest gene when SNP is intergenic), minor allele frequency, and minor allele associated with cholesterol for each SNP.
| SNP | Nearest Gene | MAF | Minor Allele |
|---|---|---|---|
| rs102275 | FADS1 | 0.483 | C |
| rs11206514 | PCSK9 | 0.4093 | C |
| rs2000069 | ABCA1 | 0.4863 | T |
| rs253 | LPL | 0.4959 | T |
| rs261341 | LIPC | 0.4597 | A |
| rs3846662 | HMGCR | 0.4158 | G |
| rs387976 | PVRL2 | 0.4734 | C |
| rs405509 | TOMM40 | 0.4927 | T |
| rs439401 | APOE | 0.3942 | T |
| rs4810479 | PLTP | 0.4226 | C |
| rs4970843 | SORT1 | 0.4245 | C |
| rs5882 | CETP | 0.4478 | G |
| rs5930 | LDLR | 0.3494 | A |
| rs6602910 | GAS6 | 0.4588 | T |
| rs7120118 | NR1H3 | 0.4634 | C |
| rs7122944 | PAFAH1B2 | 0.2289 | G |
| rs783149 | LPA | 0.3155 | A |
| rs838878 | SCARB1 | 0.3397 | A |
These joint cholesterol-Alzheimer's SNPs were then entered into a multi-locus analysis to examine whether they had a collective effect in predicting white matter microstructural integrity.
Cholesterol Analysis
A general flow diagram of our hypotheses is shown in Figure 1.
Figure 1.
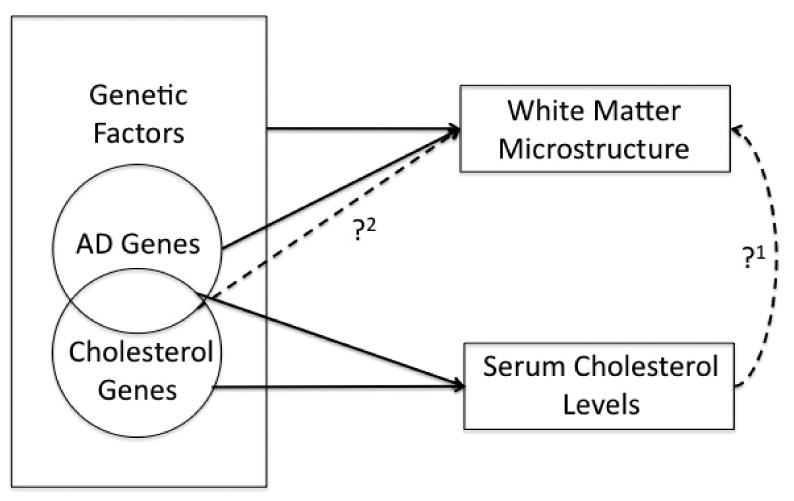
Several known relationships (solid black arrows) motivated our study. Both serum cholesterol levels and brain structure are highly heritable. In our initial analysis, we tested whether serum cholesterol levels effected WM microstructure (?1). Brain and serum cholesterol pools are largely independent, so we hypothesized that certain genes might exhibit pleiotropic effects on both serum and brain cholesterol pools and, thus, brain integrity. As cholesterol genes maintain serum cholesterol levels and AD genes influence brain structure, we analyzed the effects of a subset of cholesterol genes implicated in AD pathology on WM microstructure (?2).
A random-effects model was used to study the statistical significance of plasma cholesterol values (CHOL, HDL, and LDL-c) voxelwise on regional white matter, while co-varying for age and sex. Multiple comparisons corrections were used to control for false positives.
Multi-SNP Analysis
Linear mixed-effects models were used to study the joint associations of SNPs with imaging measures, accounting for kinship among participants (Kohannim et al., 2012) using the efficient mixed-model association (EMMA; http://mouse.cs.ucla.edu/emma/) software with restricted maximum likelihood estimation (Kang et al., 2008). This analysis was carried out within the voxels associated with CHOL in the previous analysis. Arguably, the effects of cholesterol-related SNPs on the brain may be more likely to be detected at locations where a serum cholesterol association has already been detected. Such a relationship was found in a voxel-wise FA analysis of serum iron levels and iron transport genes (Jahanshad et al., 2012). Otherwise, heavy multiple comparisons corrections are required to adjust for searching the whole brain, so a restricted search space imposes a less stringent significance threshold to report credible associations.
SNP genotypes were coded additively as 0, 1, or 2 according to the number of minor alleles present in each subject. The significance levels (p-value) of individual and joint SNP associations with FA, Drad, Dmean, and Dax were determined from the F-score of the partial F-test:
| Eq. 2 |
Here, RSS represents the residual sum-of-squares. A reduced model includes only covariates (age, sex), and the full model contains all SNPs and covariates. p-maps were generated for each individual SNP, co-varying for each of the 17 other SNPs.
Candidate Gene Analysis
As a post hoc test, we assessed the effect of an individual SNP that contributed most to the multi-SNP results, examining its individual voxel-wise associations with measures of microstructural WM integrity on the thresholded whole brain scans of QTIM participants. This test was not restricted to the CHOL mask generated earlier.
Multiple Comparisons Correction
Computing multiple comparisons across thousands of voxels can introduce a high false positive error rate (Nir et al, 2013). To account for these errors, we used the searchlight false discovery rate (FDR) method to control the false positive rate of each map at q = 0.05, which controls for regional effects over FDR in any reported findings (Jahanshad et al, 2012; Langers et al., 2007). All statistical maps shown in this paper were thresholded at their corrected p-value after performing searchlight FDR at q = 0.05 to show only regions of significance. Uncorrected p-values were then shown within the significant regions. When determining the significance of the effects of each individual SNP in the multi-SNP analysis (e.g., to identify our candidate SNP), we had to correct for each of the 18 SNPs included in the joint analysis.
Follow-Up Analysis – ADNI Cohort
To follow-up these findings, we also tested if there were any detectable associations in older participants from the ADNI. Our study included 78 participants (49 men/29 women) with an average age of 74.3 ± 7.3 years. At the time of their baseline MRI scan, each subject underwent multiple cognitive evaluations – including the Mini-Mental State Examination (MMSE), Wechsler Memory Scale, Clinical Dementia Rating (CDR), and Alzheimer's Disease Assessment Scale-Cognitive (ADAS-cog) - which were used to identify individuals as having Alzheimer's disease (AD) or mild cognitive impairment (MCI), or they were classified as healthy controls (HC) (Nir et al., 2013). Definitive presence of AD pathology can only be confirmed via brain tissue biopsy or post-mortem examination, so these diagnoses are only probable. Subject information for each probable diagnosis group is summarized in Table 2. Participants were scanned at over 50 sites across North America. Inclusion and exclusion criteria are detailed in the ADNI protocol (www.adni-info.org). All data from this cohort is publicly available at: http://www.loni.usc.edu/ADNI/.
Table 2.
Average age (years at time of scan) and sex of ADNI participants, broken down by probable diagnosis.
| Probable Diagnosis | ||||
|---|---|---|---|---|
| AD | MCI | HC | Total | |
| Participants | 10 | 48 | 20 | 78 |
| Men | 6 | 31 | 12 | 49 |
| Women | 4 | 17 | 8 | 29 |
| Average Age at Scan (yr) | 72.3 ± 11.4 | 74.4 ± 7.1 | 75.0 ± 5.4 | 74.3 ± 7.3 |
The ADNI dataset was chosen for use as an exploratory follow-up sample to study the candidate gene's associations with WM metrics in brain scans of older individuals, not because of the presence of AD and MCI diagnostic categories. As such, all probable diagnoses were included in the analysis to maximize our sample size, and probable disease status was co-varied for, as AD is known to associate with measures of WM (Bartzokis et al., 2003; Rose et al., 2000; Parente et al., 2008).
ADNI was conducted according to Good Clinical Practice guidelines, the Declaration of Helsinki, US 21CFR Part 50— Protection of Human Subjects, and Part 56—Institutional Review Boards, and pursuant to state and federal HIPAA regulations. Written informed consent for the study was obtained from all participants and/or authorized representatives and study partners.
Follow-Up Analysis – Statistical Analysis
In our analysis, we covaried for sex, age, and probable disease status (using a dummy covariate for each of the diagnoses AD and MCI) for our candidate SNP using the model listed in Eq. 2. Candidate SNP allele dosage did not vary significantly between each probable diagnosis, and the allele frequency of each group was in Hardy-Weinberg equilibrium. APOE4 status is important to consider in elderly individuals when analyzing how cholesterol associated genes affect brain volume (Murphy et al., 2012). Thus, we ran additional analyses that co-varied for APOE4 status. As only 57 participants had APOE4 information, we re-ran our initial analysis in this smaller sub-sample, not co-varying for APOE4, to eliminate group size effects. Demographic and genotypic information for both cohorts is summarized in Table 3.
Table 3.
Participant demographics for the QTIM and ADNI cohorts. For QTIM, we report mean total cholesterol (CHOL), high-density lipoproteins (HDL), and calculated low-density lipoproteins (LDL-c). Average serum cholesterol measures were within normal ranges for adolescents (CHOL <4.4 mmol/L (<170 mg/dL); HDL >0.9 mmol/L (>35 mg/dL); LDL <2.8 mmol/L (<110 mg/dL)). In ADNI, APOE4 carrier status is included.
| Database | ||
|---|---|---|
| QTIM | ADNI | |
| Participants | 403 | 78 |
| Men | 146 | 49 |
| Women | 257 | 29 |
| Average Age at Scan (yr) | 23.8 ± 2.4 | 74.3 ± 7.3 |
| Total Cholesterol (mmol/L; mg/dL) | 4.3 ± 0.7; 168 ± 28 | NA |
| Low-Density Lipoproteins (mmol/L; mg/dL) | 2.4 ± 0.6; 95 ± 24 | NA |
| High-Density Lipoproteins (mmol/L; mg/dL) | 1.4 ± 0.3; 54 ± 11 | NA |
| Average Age at Cholesterol Tests (yr) | 15.2 ± 2.3 | NA |
| Number of Cholesterol Tests | 2.2 ± 1.0 | NA |
| rs5882 A/A | 181 | 38 |
| rs5882 A/G | 185 | 32 |
| rs5882 G/G | 37 | 8 |
| APOE4 Homozygotes | NA | 6 |
| APOE4 Heterozygotes | NA | 19 |
| APOE4 Non-Carriers | NA | 32 |
DTI Acquisition and Processing
Images were acquired and processed as previously described (Jahanshad et al., 2012; Nir et al., 2013). Briefly, the following steps were performed: images underwent distortion correction and intensive quality control; DTI metrics were extracted from the tensor; a study specific FA template was created to which we registered all individual FA maps; voxelwise associations were performed in regions of high FA in the template (FA > 0.25 for healthy young adults; FA > 0.2 for older ADNI participants). Additional details on image acquisition and processing and can be found in the Supplementary Methods section.
Explanation of DTI Measures
A single diffusion tensor was fitted at each voxel in the brain from the eddy- and EPI-corrected DWI scans using FSL, and scalar anisotropy and diffusivity measures were obtained from the resulting diffusion tensor eigenvalues including fractional anisotropy (FA) and radial, mean, and axial diffusivity (Drad, Dmean, Dax).
Generally, higher FA indicates the presence of more heavily myelinated axons and is a well-accepted index of microstructural white matter integrity (Beaulieu, 2002; Klingberg et al, 2000). FA will therefore be high (nearer to 1) in regions of high organization (e,g., the corpus callosum), intermediate in regions with some organization (i.e., white matter regions with no predominant fiber orientation), low in regions that are not specifically oriented (i.e., gray matter), and near zero in free fluids (i.e., cerebrospinal fluid) (Grieve et al., 2007).
Lower FA can also indicate a reduction in the density of WM fibers, a loss in axonal bundle coherence, or a variation in membrane permeability to water (Beaulieu & Allen, 1994), so radial, mean, and axial diffusivity (Drad, Dmean, Dax) are also commonly included in WM assessments (Barysheva et al, 2013). Dax (λ1) represents the tendency of water to diffuse along its primary direction of diffusion. Drad (the average of λ2 and λ3) measures diffusion perpendicular to the axonal fibers. Drad is unaffected by the loss of bundle coherence and often increases when myelin is damaged or fails to develop normally (Song et al, 2002; Song et al., 2005; Thomason & Thompson, 2011). Dmean (λ̂) is the average of the diffusivities in the three principal diffusion directions. Thus, Dmean provides an overall evaluation of the molecular motion in a voxel or region, characterizing the overall presence of obstacles to diffusion (Thomason & Thompson, 2011). The combined use of these diffusivity measures gives a clearer picture of WM microstructure.
Results
Cholesterol Analysis
Serum cholesterol concentrations and DTI images were available for 403 individuals from the QTIM cohort (see Demographics, Table 3). We mapped the voxel-wise effects of averaged adolescent blood serum cholesterol measures (CHOL, HDL, and LDL-c; average collection age=15.2 years) across the thresholded WM regions of the whole brain to determine associations with white matter integrity. Higher CHOL was associated (survived FDR at q=0.05) with higher FA across broad regions of white matter, including the genu of the corpus callosum (G), corpus callosum overall (CC), fornix (FX), internal capsule (IC), and the inferior fronto-occipital fasciculus (IFOF) (Figure 2).
Figure 2.
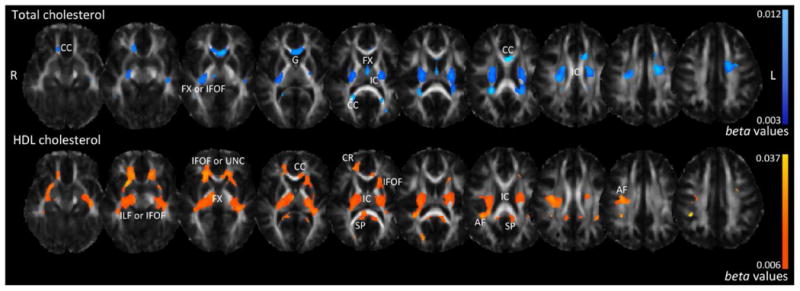
Associations between white matter microstructure (FA) and total cholesterol (CHOL) and high-density lipoprotein (HDL) in the QTIM sample. Higher adolescent serum levels of both CHOL and HDL were associated with higher FA in early adulthood. For total cholesterol, light blue areas correspond to stronger beta-values (regression coefficients more positive); for high-density lipoprotein, yellow areas correspond to stronger beta-values (more positive). Even though both measures positively associate with FA, they are represented in different colors to capture the specific beta-value ranges for each test. CC=corpus callosum, CR=corona radiata, IC=internal capsule, G=genu, IFOF=inferior fronto-occipital fasciculus, UNC=uncinate, ILF=inferior longitudinal fasciculus, FX=fornix, AF=arcuate fasciculus, SP=splenium. Left in the image is right in the brain.
Furthermore, higher CHOL was associated with lower Drad, Dmean, and Dax (with negative beta-values) (Supplementary Figure 1). Higher HDL was associated with higher FA in the splenium of the corpus callosum (SP), the IC, arcuate fasciculus (AF), FX, CC, corona radiata (CR), and regions corresponding to the IFOF, inferior longitudinal fasciculus (ILF), and/or uncinate (UNC) (Figure 2). Higher HDL was associated with lower Drad (Supplementary Figure 2), but variation in HDL was not significantly associated with Dax and Dmean. LDL-c was not significantly associated with FA; thus, other measures of WM microstructure (Dax, Drad, and Dmean) were not further investigated.
Multi-SNP Analysis
As adolescent CHOL levels were associated with WM structure in adulthood, we further examined common variants in a subset of cholesterol-related genes previously associated with AD risk (Table 1). Using a multi-SNP genetic model (Kohannim et al., 2012), we examined the joint effect of allele dosage of 18 SNPs on brain regions where CHOL was associated with FA. This avoided corrections across unnecessary tests at potentially unrelated voxels, or voxels with poor signal to noise ratio, and boosted detection sensitivity by limiting the search space.
Significant predictions were made by the joint multi-SNP model with FA (p=1.0×10⁻⁵, critical p-value of 0.023 to pass FDR at q=0.05) in 46.7% of voxels of the CHOL FA mask in the IC, CC, and the IFOF and/or ILF (Figure 3).
Figure 3.
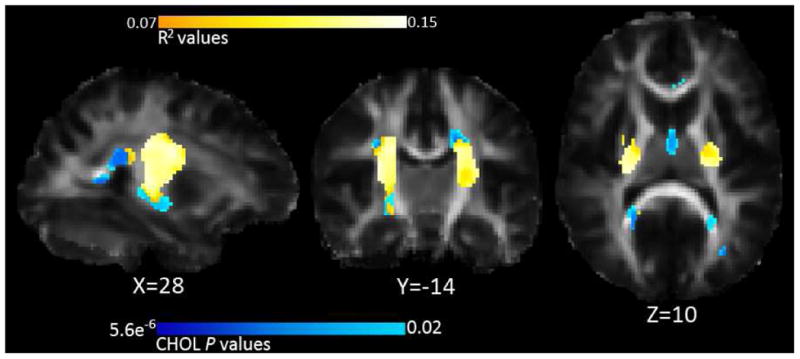
Multi-SNP results: Associations between FA and SNPs linked with CHOL. R2 values are combined predictive value of our SNPs, white areas are areas with higher R2 values, as shown by the color bar. The blue underlay corresponds to the p-values of the CHOL analysis; these were used to define a search region for the multi-SNP analysis. Thus, blue regions visible represent the only regions of the CHOL FA mask where the multi-SNP analysis did not find significant associations. Left in the image is right in the brain, coordinates are in MNI space.
The critical p-value is the highest threshold that controls the FDR, and higher critical p-values (closer to 0.05) denote stronger effects. The multi-SNP analysis shows the proportion of variance (R2) in FA explained by our SNP panel. We generated p-maps for the individual associations with FA for each SNP, simultaneously co-varying for the effects of the other SNPs. rs5882 of CETP individually survived multiple comparisons correction across all voxels using FDR at q=0.05 individually (minimum voxelwise p-value = 6.5×10⁻⁷, critical p-value = 0.033). for the main multi-SNP analysis, only one statistical test is completed so no further correction is necessary for the number of SNPs– that is built into the analysis. For the individual SNP analyses, however, we corrected for both the number of voxels tested and the number of SNPs tested. Even so, rs5882 in CETP was statistically significant at the new more stringent significance threshold (p-value = 7.6×10⁻⁷).
Candidate Gene Analyses
After identifying candidate gene CETP (rs5882) from the multi-SNP analysis, we performed individual voxel-wise examinations of rs5882 G-allele dosage on thresholded FA, Dax, Dmean, and Drad maps of the entire brain (not restricted to the areas associated with CHOL). In the QTIM sample (young healthy adults), increased rs5882 risk (G) allele dosage was significantly associated with higher FA (minimum voxelwise p-value = 9.4×10⁻⁸, critical p-value=0.019) bilaterally in the internal capsule (IC), splenium of the corpus callosum (SP), arcuate fasciculus (AF), and areas corresponding to the uncinate (UNC), inferior longitudinal fasciculus (ILF), and/or inferior fronto-occipital fasciculus (IFOF) (Figure 4a). Higher rs5882 risk allele dosage was also associated with lower Drad and Dmean (Supplementary Figure 3)
Figure 4.
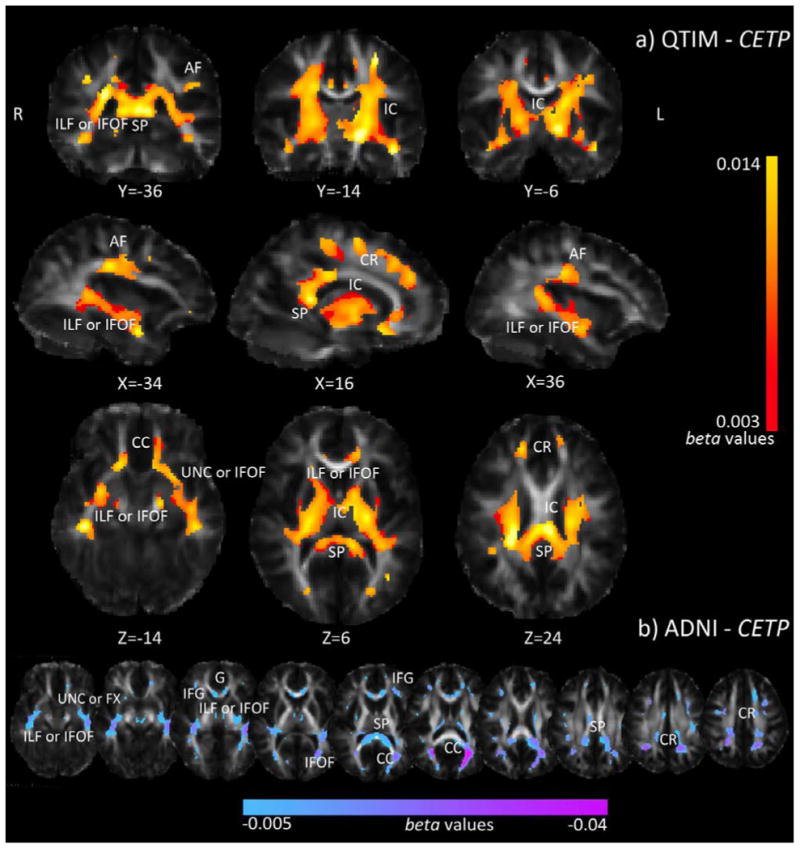
Association between whole brain voxel-wise FA and CETP (rs5882) risk allele dosage in the QTIM and ADNI samples. In QTIM (a), increased G-allele dosage was associated with higher FA in statistically significant regions. Yellow corresponds to stronger b-values (more positive). In ADNI (b), increased G-allele dosage was associated with lower FA in statistically significant regions. Pink corresponds to stronger beta-values (more negative). Only areas surviving FDR across the brain are shown. CR=corona radiata, CC=corpus callosum, IC=internal capsule, IFG=inferior frontal gyrus, G=genu, SP=splenium, AF=arcuate fasciculus, IFOF=inferior fronto-occipital fasciculus, UNC=uncinate, ILF=inferior longitudinal fasciculus, FX=fornix. Left in the image is right in the brain, coordinates are in MNI space.
Follow-up analysis in the Alzheimer's Disease Neuroimaging Initiative
As rs5882 showed broad associations in the white matter tracts of healthy young adults (QTIM; mean age 23.8, SD=2.4), we searched for effects of this SNP in late life by analyzing rs5882 allele-dosage dependent voxel-wise associations with measures of WM over the whole thresholded brain images in ADNI (mean age 74.3, SD=7.3). Risk (G) allele dosage of rs5882 was associated with lower FA (p=4.5×10⁻⁶, critical p-value=0.0019) in the IFG, CC (forceps major), SP, CR, and regions corresponding to the ILF, IFOF, UNC, and/or FX (Figure 4b). This pattern was directionally opposite of our QTIM findings, but agrees with prior reports that A-allele dosage associates with greater baseline thickness and less atrophy in elderly APOE4 non-carriers (Murphy et al, 2012). rs5882 risk allele dosage was also associated with higher Drad and Dmean (Supplementary Figure 4). CETP and APOE interact (Arias-Vasquez et al., 2007; Murphy et al, 2012), so we also ran the analysis co-varying for APOE status. rs5882 risk allele dosage continued to show negative associations with FA.
Discussion
In this study, we set out to further our understanding of the relationship between cholesterol, genetics, and the brain in young and old individuals. We found significant associations between elevated total adolescent cholesterol (CHOL) and high-density lipoprotein (HDL) levels and higher fractional anisotropy (FA) measured from DTI images acquired during early adulthood (QTIM). Ensuing analyses with other diffusivity measures suggested that higher cholesterol levels are indeed associated with greater WM integrity. We also found that cholesterol genes were associated with FA in these young adults in regions with substantial overlap to serum cholesterol measures. One SNP, rs5882 of CETP, independently held significant associations with DTI metrics, showing differential effects in younger and older populations (ADNI).
Changes in MRI signal, as detected by fractional anisotropy, can be attributed to a number of physiological factors including edema, demyelination, and inflammation (Assaf & Pasternak, 2008; Thomason & Thompson, 2011). The different processes contributing to significant signal change can potentially be distinguished by investigating the different diffusivity maps generated in DTI studies (Assaf & Pasternak, 2008). We performed our analyses with multiple DTI-derived measures (fractional anisotropy and axial, radial, and mean diffusivities) to provide a clearer picture of the white matter microstructural differences identified. Some interpretations of these metrics have been verified in postmortem analyses and animal model studies, and Drad has shown specific utility for assessment of myelination (Song et al., 2005). For a full explanation of DTI-derived measures, see the Methods section.
In voxel based analyses, presence of gray matter, white matter, and cerebrospinal fluid within a single voxel will lead to partial voluming (Lee et al., 2009). This effect is amplified in scans acquired with larger slice thicknesses - or greater voxel size. By limiting our statistical tests to regions where the template showed an FA greater than 0.25 (0.2 for the older cohort), we attempted to limit our analyses to highly probable white matter voxels where partial voluming plays a minimal role. However, due to voxel sizes much larger than axonal bundles, partial voluming remains an inherent limitation in current DTI analyses.
The bulk of cholesterol biosynthesis during brain maturation is produced for myelin development (Morell & Jurevics, 1996), and myelination continues well into adulthood. Only recently has imaging been used to examine associations between serum cholesterol levels and brain structure in vivo. To our knowledge, our paper is the first to examine such associations in young adults. Elevated CHOL and HDL measured during adolescence were associated with greater FA levels and, more specifically, lower Drad in young adults. Higher cholesterol levels in early life may be associated with more robust myelination and greater progression along the WM developmental trajectory, contributing to greater WM microstructural integrity. Due to the lack of measured cholesterol levels in the cohort of older adults (ADNI), cholesterol analyses were only performed on the QTIM dataset.
Serum cholesterol levels increase nearly linearly from adolescence through mid-life at a rate of 2.29 mg/dL (0.06 mmol/L) (Keys et al., 1950). As all participants were healthy, little deviation from this trend is expected. Due to the linear relationship, durations between serum collection (average age 15.2 ± 2.3 years) and scan time will be almost exclusively correlated with age at the time of the scan (average age 23.8 ±2.0 years) and therefore is not modeled separately.
While statistically significant associations between CHOL/HDL and FA were detected in broad WM regions in the young adults, cholesterol may simply have a more generalized effect on WM throughout the brain. Associations between cholesterol levels and fractional anisotropy (FA) are conventionally shown for regions where the estimated effect size (EES) for a set of voxels exceeds that expected by chance (FDR thresholded at q = 0.05). Thus, any inference about where the association is detected does not imply that the effects are not present elsewhere in the brain (Jernigan et al., 2003). Lack of standardization in the brain's arterial supply (Tatu et al., 1996), differences in age of maturation of different white matter regions (Tamnes et al., 2010), and other anatomical variability may, in part, contribute to the detectability of a statistical association in any brain region.
Cholesterol concentration is influenced by genetics, so we performed a voxel-wise joint multi-SNP analysis on brain regions significantly associated with CHOL in the young adults. Several AD risk genes overlap with those that may increase a person's risk for high serum cholesterol (Arias-Vasquez et al., 2007; Rodriguez-Rodriguez et al., 2009; Solfrizzi et al., 2002; Wollmer et al., 2003). Alzheimer's disease (AD) pathology is marked by a global cognitive decline (Moseley, 2002) and by alterations in various WM structures of the brain (Bartzokis et al., 2003; Bozzali et al., 2002; Brun & Englund, 1986; Rose et al., 2000), with lower FA observed in AD patients versus healthy controls (Parente et al., 2008; Rose et al., 2008; Takahashi et al., 2002). DTI metrics have even detected changes in the WM microstructure between healthy elderly and patients with mild cognitive impairment (MCI) (Bosch et al., 2012; Ukmar et al., 2008), indicating the utility of mapping the effects of risk-variants before the onset of disease. As thousands of SNPs are implicated in the cholesterol metabolizing pathway, we narrowed our search to a panel of 18 cholesterol related SNPs previously associated with Alzheimer's disease risk, which have known neurological involvement. Significant associations were detected between this set of genes and FA, suggesting that variations in the cholesterol-metabolizing pathway influence WM microstructure. These genes may affect the local concentration of cholesterol available to oligodendrocytes, as CNS myelination is hindered when cholesterol synthesis is impaired in oligodendrocytes (Saher et al., 2005).
The multi-SNP analysis also identified the variant of the cholesterol-related genes with the largest influence on FA - CETP (rs5582). The role of CETP (cholesteryl ester transfer protein) in plasma has been extensively studied (Ruggeri, 2005), but its role in the brain is less well understood. CETP protein product is detectable in cerebrospinal fluid (Tall, 1993), suggesting that the gene influences the cholesterol concentration available to the brain. CETP mediates transfer of cholesteryl esters from HDL to LDL and other lipoproteins and promotes subsequent uptake by the cell (Inazu et al., 1990). CETP rs5882 (I405V) represents an A to G variation, which encodes valine in place of isoleucine. Risk (G) allele homozygotes show significantly lower CETP and higher HDL levels (Arias-Vasquez et al., 2007; Asselbergs et al., 2012).
In young adults, the rs5882 risk-allele dosage, assessed additively, was broadly associated with higher FA: risk (G-allele) homozygotes had higher FA than A-allele homozygotes and heterozygotes. Significantly lower radial diffusivity and mean diffusivity were also observed with increasing risk-allele dosage. Thus, the rs5882 I405V variant may lead to greater myelination and axonal integrity during brain development. As higher cholesterol levels are essential for maturation, abundant or elevated HDL levels may serve a critical role in the development of heavily myelinated white matter fibers. Turley et al. (1996) suggest that LDL cholesterol plays little to no role in the sterol acquiring process of the developing brain, and, in our own analysis, LDL-c failed to show significant associations with DTI correlates of white matter microstructure in young adults.
While elevated cholesterol levels may support brain development, higher cholesterol later in life may be detrimental to the brain. As well as increasing risk for degenerative brain disease (Refolo et al., 2000), hypercholesterolemia also contributes to higher risk for developing cerebrovascular disorders (Kaste & Koivisto, 1988), including dysfunction of the blood brain barrier (Kalayci et al., 2009). Prior studies have found negative associations between serum cholesterol measures and FA in older individuals (Cohen et al., 2011; Williams et al., 2013) (average age of participants = 58.3±1.2 and 68.0±9.4 years, respectively). As Cohen et al. analyzed the effects of “abnormal cholesterol” (high HDL, low LDL, and/or statin use), we cannot directly relate our findings to their results. Contrary to results from our younger cohort, Williams and colleagues reported that greater HDL was associated with lower FA in an older group. Although serum cholesterol information is not available for the older participants evaluated from ADNI, we found that rs5882 risk-allele dosage (associated with higher HDL (Asselbergs et al., 2012)) was associated with lower FA and higher Drad and Dmean, suggesting lower WM microstructural integrity. Higher Drad may be indicative of lower levels of myelination.
Some WM regions where FA associations with serum cholesterol levels were detected (genu of the corpus callosum, inferior longitudinal fasciculus) are among the earliest and most rapidly changing WM tracts (Lebel et al., 2008), suggesting that WM microstructure in these areas may be more susceptible to cholesterol concentration present during this crucial developmental period. While many different models describe the underlying association between WM and AD (Bartzokis, 2011; Nir et al., 2013), WM atrophy is often attributed, in part, to Wallerian degeneration and may be secondary to gray matter loss (Bozzali et al., 2002). Axonal integrity of the splenium of the corpus callosum (SP), among other regions, is lower in AD patients (Chua et al., 2008). Associations between cholesterol-gene CETP risk-allele dosage and WM were found in the SP of young, healthy adults, suggesting that there may be a genetic component influencing these changes long before the onset of disease or age-related degeneration. Validation of our findings and proof of differential effects across brain regions would require a more focused study of cholesterol throughout development or a longitudinal assessment of cognitive impairment, which are beyond the scope of this work.
In summary, while previous studies showed associations between serum cholesterol levels and brain structure in older adults, this study may be the first to suggest that higher cholesterol levels are associated with greater white matter microstructural integrity in young adults. Cholesterol-related genetic variants predicted FA in nearly half of these WM regions associated with serum cholesterol. As serum cholesterol is essentially separated from brain cholesterol, these genes may also act in the brain to affect the local cholesterol microenvironment and, as a result, WM integrity. rs5882 risk (G) allele dosage showed opposite directional associations in two groups of participants most likely due to age differences in the cohorts, predicting significantly higher WM integrity in young adults and lower WM integrity in old adults. Since this specific variant forms a gene product that promotes elevated HDL, high HDL may be beneficial during WM development and detrimental later in life. Additional cohorts are needed to provide further evidence that the association is not a false positive.
The relationship between cholesterol and the brain is important for understanding the healthy aging process and pathology. When cholesterol available to the brain is reduced during development, white matter maturation is significantly affected. Lower white matter integrity could lead to slower signaling and impaired cognitive function, specifically in tasks requiring rapid decision and movement times (Muldoon et al., 1997). Late-life hypercholesterolemia, by contrast, is associated with cognitive decline (Elias et al., 2005; Solomon et al., 2009) and higher risk for late-onset AD in several studies (Reid et al., 2007; Sparks, 1997). Optimal cholesterol levels in the brain change over the lifespan, so some cholesterol-related genetic variations may be beneficial to white matter microstructural integrity early in life and detrimental later. Future longitudinal research is required to further elucidate how the favorable range of cholesterol levels changes throughout life and how these changes affect the brain. Study of the detrimental affects of unfavorable cholesterol levels may help us understand genetic risk decades before disease onset and may even lead to the development of novel therapeutic targets.
Supplementary Material
Highlights.
We performed the first brain mapping study of serum cholesterol in young adults.
Higher cholesterol was significantly associated with higher white matter integrity.
Cholesterol genes jointly predicted WM integrity in cholesterol-associated regions.
CETP (rs5882) was significantly associated with higher WM integrity in young adults.
CETP WM associations were detected in the opposite direction in late-life.
Acknowledgments
This study was supported by the National Institute of Child Health and Human Development (R01 HD050735), and the National Health and Medical Research Council (NHMRC 486682, 1009064), Australia. Genotyping was supported by NHMRC (389875). Additional support for algorithm development was provided by NIH R01 grants EB008432, EB008281, EB007813, P41RR013642, and 5R01MH094343. ED was funded, in part, by an NIH Training Grant in Neurobehavioral Genetics (T32 MH073526-06). The Alzheimer's Disease Neuroimaging Initiative (ADNI) was supported by public and private funding sources, found at (http://www.adni-info.org/Scientists/ADNISponsorsAndPartners.aspx).
Footnotes
Author Disclosure Statement: The authors have no competing financial interests.
Publisher's Disclaimer: This is a PDF file of an unedited manuscript that has been accepted for publication. As a service to our customers we are providing this early version of the manuscript. The manuscript will undergo copyediting, typesetting, and review of the resulting proof before it is published in its final citable form. Please note that during the production process errors may be discovered which could affect the content, and all legal disclaimers that apply to the journal pertain.
References
- Annett M. A classification of hand preference by association analysis. Br J Psychol. 1970;61(3):303–321. doi: 10.1111/j.2044-8295.1970.tb01248.x. [DOI] [PubMed] [Google Scholar]
- Arias-Vasquez A, Isaacs A, Aulchenko YS, Hofman A, Oostra BA, Breteler M, et al. The cholesteryl ester transfer protein (CETP) gene and the risk of Alzheimer's disease. Neurogenetics. 2007;8(3):189–193. doi: 10.1007/s10048-007-0089-x. [DOI] [PubMed] [Google Scholar]
- Assaf Y, Pasternak O. Diffusion tensor imaging (DTI)-based white matter mapping in brain research: a review. J Mol Neuro. 2008;34(1):51–61. doi: 10.1007/s12031-007-0029-0. [DOI] [PubMed] [Google Scholar]
- Asselbergs FW, Guo Y, van Iperen EP, Sivapalaratnam S, Tragante V, Lanktree MB, et al. Large-scale gene-centric meta-analysis across 32 studies identifies multiple lipid loci. Am J Hum Genet. 2012;91(5):823–838. doi: 10.1016/j.ajhg.2012.08.032. [DOI] [PMC free article] [PubMed] [Google Scholar]
- Asselbergs FW, Lovering RC, Drenos F. Progress in genetic association studies of plasma lipids. Curr Opin Lipidol. 2013;24(2):123–128. doi: 10.1097/MOL.0b013e32835df2d6. [DOI] [PMC free article] [PubMed] [Google Scholar]
- Astarita G, Jung KM, Berchtold NC, Nguyen VQ, Gillen DL, Head E, et al. Deficient liver biosynthesis of docosahexaenoic acid correlates with cognitive impairment in Alzheimer's disease. PLoS One. 2010;5(9):e12538. doi: 10.1371/journal.pone.0012538. [DOI] [PMC free article] [PubMed] [Google Scholar]
- Aukema EJ, Caan MW, Oudhuis N, Majoie CB, Vos FM, Reneman L, et al. White matter fractional anisotropy correlates with speed of processing and motor speed in young childhood cancer survivors. Int J Radiat Oncol Biol Phys. 2009;74(3):837–843. doi: 10.1016/j.ijrobp.2008.08.060. [DOI] [PubMed] [Google Scholar]
- Bartzokis G. Alzheimer's disease as homeostatic responses to age-related myelin breakdown. Neurobiology of aging. 2011;32(8):1341–1371. doi: 10.1016/j.neurobiolaging.2009.08.007. [DOI] [PMC free article] [PubMed] [Google Scholar]
- Bartzokis G, Cummings JL, Sultzer D, Henderson VW, Nuechterlein KH, Mintz J. White matter structural integrity in healthy aging adults and patients with Alzheimer disease: a magnetic resonance imaging study. Arch Neurol. 2003;60(3):393–398. doi: 10.1001/archneur.60.3.393. [DOI] [PubMed] [Google Scholar]
- Bartzokis G, Sultzer D, Lu PH, Nuechterlein KH, Mintz J, Cummings JL. Heterogeneous age-related breakdown of white matter structural integrity: implications for cortical “disconnection” in aging and Alzheimer's disease. Neurobiol Aging. 2004;25(7):843–851. doi: 10.1016/j.neurobiolaging.2003.09.005. [DOI] [PubMed] [Google Scholar]
- Barysheva M, Jahanshad N, Foland-Ross L, Altshuler LL, Thompson PM. White matter microstructural abnormalities in bipolar disorder: A whole brain diffusion tensor imaging study. NeuroImage: Clinical. 2013;2:558–568. doi: 10.1016/j.nicl.2013.03.016. [DOI] [PMC free article] [PubMed] [Google Scholar]
- Baum L, Chen L, Masliah E, Chan YS, Ng HK, Pang CP. Lipoprotein lipase mutations and Alzheimer's disease. Am J Med Genet. 1999;88(2):136–139. doi: 10.1002/(sici)1096-8628(19990416)88:2<136::aid-ajmg8>3.0.co;2-d. [DOI] [PubMed] [Google Scholar]
- Beaulieu C. The basis of anisotropic water diffusion in the nervous system - a technical review. NMR Biomed. 2002;15(7-8):435–455. doi: 10.1002/nbm.782. [DOI] [PubMed] [Google Scholar]
- Beaulieu C, Allen PS. Water diffusion in the giant axon of the squid: implications for diffusion-weighted MRI of the nervous system. Magn Reson Med. 1994;32(5):579–583. doi: 10.1002/mrm.1910320506. [DOI] [PubMed] [Google Scholar]
- Benton D. Do low cholesterol levels slow mental processing? Psychosom Med. 1995;57(1):50–53. doi: 10.1097/00006842-199501000-00008. [DOI] [PubMed] [Google Scholar]
- Bosch B, Arenaza-Urquijo EM, Rami L, Sala-Llonch R, Junqué C, Solé-Padullés C, Bartrés-Faz D. Multiple DTI index analysis in normal aging, amnestic MCI and AD. Relationship with neuropsychological performance. Neurobiol Aging. 2012;33(1):61–74. doi: 10.1016/j.neurobiolaging.2010.02.004. [DOI] [PubMed] [Google Scholar]
- Bozzali M, Falini A, Franceschi M, Cercignani M, Zuffi M, Scotti G, et al. White matter damage in Alzheimer's disease assessed in vivo using diffusion tensor magnetic resonance imaging. J Neurol Neurosurg Psychiatry. 2002;72(6):742–746. doi: 10.1136/jnnp.72.6.742. [DOI] [PMC free article] [PubMed] [Google Scholar]
- Brun A, Englund E. A white matter disorder in dementia of the Alzheimer type: a pathoanatomical study. Ann Neurol. 1986;19(3):253–262. doi: 10.1002/ana.410190306. [DOI] [PubMed] [Google Scholar]
- Chiang MC, Barysheva M, Shattuck DW, Lee AD, Madsen SK, Avedissian C, et al. Genetics of brain fiber architecture and intellectual performance. J Neurosci. 2009;29(7):2212–2224. doi: 10.1523/JNEUROSCI.4184-08.2009. [DOI] [PMC free article] [PubMed] [Google Scholar]
- Chua TC, Wen W, Slavin MJ, Sachdev PS. Diffusion tensor imaging in mild cognitive impairment and Alzheimer's disease: a review. Current Opin Neurol. 2008;21(1):83–92. doi: 10.1097/WCO.0b013e3282f4594b. [DOI] [PubMed] [Google Scholar]
- Derouesne C, Thibault S, Lagha Pierucci S, Baudouin Madec V, Ancri D, Lacomblez L. Decreased awareness of cognitive deficits in patients with mild dementia of the Alzheimer type. Int J Geriatr Psychiatry. 1999;14(12):1019–1030. [PubMed] [Google Scholar]
- Dietschy JM, Turley SD. Thematic review series: brain Lipids. Cholesterol metabolism in the central nervous system during early development and in the mature animal. J Lipid Res. 2004;45(8):1375–1397. doi: 10.1194/jlr.R400004-JLR200. [DOI] [PubMed] [Google Scholar]
- Dzamko N, Alessi DR, Birk OS. Enzyme may be responsible for regulating deleterious effects of Alzheimer's disease in the brain. Future Neurology. 2011;6(1):9–11. [Google Scholar]
- Elias PK, Elias MF, D'Agostino RB, Sullivan LM, Wolf PA. Serum cholesterol and cognitive performance in the Framingham Heart Study. Psychosom Med. 2005;67(1):24–30. doi: 10.1097/01.psy.0000151745.67285.c2. [DOI] [PubMed] [Google Scholar]
- Grieve SM, Williams LM, Paul RH, Clark CR, Gordon E. Cognitive aging, executive function, and fractional anisotropy: a diffusion tensor MR imaging study. AJNR Am J Neuroradiol. 2007;28(2):226–235. [PMC free article] [PubMed] [Google Scholar]
- Gustafsen C, Glerup S, Pallesen LT, Olsen D, Andersen OM, Nykjaer A, et al. Sortilin and SorLA display distinct roles in processing and trafficking of amyloid precursor protein. J Neurosci. 2013;33(1):64–71. doi: 10.1523/JNEUROSCI.2371-12.2013. [DOI] [PMC free article] [PubMed] [Google Scholar]
- Hüppi PS, Dubois J. Seminars in Fetal and Neonatal Medicine. 6. Vol. 11. WB Saunders; 2006. Dec, Diffusion tensor imaging of brain development; pp. 489–497. [DOI] [PubMed] [Google Scholar]
- Ikeda T, Yamada M. Risk factors for Alzheimer's disease. Brain Nerve. 2010;62(7):679–690. [PubMed] [Google Scholar]
- Inazu A, Brown ML, Hesler CB, Agellon LB, Koizumi J, Takata K, et al. Increased high-density lipoprotein levels caused by a common cholesteryl-ester transfer protein gene mutation. N Engl J Med. 1990;323(18):1234–1238. doi: 10.1056/NEJM199011013231803. [DOI] [PubMed] [Google Scholar]
- Jahanshad N, Kochunov PV, Sprooten E, Mandl RC, Nichols TE, Almasy L, et al. Multi-site genetic analysis of diffusion images and voxelwise heritability analysis: a pilot project of the ENIGMA-DTI working group. Neuroimage. 2013;81:455–469. doi: 10.1016/j.neuroimage.2013.04.061. [DOI] [PMC free article] [PubMed] [Google Scholar]
- Jahanshad N, Kohannim O, Hibar DP, Stein JL, McMahon KL, de Zubicaray GI, et al. Brain structure in healthy adults is related to serum transferrin and the H63D polymorphism in the HFE gene. Proc Natl Acad Sci U S A. 2012;109(14):E851–859. doi: 10.1073/pnas.1105543109. [DOI] [PMC free article] [PubMed] [Google Scholar]
- Jernigan TL, Gamst AC, Fennema-Notestine C, Ostergaard AL. More “mapping” in brain mapping: statistical comparison of effects. Hum Brain Mapp. 2003;19(2):90–95. doi: 10.1002/hbm.10108. [DOI] [PMC free article] [PubMed] [Google Scholar]
- Jin Y, Shi Y, Joshi SH, Jahanshad N, Zhan L, De Zubicaray GI, Thompson PM. Multimodal Brain Image Analysis. Springer Berlin Heidelberg; 2011. Heritability of white matter fiber tract shapes: a HARDI study of 198 twins; pp. 35–43. [DOI] [PMC free article] [PubMed] [Google Scholar]
- Kalayci R, Kaya M, Uzun H, Bilgic B, Ahishali B, Arican N, et al. Influence of hypercholesterolemia and hypertension on the integrity of the blood-brain barrier in rats. Int J Neurosci. 2009;119(10):1881–1904. doi: 10.1080/14647270802336650. [DOI] [PubMed] [Google Scholar]
- Kang HM, Zaitlen NA, Wade CM, Kirby A, Heckerman D, Daly MJ, et al. Efficient control of population structure in model organism association mapping. Genetics. 2008;178(3):1709–1723. doi: 10.1534/genetics.107.080101. [DOI] [PMC free article] [PubMed] [Google Scholar]
- Kaste M, Koivisto P. Risk of brain infarction in familial hypercholesterolemia. Stroke. 1988;19(9):1097–1100. doi: 10.1161/01.str.19.9.1097. [DOI] [PubMed] [Google Scholar]
- Keys A, Mickelsen O, Miller EV, Hayes ER, Todd RL. The concentration of cholesterol in the blood serum of normal man and its relation to age. J Clin Invest. 1950;29(10):1347. doi: 10.1172/JCI102372. [DOI] [PMC free article] [PubMed] [Google Scholar]
- Klingberg T, Hedehus M, Temple E, Salz T, Gabrieli JD, Moseley ME, et al. Microstructure of temporo-parietal white matter as a basis for reading ability: evidence from diffusion tensor magnetic resonance imaging. Neuron. 2000;25(2):493–500. doi: 10.1016/s0896-6273(00)80911-3. [DOI] [PubMed] [Google Scholar]
- Kochunov P, Coyle T, Lancaster J, Robin DA, Hardies J, Kochunov V, et al. Processing speed is correlated with cerebral health markers in the frontal lobes as quantified by neuroimaging. Neuroimage. 2010;49(2):1190–1199. doi: 10.1016/j.neuroimage.2009.09.052. [DOI] [PMC free article] [PubMed] [Google Scholar]
- Kohannim O, Jahanshad N, Braskie MN, Stein JL, Chiang MC, Reese AH, et al. Predicting white matter integrity from multiple common genetic variants. Neuropsychopharmacology. 2012;37(9):2012–2019. doi: 10.1038/npp.2012.49. [DOI] [PMC free article] [PubMed] [Google Scholar]
- Kysenius K, Muggalla P, Matlik K, Arumae U, Huttunen HJ. PCSK9 regulates neuronal apoptosis by adjusting ApoER2 levels and signaling. Cell Mol Life Sci. 2012;69(11):1903–1916. doi: 10.1007/s00018-012-0977-6. [DOI] [PMC free article] [PubMed] [Google Scholar]
- Lamsa R, Helisalmi S, Herukka SK, Tapiola T, Pirttila T, Vepsalainen S, et al. Genetic study evaluating LDLR polymorphisms and Alzheimer's disease. Neurobiol Aging. 2008;29(6):848–855. doi: 10.1016/j.neurobiolaging.2006.12.009. [DOI] [PubMed] [Google Scholar]
- Langers DR, Jansen JF, Backes WH. Enhanced signal detection in neuroimaging by means of regional control of the global false discovery rate. Neuroimage. 2007;38(1):43–56. doi: 10.1016/j.neuroimage.2007.07.031. [DOI] [PubMed] [Google Scholar]
- Langsted A, Freiberg JJ, Nordestgaard BG. Fasting and nonfasting lipid levels: influence of normal food intake on lipids, lipoproteins, apolipoproteins, and cardiovascular risk prediction. Circulation. 2008;118(20):2047–2056. doi: 10.1161/CIRCULATIONAHA.108.804146. [DOI] [PubMed] [Google Scholar]
- Le Bihan D, Mangin JF, Poupon C, Clark CA, Pappata S, Molko N, Chabriat H. Diffusion tensor imaging: concepts and applications. Journal of magnetic resonance imaging. 2001;13(4):534–546. doi: 10.1002/jmri.1076. [DOI] [PubMed] [Google Scholar]
- Lebel C, Walker L, Leemans A, Phillips L, Beaulieu C. Microstructural maturation of the human brain from childhood to adulthood. Neuroimage. 2008;40(3):1044–1055. doi: 10.1016/j.neuroimage.2007.12.053. [DOI] [PubMed] [Google Scholar]
- Lee JE, Chung MK, Lazar M, DuBray MB, Kim J, Bigler ED, Alexander AL. A study of diffusion tensor imaging by tissue-specific, smoothing-compensated voxel-based analysis. Neuroimage. 2009;44(3):870–883. doi: 10.1016/j.neuroimage.2008.09.041. [DOI] [PMC free article] [PubMed] [Google Scholar]
- Manolio TA, Ettinger WH, Tracy RP, Kuller LH, Borhani NO, Lynch JC, Fried LP. Epidemiology of low cholesterol levels in older adults. The Cardiovascular Health Study. Circulation. 1993;87(3):728–737. doi: 10.1161/01.cir.87.3.728. [DOI] [PubMed] [Google Scholar]
- Mauch DH, Nägler K, Schumacher S, Göritz C, Müller EC, Otto A, Pfrieger FW. CNS synaptogenesis promoted by glia-derived cholesterol. Science. 2001;294(5545):1354–1357. doi: 10.1126/science.294.5545.1354. [DOI] [PubMed] [Google Scholar]
- Minati L, Edginton T, Bruzzone MG, Giaccone G. Reviews: current concepts in alzheimer's disease: a multidisciplinary review. American J. Of Alzheimer's Dis. & Other Dementias. 2009;24(2):95–121. doi: 10.1177/1533317508328602. [DOI] [PMC free article] [PubMed] [Google Scholar]
- Mora S, Rifai N, Buring JE, Ridker PM. Fasting compared with nonfasting lipids and apolipoproteins for predicting incident cardiovascular events. Circulation. 2008;118(10):993–1001. doi: 10.1161/CIRCULATIONAHA.108.777334. [DOI] [PMC free article] [PubMed] [Google Scholar]
- Morell P, Jurevics H. Origin of cholesterol in myelin. Neurochem Res. 1996;21(4):463–470. doi: 10.1007/BF02527711. [DOI] [PubMed] [Google Scholar]
- Moseley M. Diffusion tensor imaging and aging–a review. NMR in Biomedicine. 2002;15(7-8):553–560. doi: 10.1002/nbm.785. [DOI] [PubMed] [Google Scholar]
- Mulder SD, Veerhuis R, Blankenstein MA, Nielsen HM. The effect of amyloid associated proteins on the expression of genes involved in amyloid-beta clearance by adult human astrocytes. Exp Neurol. 2012;233(1):373–379. doi: 10.1016/j.expneurol.2011.11.001. [DOI] [PubMed] [Google Scholar]
- Muldoon MF, Ryan CM, Matthews KA, Manuck SB. Serum cholesterol and intellectual performance. Psychosom Med. 1997;59(4):382–387. doi: 10.1097/00006842-199707000-00008. [DOI] [PubMed] [Google Scholar]
- Murphy EA, Roddey JC, McEvoy LK, Holland D, Hagler DJ, Jr, Dale AM, et al. CETP polymorphisms associate with brain structure, atrophy rate, and Alzheimer's disease risk in an APOE-dependent manner. Brain Imaging Behav. 2012;6(1):16–26. doi: 10.1007/s11682-011-9137-0. [DOI] [PMC free article] [PubMed] [Google Scholar]
- Natunen T, Helisalmi S, Vepsalainen S, Sarajarvi T, Antikainen L, Makinen P, et al. Genetic analysis of genes involved in amyloid-beta degradation and clearance in Alzheimer's disease. J Alzheimers Dis. 2012;28(3):553–559. doi: 10.3233/JAD-2011-111109. [DOI] [PubMed] [Google Scholar]
- Nir TM, Jahanshad N, Villalon-Reina JE, Toga AW, Jack CR, Weiner MW, et al. Effectiveness of Regional DTI Measures in Distinguishing Alzheimer's Disease, MCI and, Normal Aging. NeuroImage: Clinical. 2013;3:180–195. doi: 10.1016/j.nicl.2013.07.006. [DOI] [PMC free article] [PubMed] [Google Scholar]
- Page RM, Munch A, Horn T, Kuhn PH, Colombo A, Reiner O, et al. Loss of PAFAH1B2 reduces amyloid-beta generation by promoting the degradation of amyloid precursor protein C-terminal fragments. J Neurosci. 2012;32(50):18204–18214. doi: 10.1523/JNEUROSCI.2681-12.2012. [DOI] [PMC free article] [PubMed] [Google Scholar]
- Parente DB, Gasparetto EL, da Cruz LCH, Domingues RC, Baptista AC, Carvalho ACP, Domingues RC. Potential role of diffusion tensor MRI in the differential diagnosis of mild cognitive impairment and Alzheimer's disease. Am J Roentgenol. 2008;190(5):1369–1374. doi: 10.2214/AJR.07.2617. [DOI] [PubMed] [Google Scholar]
- Refolo LM, Menter B, LaFrancois J, Bryant-Thomas T, Wang R, Tint GS, et al. Hypercholesterolemia accelerates the Alzheimer's amyloid pathology in a transgenic mouse model. Neurobiol Dis. 2000;7(4):321–331. doi: 10.1006/nbdi.2000.0304. [DOI] [PubMed] [Google Scholar]
- Reid PC, Urano Y, Kodama T, Hamakubo T. Alzheimer's disease: cholesterol, membrane rafts, isoprenoids and statins. J Cell Mol Med. 2007;11(3):383–392. doi: 10.1111/j.1582-4934.2007.00054.x. [DOI] [PMC free article] [PubMed] [Google Scholar]
- Rodriguez-Rodriguez E, Mateo I, Infante J, Llorca J, Garcia-Gorostiaga I, Vazquez-Higuera JL, et al. Interaction between HMGCR and ABCA1 cholesterol-related genes modulates Alzheimer's disease risk. Brain Res. 2009;1280:166–171. doi: 10.1016/j.brainres.2009.05.019. [DOI] [PubMed] [Google Scholar]
- Rose SE, Chen F, Chalk JB, Zelaya FO, Strugnell WE, Benson M, et al. Loss of connectivity in Alzheimer's disease: an evaluation of white matter tract integrity with colour coded MR diffusion tensor imaging. J Neurol Neurosurg Psychiatry. 2000;69(4):528–530. doi: 10.1136/jnnp.69.4.528. [DOI] [PMC free article] [PubMed] [Google Scholar]
- Rose SE, Andrew L, Chalk JB. Gray and white matter changes in Alzheimer's disease: a diffusion tensor imaging study. J Magn Reson. 2008;27(1):20–26. doi: 10.1002/jmri.21231. [DOI] [PubMed] [Google Scholar]
- Roses AD, Lutz MW, Amrine-Madsen H, Saunders AM, Crenshaw DG, Sundseth SS, et al. A TOMM40 variable-length polymorphism predicts the age of late-onset Alzheimer's disease. Pharmacogenomics J. 2010;10(5):375–384. doi: 10.1038/tpj.2009.69. [DOI] [PMC free article] [PubMed] [Google Scholar]
- Ruggeri RB. Pharmacological Inhibition for the Modulation of Plasma Cholesterol Levels and Promising Target for the Prevention of Atherosclerosis. Current Topics in Medicinal Chemistry. 2005;5(3):257–264. doi: 10.2174/1568026053544506. [DOI] [PubMed] [Google Scholar]
- Saher G, Brugger B, Lappe-Siefke C, Mobius W, Tozawa R, Wehr MC, et al. High cholesterol level is essential for myelin membrane growth. Nat Neurosci. 2005;8(4):468–475. doi: 10.1038/nn1426. [DOI] [PubMed] [Google Scholar]
- Saher G, Simons M. Cholesterol and myelin biogenesis. Subcell Biochem. 2010;51:489–508. doi: 10.1007/978-90-481-8622-8_18. [DOI] [PubMed] [Google Scholar]
- Schaefer EJ, Audelin MC, McNamara JR, Shah PK, Tayler T, Daly JA, et al. Comparison of fasting and postprandial plasma lipoproteins in subjects with and without coronary heart disease. Am J Cardiol. 2001;88(10):1129–1133. doi: 10.1016/s0002-9149(01)02047-1. [DOI] [PubMed] [Google Scholar]
- Shobab LA, Hsiung GY, Feldman HH. Cholesterol in Alzheimer's disease. Lancet Neurol. 2005;4(12):841–852. doi: 10.1016/S1474-4422(05)70248-9. [DOI] [PubMed] [Google Scholar]
- Solfrizzi V, Panza F, D'Introno A, Colacicco AM, Capurso C, Basile AM, et al. Lipoprotein(a), apolipoprotein E genotype, and risk of Alzheimer's disease. J Neurol Neurosurg Psychiatry. 2002;72(6):732–736. doi: 10.1136/jnnp.72.6.732. [DOI] [PMC free article] [PubMed] [Google Scholar]
- Solomon A, Kareholt I, Ngandu T, Wolozin B, Macdonald SW, Winblad B, et al. Serum total cholesterol, statins and cognition in non-demented elderly. Neurobiol Aging. 2009;30(6):1006–1009. doi: 10.1016/j.neurobiolaging.2007.09.012. [DOI] [PubMed] [Google Scholar]
- Song SK, Sun SW, Ramsbottom MJ, Chang C, Russell J, Cross AH. Dysmyelination revealed through MRI as increased radial (but unchanged axial) diffusion of water. Neuroimage. 2002;17(3):1429–1436. doi: 10.1006/nimg.2002.1267. [DOI] [PubMed] [Google Scholar]
- Song SK, Yoshino J, Le TQ, Lin SJ, Sun SW, Cross AH, et al. Demyelination increases radial diffusivity in corpus callosum of mouse brain. Neuroimage. 2005;26(1):132–140. doi: 10.1016/j.neuroimage.2005.01.028. [DOI] [PubMed] [Google Scholar]
- Sparks DL. Coronary artery disease, hypertension, ApoE, and cholesterol: a link to Alzheimer's disease? Ann N Y Acad Sci. 1997;826:128–146. doi: 10.1111/j.1749-6632.1997.tb48466.x. [DOI] [PubMed] [Google Scholar]
- Takahashi S, Yonezawa H, Takahashi J, Kudo M, Inoue T, Tohgi H. Selective reduction of diffusion anisotropy in white matter of Alzheimer disease brains measured by 3.0 Tesla magnetic resonance imaging. Neurosci Lett. 2002;332(1):45–48. doi: 10.1016/s0304-3940(02)00914-x. [DOI] [PubMed] [Google Scholar]
- Tall AR. Plasma cholesteryl ester transfer protein. J Lipid Res. 1993;34(8):1255–1274. [PubMed] [Google Scholar]
- Tamnes CK, Ostby Y, Fjell AM, Westlye LT, Due-Tonnessen P, Walhovd KB. Brain maturation in adolescence and young adulthood: regional age-related changes in cortical thickness and white matter volume and microstructure. Cereb Cortex. 2010;20(3):534–548. doi: 10.1093/cercor/bhp118. [DOI] [PubMed] [Google Scholar]
- Tatu L, Moulin T, Bogousslavsky J, Duvernoy H. Arterial territories of human brain: brainstem and cerebellum. Neurology. 1996;47(5):1125–1135. doi: 10.1212/wnl.47.5.1125. [DOI] [PubMed] [Google Scholar]
- Thomason ME, Thompson PM. Diffusion imaging, white matter, and psychopathology. Annu Rev Clin Psychol. 2011;7:63–85. doi: 10.1146/annurev-clinpsy-032210-104507. [DOI] [PubMed] [Google Scholar]
- Tsivilis D, Vann SD, Denby C, Roberts N, Mayes AR, Montaldi D, Aggleton JP. A disproportionate role for the fornix and mammillary bodies in recall versus recognition memory. Nat Neurosci. 2008;11(7):834–842. doi: 10.1038/nn.2149. [DOI] [PubMed] [Google Scholar]
- Ukmar M, Makuc E, Onor ML, Garbin G, Trevisiol M, Cova MA. Evaluation of white matter damage in patients with Alzheimer's disease and in patients with mild cognitive impairment by using diffusion tensor imaging. Radiol Med. 2008;113(6):915–922. doi: 10.1007/s11547-008-0286-1. [DOI] [PubMed] [Google Scholar]
- Vuletic S, Jin LW, Marcovina SM, Peskind ER, Moller T, Albers JJ. Widespread distribution of PLTP in human CNS: evidence for PLTP synthesis by glia and neurons, and increased levels in Alzheimer's disease. J Lipid Res. 2003;44(6):1113–1123. doi: 10.1194/jlr.M300046-JLR200. [DOI] [PubMed] [Google Scholar]
- Waldstein S, Elias M. Neuropsychology of Cardiovascular Disease. Mahwah, N.J.: Lawrence Erlbaum Associates; 2001. [Google Scholar]
- Warnick GR, Knopp RH, Fitzpatrick V, Branson L. Estimating low-density lipoprotein cholesterol by the Friedewald equation is adequate for classifying patients on the basis of nationally recommended cutpoints. Clin Chem. 1990;36(1):15–19. [PubMed] [Google Scholar]
- Williams VJ, Leritz EC, Shepel J, McGlinchey RE, Milberg WP, Rudolph JL, et al. Interindividual variation in serum cholesterol is associated with regional white matter tissue integrity in older adults. Hum Brain Mapp. 2013;34(8):1826–1841. doi: 10.1002/hbm.22030. [DOI] [PMC free article] [PubMed] [Google Scholar]
- Wollmer MA, Streffer JR, Lutjohann D, Tsolaki M, Iakovidou V, Hegi T, et al. ABCA1 modulates CSF cholesterol levels and influences the age at onset of Alzheimer's disease. Neurobiol Aging. 2003;24(3):421–426. doi: 10.1016/s0197-4580(02)00094-5. [DOI] [PubMed] [Google Scholar]
- Xiao Z, Wang J, Chen W, Wang P, Zeng H, Chen W. Association studies of several cholesterol-related genes (ABCA1, CETP and LIPC) with serum lipids and risk of Alzheimer's disease. Lipids Health Dis. 2012;11:163. doi: 10.1186/1476-511X-11-163. [DOI] [PMC free article] [PubMed] [Google Scholar]
Associated Data
This section collects any data citations, data availability statements, or supplementary materials included in this article.