Abstract
Purpose
Recently developed simultaneous multislice echoplanar imaging (EPI) sequences permit imaging of the whole brain at short repetition time (TR), allowing the cardiac fluctuations to be fully sampled in blood-oxygen-level dependent functional MRI (BOLD fMRI). A novel low computational analytical method was developed to dynamically map the passage of the pulsation signal through the brain and visualize the whole cerebral vasculature affected by the pulse signal. This algorithm is based on a simple combination of fast BOLD fMRI and the scanner's own built-in pulse oximeter.
Methods
Multiple, temporally shifted copies of the pulse oximeter data (with 0.08 s shifting step and coverage of a 1-s span) were downsampled and used as cardiac pulsation regressors in a general linear model based analyses (FSL) of the fMRI data. The resulting concatenated z-statistics maps show the voxels that are affected as the cardiac signal travels through the brain.
Results
Many voxels were highly correlated with the pulsation regressor or its temporally shifted version. The dynamic and static cardiac pulsation maps obtained from both the task and resting state scans, resembled cerebral vasculature.
Conclusion
The results demonstrated: (i) cardiac pulsation significantly affects most voxels in the brain; (ii) combining fast fMRI and this analytical method can reveal additional clinical information to functional studies.
Keywords: multiband EPI, BOLD fMRI, cardiac pulsation, cerebral vasculature, correlation analysis
Introduction
The cardiac pulsation signal is generated by pressure from the heart in systole of approximately 1 Hz (in human adult) which moves by means of blood vessels (by expansion of the arterial blood vessel wall) throughout the body (1). In common functional MRI (fMRI) studies, it is considered as one of the major physiological components contained in the timecourse (2-5). The minimum repetition time (TR) achievable in whole-head fMRI scans using conventional echo-planar imaging (EPI) is 2 s or greater. As a result, the pulsation signal is aliased in the bloodoxygen-level dependent (BOLD) signal, thus obscuring the signal. There are many methods to remove aliased cardiac signals from BOLD data (2-5). However, few studies have attempted to use this natural biomarker (by tracking or mapping it) in the brain to assess the properties of the cerebral vasculature during fMRI studies.
We first demonstrated a novel method to track the cardiac pulsation signal in the brain in our previous work (6). We identified the dynamic propagation of the cardiac signal in the brain by cross-correlating the BOLD signal with the cardiac pulse signal generated by simultaneously recorded near infrared spectroscopy (NIRS; with sampling rate of 12.5 Hz). The most critical requirement for this technique is that the cardiac pulsation is sufficiently sampled by fMRI, which requires a TR of 0.5 s or smaller (2 Hz) to fully sample a regular heart rate based on the Nyquist-Shannon sampling theorem. We achieved the small TR (0.5 s) in the previous work by scanning the brain in a set of contiguous stacks of 9 slices (each stack was imaged for a full 6 min resting state scan), and then fusing these sections analytically. To cover the brain, we needed to scan 5 or 6 stacks (30-36 min) to cover the whole head at a 3.4 mm isotropic resolution. Thus, this method is not practical for routine use. However, recently developed multiband EPI sequences (7-10) dramatically decrease the minimum TR required for a whole brain scan, without having to compromise the quality of the BOLD images. Using a multiband acquisition, whole head coverage at TR=0.4 s can be performed routinely. Figure 1 shows the spectrum of a typical BOLD timecourse acquired using the multiband sequence (TR=0.4 s) in blue. For this participant, the cardiac pulsation (∼1 Hz) was fully sampled by the BOLD fMRI (a 0.4 s TR will accommodate heart rates up to 75 BPM; with newer versions of the sequence the TR can be reduced to 0.3, or 100 BPM). For comparison, we plotted in red the spectra pulse oximeter data of the same participant (recorded simultaneously by the Siemens’ built-in wireless device). The BOLD data fully captured the spectral features around the cardiac pulsation frequency as accurately as that by the oximeter (sampling rate: 50 Hz). Therefore, the multiband sequence allows us to track and map the cardiac pulsation propagation in the brain in one scan.
Fig. 1.
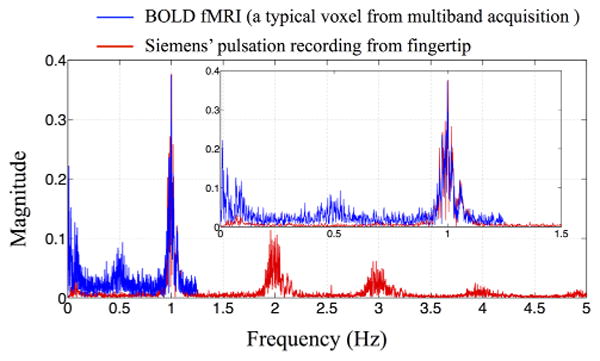
The spectra of the BOLD signal of one typical voxel (in blue) from multiband echo-planar image (EPI) sequence and of simultaneous recordings from the Siemens’ fingertip pulse oximeter (in red). The inset shows the enlarged section between 0 and 1.5 Hz. Each plot has been normalized to the cardiac amplitude. [Color figure can be viewed in the online issue, which is available at wileyonlinelibrary.com.]
In this work, we tested our method on resting state and task activation fMRI data acquired using a multiband sequence (TR=0.4 s). In addition our cardiac signal regressors were now simply generated from the data recorded simultaneously by the scanner's own built-in wireless pulse oximeter, instead of that from the external NIRS device as done in the previous work (6).
This method can be used as simple add-on analytical method to any existing functional study and offers information about the participant's cerebral conditions, which is highly attractive for functional studies on populations with potentially abnormal vasculature. The vascular information offered by this method may be critical in interpreting functional anomalies in the population.
In this work, we focused on using a physiological noise signal (i.e. cardiac pulsation) to map the cerebral vasculature in resting state fMRI acquired with a multiband EPI sequence. However, the direct impact of the multiband sequence on fMRI analyses is that this cardiac pulsation signal can be effectively removed from the fMRI data due to the much shorter TRs (TR=0.4 s). Here, we briefly demonstrate the impact of this application (denoising) on the resting state analyses.
Methods
Protocols and Instrumentation
fMRI resting state studies and block-design visual stimulation studies were conducted in five healthy participants (three male, two female, average age±SD, 37.2±11.4 years). In resting state studies, participants were asked to lie quietly in the scanner and view a gray screen with a fixation point in the center. The resting state scans lasted 360 s for two participants and 600 s for three participants for testing purposes. The visual stimulation consisted of four blocks with 20-s-long flashing checkerboard stimulus separated by 20 s of rest (viewing a gray screen with a fixation point in the center) for 180 s of imaging time. The Institutional Review Board at McLean Hospital approved the protocol and participants were compensated for their participation.
All MR data was acquired on a Siemens TIM Trio 3 Tesla (T) scanner (Siemens Medical Systems, Malvern, PA) using a 32-channel phased array head matrix coil. After acquiring a high resolution localizer image, [MPRAGE, repetition time/inversion time/echo time (TR/TI/TE)=2530/1100/3.31, 256 × 256 × 128 voxels over a 256 × 256 × 170 mm sagittal slab, GRAPPA factor of 2], multiband EPI (University of Minnesota sequence cmrr_mbep2d_bold R008) data were obtained with the following parameters: [450 (task), 900, or 1500 (resting state) time points, TR/TE=400/30 ms, flip angle 43 degrees, matrix=64 × 64 on a 220 × 220 mm field of view (FOV), multiband factor=6, thirty 3.0-mm slices with 0.5-mm gap parallel to the AC–PC (anterior commissure-posterior commissure) line extending down from the top of the brain. Physiological signals (pulse oximetry, and respiratory depth) were recorded continuously throughout the experiment using the scanner's built-in wireless fingertip pulse oximeter and respiratory belt at 50 Hz.
To verify the result, we performed three-dimensional (3D) velocity encoded phase contrast magnetic resonance angiography (PC-MRA: 0.8 × 0.8 × 0.9 mm voxels, velocity encodings of 30 and 75 cm/s) on one of the participants.
Data Analyses (Resting State)
Figure 2 shows the data processing flowchart for each individual participant for the resting state data. There are four steps leading toward generating the cerebrovascular cardiac pulsation map.
Fig. 2.
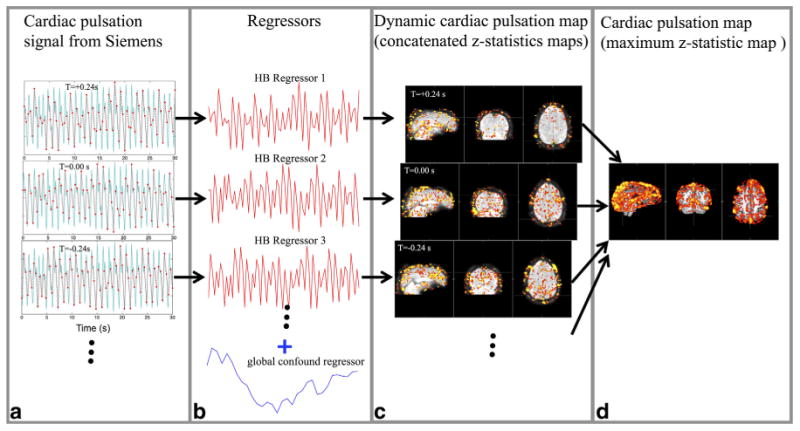
The flowchart of processing procedures for the data. The simultaneously recorded pulse oximeter data and its temporal shifted versions (only +0.24 and –0.24 s are shown here) were resampled based on the TR (TR=0.4 s) in (a) and the resulting cardiac regressors (in red) are shown in (b) with a global confound regressor (in blue; obtained by averaging data from all the voxels which serves the purpose of removing the low frequency global fluctuation). The corresponding z-statistic results are depicted in (c). The dynamic cardiac pulsation map was generated by temporally concatenating all the z-statistic maps according to their regressors’ temporal shifts. The cardiac pulsation map reflecting the cerebral vasculature is shown in (d), which was obtained by taking the maximum z-value for each voxel from the dynamic cardiac pulsation map. [Color figure can be viewed in the online issue, which is available at wileyonlinelibrary.com.]
The portion of the cardiac pulsation signal recorded from the Siemens fingertip pulse oximeter corresponding to the time of each MR acquisition (with a few seconds of padding before the beginning and after the scan) was extracted, and multiple time shifted copies were generated in 0.08-s steps. We considered time shift values covering the temporal range from –0.64 to +0.64 s in steps of 0.08 s, with respect to the unshifted signal. This is a sufficient temporal resolution to sample the dynamic pulsation signal as it propagates through the brain. The range of the time shifts were determined to be around 1 s, which is the maximum time needed for one cardiac pulsation to travel through the entire brain. Figure 2a shows examples of temporal traces from the pulse oximeter signal with three different time shifts (–0.24, 0.00, and 0.24 s) in light blue (only part of the temporal traces covering 0–30 s were shown for illustration purpose).
Each shifted trace was then resampled at 2.5 Hz (1/ 0.4 Hz) in accordance with the TR (0.4 s) to generate the cardiac regressor for fMRI analysis, as shown in Figure 2a. A global confound regressor was generated by averaging the BOLD temporal traces of all voxels. The global confound regressor was used to specifically remove the global low frequency signals (11). The corresponding cardiac regressors, as well as the global confound regressor are depicted in Figure 2b in red and blue, respectively. These steps were carried out in MATLAB (The Math-works, Natick, MA).
-
The resulting cardiac regressor, together with the global regressor were used in the general linear modal (GLM) based analysis of the resting state fMRI data. We used the analytical tool FEAT, as part of the FSL analysis package (FMRIB Expert Analysis Tool, v5.98, http://www.fmrib.ox.ac.uk/fsl, Oxford University, UK) (12). A total of 17 analyses were carried out using different time shifted cardiac regressors. The resulting z-statistics maps are shown in Figure 2c. These maps were concatenated (with fslmerge in FSL) over time to assess the dynamic flow of the cardiac signal through the brain (the “dynamic cardiac pulsation map”). They show the z-value as a function of delay time, which is proportional to the correlation coefficient. The peak value indicates the time lag with the maximum correlation, but the absolute magnitude depends on the noise variance in the voxel as well, leading to a wide variation in peak intensity with location. To make these maps more interpretable, these values need to be normalized. We do this by scaling the maximum value of the concatenated z-map at each significant voxel to be 1. Then, the normalized dynamic cardiac pulsation map was spatially smoothed (fslmaths–fmean) for better visualization (Fig. 3a).
For each participant, standard fMRI preprocessing steps [including motion correction, high pass filter (> 0.01 Hz), and slice time correction, spatial smoothing (5 mm)] were applied to the original BOLD data before further analysis.
The static cardiac pulsation map (i.e., the peak zvalue at every location) was obtained by performing a maximum intensity projection along the time axis (maximum zstatistic map) from the un-normalized concatenated z-map (fslmaths–Tmax). The map, shown in Figure 2d, depicts the full cerebral vasculature as marked by the propagation path of the pulsation signal.
Fig. 3.
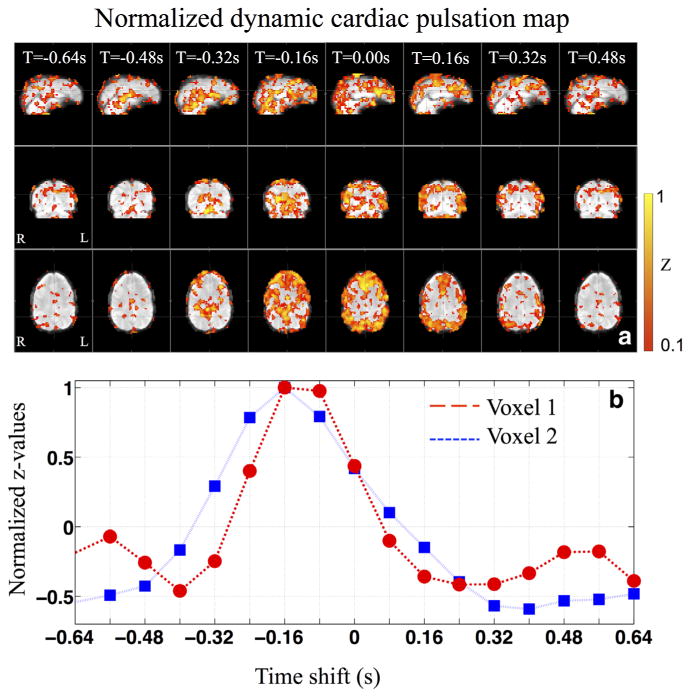
The normalized dynamic cardiac pulsation map at different temporal shifts (TS) in sagittal, coronal and axial view (a) and the normalized z-values calculated from two nearby voxels using temporally shifted regressors (b). The fMRI data from a resting state scan was used here. [Color figure can be viewed in the online issue, which is available at wileyonlinelibrary.com.]
Data Analyses (Task Activation: Visual Stimulation)
The processing steps depicted in Figure 2 were repeated for the fMRI data obtained during visual stimulation, with the difference that a task regressor (block diagram) was added to each analysis, in addition to the cardiac regressor and the global confound regressor. As a result, z-statistic maps of task activation (visual stimulation), and cardiac pulsation maps were calculated.
Display
To visualize individual results, we transformed the participant's z-statistic maps to his/her own structural scans (using FLIRT from the FSL toolbox). For the group average (five participants), we transformed the individual z-statistic map to the participant's own structural brain, averaged them and projected the averaged result to the MNI standard brain (FLIRT). To visualize the whole cerebral vasculature, we also rendered the results in 3D (fslview from the FSL toolbox) and displayed them with participant's own 3D-rendered structural images (or with the 3D rendered MNI image for the group result).
Denoising
For each participant, we simulated two sets of resting state data from the same multiband fMRI acquisition: (i) unfiltered data; (ii) filtered data. The unfiltered data is to simulate the fMRI data acquired with regular TR (TR=2 s). It was obtained by resampling the multiband data at every 2 s with no antialiasing, to simulate BOLD imaging at a longer TR. We obtained the filtered data by bandpass filtering (0.01–0.25 Hz using MATLAB; 0.25 Hz is the upper limit of the BOLD spectrum, when TR=2 s is used) the multiband data to remove the cardiac component first, then downsampling it at every 2 s for comparison. An independent component analysis (13) was applied on each simulated data set with dimensionality set to be 20. The resulting independent components (ICs) were compared with the resting state networks (RSNs) templates (14).
Results
As a result, we were able to map out the voxels that were on the propagation path of the cardiac pulsation signal through the brain. We created a detailed cerebrovascular map of the cardiac pulsation signal from the 6–10 min resting state data, with the most statistically significant voxels (z>5). For the first time, the same method was applied to the BOLD fMRI during task activation. In addition to the map of the task activation, a similar cerebrovascular map as that of the resting state analysis was obtained for the same participant. Therefore, we have demonstrated that, with a shorter TR (becoming widely available), using the built-in fingertip pulse oximeter (present in most research scanners) and the application of our method, people can obtain extra cerebrovascular information, such as cerebrovascular maps and dynamic cardiac pulsation maps, at no cost.
Figure 3 shows the typical normalized dynamic cardiac pulsation map in Figure 3a in the sagittal, coronal and axial view and the normalized z-values calculated from two nearby voxels in Figure 3b of one participant. The cardiac pulsation map was projected onto the participant's own structural brain. The dynamic cardiac pulsation map consists of eight frames covering time-shifts from –0.64 to +0.48 s with steps of 0.16 s (not all the results are displayed here). The pulsation signal seems to start at the center of the brain, where the arteries enter (time-shift=–0.48 s), and move outward toward the cortex. This is clearly displayed in the sagittal and coronal views of Figure 3a. In the axial view of Figure 3a, the evolution of the patterns is shown in more detail. It appears that the evolution of the patterns start from the center, reach the frontal areas at time shift –0.16 s, and the back of the brain at 0.16 s and then return to the center in the end. The traces in Figure 3b reflected typical changes in the z-values as result of the temporal shifts in the regressors. For the dynamic map, the important information (in each voxel) is the arrival time of the cardiac signal (peak position of the trace in Fig. 3b) and the length of its passage through this voxel (width of the trace in Fig. 3b), not the z-values themselves. On the contrary, high z-values (some z-values can be as high as 20) make it very hard to display the results and decrease the sensitivity of the dynamic map because voxels with high z-values stay activated much longer. Therefore, normalizing the z-values from each significant voxel (maximum z>3) is necessary.
The cardiac pulsation map (i.e., maximum z-statistic map) of the same subject is shown in Figure 4a from the resting state, many areas, mostly in the gray matter (high capillary density) and at the base of the brain (high artery density), are on the propagation path of this pulsation signal. To assess the sensitivity of the method, we plotted the distribution of the z-values from the cardiac pulsation map (Fig. 4a) in blue in Figure 4b. The distributions of z-values (Fig. 4b in blue) of the cardiac pulsation map (Fig. 4a) show that most of the voxels in the brain have significant z-values (z>2.3), indicating that most of the voxels in the brain are affected by the cardiac signal (or its time shifted version). However, to clearly visualize the main cerebral vasculature we chose the threshold of z to be 5 in Figure 4a. We will discuss the reason in the discussion.
Fig. 4.
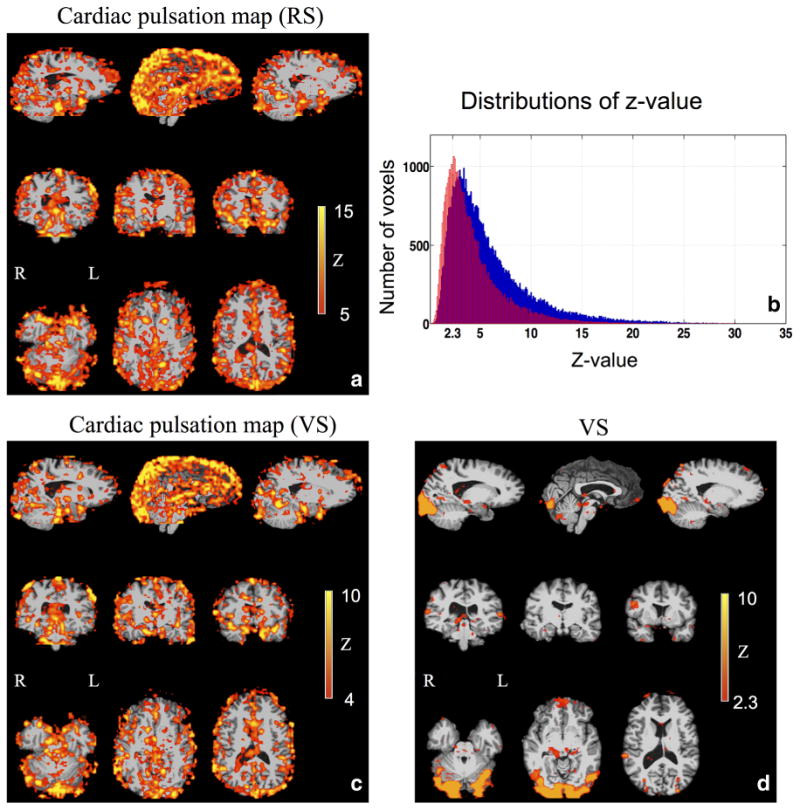
The static cardiac pulsation map calculated from resting state (RS) scan (a) and visual stimulation (VS) task (c) from the same participant are shown. The corresponding distributions of the z-values are depicted in blue and red respectively in (b). The activation map (z-statistic map) of a visual stimulation task is shown in (d).
Figure 4 also depicts a typical task activation map (Fig. 4d) and the corresponding simultaneous cardiac pulsation map (Fig. 4c) of the same participant (as in Fig. 4a for resting state) for comparison. Both maps were projected onto the participant's own structural brain. The activation to the checkerboard stimulus is mostly in the visual cortex, as shown in Figure 4d. The simultaneous cardiac pulsation map obtained using the same procedure as in Figure 2 is shown in Figure 4c. The map shows an almost identical pattern as that in Figure 4a, the one acquired on the same participant in resting state, with a spatial correlation of R=0.74 (fslcc from the FSL toolbox). The corresponding distribution of the z-values, as shown in red in Figure 4b, indicates similar results. It can be seen that most voxels, even during the task activation, are affected by the cardiac signal (or its time shifted version). However, compared with the results of the resting state study (in blue), the distribution moved toward lower z-values. The voxels significantly affected by the cardiac signal are less so in the task activation than in the resting state.
Figure 5 compares the 3D cardiac pulsation maps (top panel) from one participant, which were projected on the surfaces of the participant's own 3D brain (Fslview 3D rendering from FSL) with the participant's own PCMRA (lower panel). The blood vessels, which match those in the PC-MRA images (lower panel), can be identified in the cardiac pulsation maps. Because of the low spatial resolution in fMRI (3.5 × 3.5 × 3.5 mm), the blood vessels in the cardiac pulsation maps appear to be “thicker” and may have lost some details. Nevertheless, they are identifiable. Moreover, cardiac pulsation may map more blood vessels in a given acquisition time, as seen in Figure 5. This is because cardiac pulsation maps, unlike PC-MRA, are not “tuned” to any particular flow velocity. The PC-MRA scan used a velocity encoding factor of 30 cm/s to balance arterial and venous sensitivity. To map a full range of large and small arteries and veins would have required a range of encoding factors (at 5 min per acquisition).
Fig. 5.
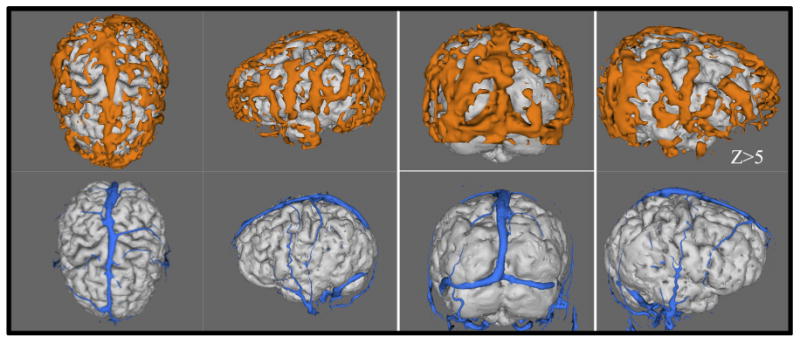
The cardiac pulsation maps (top panel) are compared with the participant's own phase contrast magnetic resonance angiography (PC-MRA) (velocity encoding factor of 30 cm/s) (lower panel). The cardiac pulsation maps were rendered into 3D and projected onto the participant's own structural brains. [Color figure can be viewed in the online issue, which is available at wileyonlinelibrary.com.]
To assess the commonalities of the cardiac pulsation maps among this group of healthy participants, we show the group average results (cardiac pulsation maps) from five participants (resting state) registered on the MNI standard image in Figures 6 and 7. Figure 6 depicts the averaged 3D maps from different angles with the MNI (top panel) and without the MNI (lower panel) standard image. Figure 7 shows the same averaged results in the orthographic and axial view. From Figures 6 and 7, we observe that areas of high correlation with the cardiac signal are concentrated in locations with high blood vessel density, or large blood vessels.
Fig. 6.

The rendered 3D averaged cardiac pulsation maps from 5 participants are shown from different viewing angles with MNI standard brain in the top panel and without in the lower panel. The fMRI data was derived from resting state scans. [Color figure can be viewed in the online issue, which is available at wileyonlinelibrary.com.]
Fig. 7.
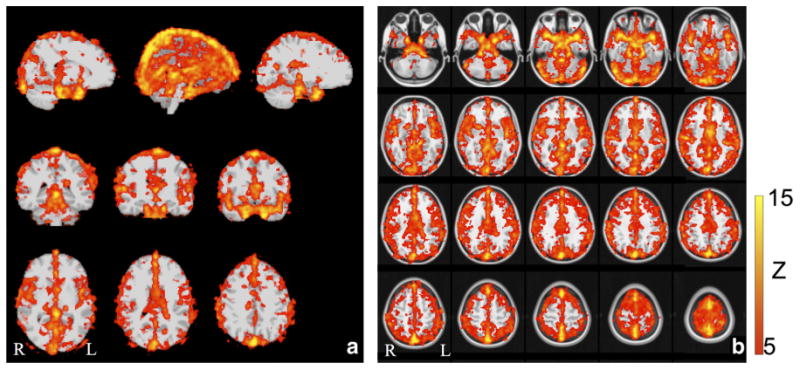
The averaged cardiac pulsation maps from 5 participants are shown in orthogonal positions (a) and axial positions (b), both projected onto the MNI standard brain. The fMRI data was derived from resting state scans. [Color figure can be viewed in the online issue, which is available at wileyonlinelibrary.com.]
To demonstrate the impact of the denoising application on the resting state (short TR) analyses, the temporal traces of original example BOLD signal, its unfiltered and filtered versions are shown in Figure 8. From Figure 8b, it can be seen that many spikes in the BOLD data are from the aliased cardiac pulsation signal, which is not present in the filtered version. The resulting ICs were compared with the resting state networks (RSNs) templates (14) and the ICs with high spatial correlation (calculated by fslcc in FSL) with the templates (>0.35) are shown in Supplementary Figure S2, which is available online. The spatial correlation coefficients (SC) are listed in each IC. Because RSNs are subject-specific and we had a small sample size in this study, the RSN templates should not be treated as “standard”. Therefore, the absolute SC values are not as important as the number of RSN-associated ICs identified by this procedure. We can see from Supplementary Figure S2 that more RSNassociated ICs were generated from the filtered data than those from the unfiltered data (10 versus 7). Moreover, we can identify three ICs in the unfiltered data that are clearly associated with cerebral vasculature (based on the similarity between the IC and vasculature), while only two were identified in the filtered data, indicating less physiological noise presented in the filtered data (Supp. Fig. S3). Clearly, more studies on these promising findings are needed. Nevertheless it demonstrates the great benefit of having fast sampling rate (short TR) in terms of denoising (8,15,16).
Fig. 8.
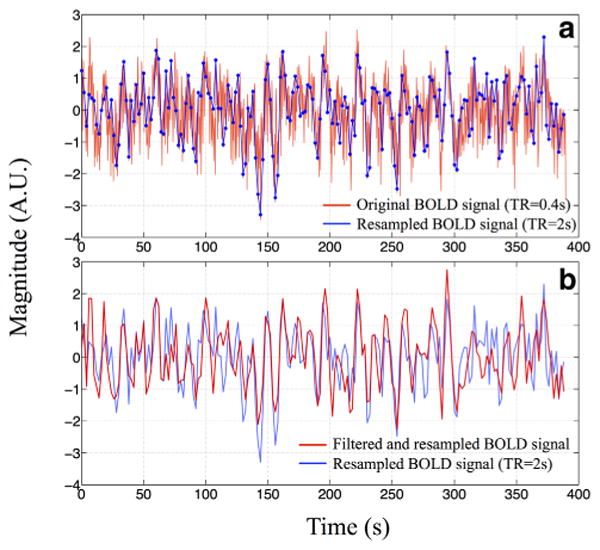
The temporal trace of one BOLD fMRI signal (TR=0.4 s) from the multiband echo-planar image (EPI) sequence in red together with its downsampled version (TR=2 s) in blue is shown in (a). The same downsampled temporal trace (in blue) was compared with the trace (in red) that had been bandpass filtered (0.01–0.25 Hz) before the downsampling (TR=2 s) in (b). [Color figure can be viewed in the online issue, which is available at wileyonlinelibrary.com.]
Discussion
The method we proposed here is not for denoising the BOLD fMRI data, which might require even shorter TR (to catch higher order harmonics of the cardiac signal) to effectively remove the cardiac noise. In this method, the cardiac fluctuation in the BOLD is our relevant signal. We intended to detect the temporal shifts of this signal in all the voxels. It is important to remember that the minimum detectable time shift of a pseudoperiodic signal measured by means of cross-correlation (or GLM) depends on the length of the time course, not the sampling resolution–while undersampled data will appear noisy, the time shift information is a property of the entire timecourse. Thus, as long as we capture the main component of the signal (the fundamental frequency, that has most power in it) using TR=400 ms, the temporal shifts can be accurately calculated.
Figure 3a illustrates the average dynamic propagation path of the cardiac signal travelling through the brain through a single cardiac cycle. Even though the movement of the cardiac signal from the lower center of the brain to peripheral areas (cortex) is clear, the result seems noisy. Some activated areas are clearly not on the path we just described. There are possibly three reasons. First and foremost, the systematic noise arises mainly due to the fact that cardiac pulsations are highly periodic (around 1 Hz). The cardiac signals separated by one cycle (∼1 s) are similar. Therefore, the voxels at the base of the brain (where the cardiac signal entered the brain) might be selected together with the voxels that are at the superior sagittal sinus by the same regressor, because it might take approximately 1 s for the pulse signal to travel from the base to the sinus. There are two possible solutions: (i) using longer scan that increases the variation in the BOLD signals; (ii) using a procedure analogous to phase unwrapping. Starting from a seed region, we can detect and correct for voxel to voxel delay discontinuities of Δt (which would correct for “off by one” errors in locating the time delay peak). We are working on this approach and hope to report it soon. The second reason for the noisy result is that the signal in big veins (i.e., Superior sagittal sinus) is the integrated signal from all the paths of the cardiac pulse signals. Therefore, the signal in this region is the sum of many signals with different delay times, making it harder to unambiguously assign the proper time delay to the voxel. Lastly (the third reason), as we know, the cardiac pulsation signal reflects the pulse signal carried by the blood vessel wall, which travels much faster than the blood itself. For the same reason, the pulsation signal might also travel through the vasculature in different paths other than those of blood circulation. In our previous fMRI/NIRS concurrent studies, we tracked the systemic low frequency oscillation (LFO) (∼0.1 Hz) in the BOLD fMRI using a similar method (17,18). It takes the LFOs, which are thought to reflect the real blood flow, 6–10 s to travel through the entire brain. Furthermore, the dynamic patterns (e.g., the propagation paths) of the LFOs are quite different than those observed in this study. More studies are needed to fully understand the similarities and differences in the propagation path of these two signals. However, the symmetry and the timing of the patterns of the dynamic pulsation signal, can be used as biomarkers for assessing the properties of the cerebral blood vessels. However, the method proposed here would not require an additional measurement by NIRS as in our previous study but would rely on the built-in oximeter. The other observation worth noting is that the pattern of activation in the last image (T=0.48 s) of Figure 3a is similar to that of the first image (T=– 0.64 s). This similarity also comes from the fact that the cardiac pulsation signal is highly periodic. The activation pattern would repeat itself at the cardiac rate if the cardiac frequency were fixed. However, the spectrum of the cardiac pulsation (Fig. 1) shows a certain bandwidth of the signal (0.9–1.2 Hz for the participant shown in Fig. 1), because the cardiac signal is only pseudoperiodic. As a result, the activation pattern of the cardiac pulsation signal will gradually disappear when we increase the temporal shift of the regressor beyond several cardiac cycles, because the regressor and BOLD signal would get more and more out of phase.
Figure 4b shows in blue the distribution of the z-values of all the voxels from the cardiac pulsation map of the resting state (e.g. maximum z-statistic map). It is noteworthy that most of the brain voxels are significantly correlated with the cardiac signal at specific time delays (z>2.3). This is most likely because: (i) there is a high density of blood vessels throughout the entire brain, and (ii) because brain tissue is so tightly coupled to circulation, almost all the vessels will be affected by the cardiac pulsation signal. It further demonstrates the high sensitivity of our method. A considerable number of z-values are beyond 10. Comparable sensitivity can also be obtained from fMRI data of the task activation (red in Fig. 4b). The distribution of the z-values (the cardiac pulsation map) calculated from the visual stimulation task (in red) is similar to that from the resting state study (in blue). This difference does not indicate less cardiac activities in the task. It is most likely due to the additional variance in the BOLD signal caused by the task (because the task signal is considered “noise” to the cardiac signal), and the fact that the resting state scans were much longer than the ones of the task (360 to 600 s versus 180 s), leading to higher statistical power. However, because the z-values are so high, it would be hard to visualize the result using a “regular” threshold value. We should note that the individual cardiac pulsation map (Fig. 4a) is the result of combining 12∼14 z-statistics maps (from the shifted cardiac pulsation regressors covering ∼1 s with steps of 0.08 s). Thus the z-threshold should be raised to counterbalance the effect of multiple comparisons. To achieve a Bonferroni corrected P<0.05, P<0.003=0.05/14 should be used; as a result the z-threshold has to be bigger than 3. Even at this level the whole brain is “activated” by the cardiac pulsation. For clarity of display, we set the zthreshold to the median z-value in the brain, which was 5 in Figure 4a and 4 in Figure 4c, corresponding to P-values equal or smaller than 0.0001.
A unique benefit of the usage of the pulsation signal is a continuous, endogenous marker. Therefore, it allows researchers to map the cardiac pulsation map (e.g., cerebrovascular map) in all the fMRI studies, regardless of the type (resting state, task or pharmacologic). We demonstrate this for resting state and task in Figure 4a,c,d, which shows the results from one participant for the resting state (Fig. 4a) and a task fMRI study of visual stimulation Figure 4c,d. Figure 4d depicts the brain activation map, which is the map normally being calculated in task fMRI studies. Figure 4c shows the corresponding cardiac pulsation map. The only requirements for getting these additional maps are a fast EPI sequence and simultaneous physiological recordings (e.g., fingertip pulse oximetry), which are already available to many groups, and are being rapidly disseminated. Fast EPI and physiological recording have no negative impact on the results of the task activation, as shown in Figure 4d, and offer rich additional dynamic and static information regarding cerebral vasculature, which could be extremely useful for clinical and functional assessments. Lastly, it is important to note that cardiac pulsation map during task in Figure 4c is almost identical to the one (Fig. 4a) acquired in resting state, confirming the consistency and repeatability of the technique.
Instead of using the global regressor, similar dynamic and static cardiac pulsation maps can be obtained from using the highpassed (>0.6 Hz) multiband fMRI data, which will filter out all the low frequency global oscillations, task-related oscillations and respiration signals (0.2–0.3 Hz). There were no visible differences in the results. This is probably due to the fact that the cardiac signal in the BOLD (TR=400 ms) is the dominant source of signal power, as shown in Figure 1.
Figure 5 shows the cardiac pulsation maps of one participant. We show similar maps of two participants in the Supplementary Figure S1. Subject-specific features in the cerebrovascular structure can be identified, which allows accurate and subject-specific assessment of the cerebral vasculature. At the group level, Figures 6 and 7 show the cardiac pulsation maps calculated from the five healthy participants. Common features, including the superior sagittal sinus, transverse sinus, straight sinus, Circle of Willis, and the middle cerebral arteries, are clearly displayed in these figures. When compared with the results from: (i) other methods for assessing the cardiac signal (19) or (ii) similar method applied on the data with longer TR (17), we can see great similarities. Moreover, because the TR in this study is much smaller (0.4 s) and therefore allows the method to map out the whole phase of the pulsation signal, the result of this study shows much richer information in the areas affected by the cardiac signal. For example, beyond the areas in the base of the brain (e.g., Circle of Willis) and large veins (e.g., superior sagittal sinus), large areas in the gray matter are also mapped out. This demonstrates the ability of the method to accurately evaluate the commonalities between participants, in this case, healthy participants. More importantly, it may be applied to special populations, i.e., older subjects, and those with cerebrovascular disease, to assess common abnormalities in the cerebral vasculature and their association with brain functions or dysfunction. We believe that our method is clear and easy to adopt. As multiband acquisition is becoming widely available, our method would benefit the researchers who are conducting fMRI studies on these special populations. The additional cerebral information may have great impact on their studies.
Conclusions
We have demonstrated that the cardiac pulsation signal has a large effect on the BOLD signal in many brain voxels, using a procedure based on correlating the signals derived from a fast fMRI acquisition that fully samples the cardiac pulsation signal with simultaneously recorded pulse oximeter data. These affected voxels are mainly in areas with high blood vessel density or large blood vessels (e.g., gray matter, superior sagittal sinus). A novel analytical method combining these two data sources allows us to dynamically map the passage of the pulsation signal through the brain and generate a full static cerebral pulsation map, which potentially offers valuable information about the properties of the cerebral vasculature of the participants in functional studies. These results may provide additional information to aid in the interpretation of functional studies. Finally, we demonstrated that this information could be generated, with no extra cost of imaging time or equipment, in both resting state and task fMRI studies in parallel with the results from the functional studies.
Supplementary Material
Acknowledgments
We thank Dr. Scott Lukas for his support on the project and helpful discussions. This work was funded by the National Institutes of Health Grants K25 DA031769(YT) and R21 DA034766 (BdeBF). There are no conflicts of interest to declare.
Grant sponsor: National Institutes of Health; Grant numbers: K25 DA031769, T32 DA015036, R21 DA027877, R21 DA034766.
Footnotes
Additional Supporting Information may be found in the online version of this article.
References
- 1.O’Rourke MF, Pauca A, Jiang XJ. Pulse wave analysis. Br J Clin Pharmacol. 2001;51:507–522. doi: 10.1046/j.0306-5251.2001.01400.x. [DOI] [PMC free article] [PubMed] [Google Scholar]
- 2.Chang C, Cunningham JP, Glover GH. Influence of heart rate on the BOLD signal: the cardiac response function. Neuroimage. 2009;44:857–869. doi: 10.1016/j.neuroimage.2008.09.029. [DOI] [PMC free article] [PubMed] [Google Scholar]
- 3.Glover GH, Li TQ, Ress D. Image-based method for retrospective correction of physiological motion effects in fMRI: RETROICOR. Magn Reson Med. 2000;44:162–167. doi: 10.1002/1522-2594(200007)44:1<162::aid-mrm23>3.0.co;2-e. [DOI] [PubMed] [Google Scholar]
- 4.Shmueli K, van Gelderen P, de Zwart JA, Horovitz SG, Fukunaga M, Jansma JM, Duyn JH. Low-frequency fluctuations in the cardiac rate as a source of variance in the resting-state fMRI BOLD signal. Neuroimage. 2007;38:306–320. doi: 10.1016/j.neuroimage.2007.07.037. [DOI] [PMC free article] [PubMed] [Google Scholar]
- 5.Frederick B, Nickerson LD, Tong Y. Physiological denoising of BOLD fMRI data using Regressor Interpolation at Progressive Time Delays (RIPTiDe) processing of concurrent fMRI and near-infrared spectroscopy (NIRS) Neuroimage. 2012;60:1913–1923. doi: 10.1016/j.neuroimage.2012.01.140. [DOI] [PMC free article] [PubMed] [Google Scholar]
- 6.Tong Y, Frederick B. Concurrent fNIRS and fMRI processing allows independent visualization of the propagation of pressure waves and bulk blood flow in the cerebral vasculature. Neuroimage. 2012;61:1419–1427. doi: 10.1016/j.neuroimage.2012.03.009. [DOI] [PMC free article] [PubMed] [Google Scholar]
- 7.Feinberg DA, Moeller S, Smith SM, Auerbach E, Ramanna S, Gunther M, Glasser MF, Miller KL, Ugurbil K, Yacoub E. Multiplexed echo planar imaging for sub-second whole brain FMRI and fast diffusion imaging. PLoS One. 2010;5:e15710. doi: 10.1371/journal.pone.0015710. [DOI] [PMC free article] [PubMed] [Google Scholar]
- 8.Moeller S, Yacoub E, Olman CA, Auerbach E, Strupp J, Harel N, Ugurbil K. Multiband multislice GE-EPI at 7 tesla, with 16-fold acceleration using partial parallel imaging with application to high spatial and temporal whole-brain fMRI. Magn Reson Med. 2010;63:1144–1153. doi: 10.1002/mrm.22361. [DOI] [PMC free article] [PubMed] [Google Scholar]
- 9.Setsompop K, Gagoski BA, Polimeni JR, Witzel T, Wedeen VJ, Wald LL. Blipped-controlled aliasing in parallel imaging for simultaneous multislice echo planar imaging with reduced g-factor penalty. Magn Reson Med. 2012;67:1210–1224. doi: 10.1002/mrm.23097. [DOI] [PMC free article] [PubMed] [Google Scholar]
- 10.Xu J, Moeller S, Strupp J, Auerbach EJ, Chen L, Feinberg DA, Ugurbil K, Yacoub E. Highly accelerated whole brain imaging using aligne-dblipped-controlled-aliasing multiband EPI; Proceedings of the 20th Annual Meeting of ISMRM; Melbourne, Australia. 2012. p. 2306. [Google Scholar]
- 11.Desjardins AE, Kiehl KA, Liddle PF. Removal of confounding effects of global signal in functional MRI analyses. Neuroimage. 2001;13:751–758. doi: 10.1006/nimg.2000.0719. [DOI] [PubMed] [Google Scholar]
- 12.Smith SM, Jenkinson M, Woolrich MW, et al. Advances in functional and structural MR image analysis and implementation as FSL. Neuroimage. 2004;23(Suppl 1):S208–S219. doi: 10.1016/j.neuroimage.2004.07.051. [DOI] [PubMed] [Google Scholar]
- 13.Beckmann CF, Smith SM. Probabilistic independent component analysis for functional magnetic resonance imaging. IEEE Trans Med Imaging. 2004;23:137–152. doi: 10.1109/TMI.2003.822821. [DOI] [PubMed] [Google Scholar]
- 14.Beckmann CF, DeLuca M, Devlin JT, Smith SM. Investigations into resting-state connectivity using independent component analysis. Philos Trans R Soc Lond B Biol Sci. 2005;360:1001–1013. doi: 10.1098/rstb.2005.1634. [DOI] [PMC free article] [PubMed] [Google Scholar]
- 15.Feinberg DA, Yacoub E. The rapid development of high speed, resolution and precision in fMRI. Neuroimage. 2012;62:720–725. doi: 10.1016/j.neuroimage.2012.01.049. [DOI] [PMC free article] [PubMed] [Google Scholar]
- 16.Smith SM, Miller KL, Moeller S, et al. Temporally-independent functional modes of spontaneous brain activity. Proc Natl Acad Sci U S A. 2012;109:3131–3136. doi: 10.1073/pnas.1121329109. [DOI] [PMC free article] [PubMed] [Google Scholar]
- 17.Tong Y, Lindsey KP, Frederick BD. Partitioning of physiological noise signals in the brain with concurrent near-infrared spectroscopy and fMRI. J Cereb Blood Flow Metab. 2011;31:2352–2362. doi: 10.1038/jcbfm.2011.100. [DOI] [PMC free article] [PubMed] [Google Scholar]
- 18.Tong Y, Frederick BD. Time lag dependent multimodal processing of concurrent fMRI and near-infrared spectroscopy (NIRS) data suggests a global circulatory origin for low-frequency oscillation signals in human brain. Neuroimage. 2010;53:553–564. doi: 10.1016/j.neuroimage.2010.06.049. [DOI] [PMC free article] [PubMed] [Google Scholar]
- 19.Dagli MS, Ingeholm JE, Haxby JV. Localization of cardiac-induced signal change in fMRI. Neuroimage. 1999;9:407–415. doi: 10.1006/nimg.1998.0424. [DOI] [PubMed] [Google Scholar]
Associated Data
This section collects any data citations, data availability statements, or supplementary materials included in this article.


