Abstract
This article describes the adsorption of glucose oxidase (GOx) onto optically transparent carbon electrodes (OTCE) under the effect of applied potential and the analysis of the enzymatic activity of the resulting GOx/OTCE substrates. In order to avoid electrochemical interferences with the enzyme redox center, control electrochemical experiments were performed using flavin adenine dinucleotide (FAD) and GOx/OTCE substrates. Then, the enzyme adsorption experiments were carried out as a function of the potential applied (ranged from the open circuit potential to +950 mV), the pH solution, the concentration of enzyme, and the ionic strength on the environment. The experimental results demonstrated that an increase in the adsorbed amount of GOx on the OTCE can be achieved when the potential was applied. Although the increase in the adsorbed amount was examined as a function of the potential, a maximum enzymatic activity was observed in the GOx/OTCE substrate achieved at +800 mV. These experiments suggest that although an increase in the amount of enzyme adsorbed can be obtained by the application of an external potential to the electrode, the magnitude of such potential can produce detrimental effects in the conformation of the adsorbed protein and should be carefully considered. As such, the article describes a simple and rational approach to increase the amount of enzyme adsorbed on a surface and can be applied to improve the sensitivity of a variety of biosensors.
1. Introduction
The adsorption of protein to solid surfaces is a spontaneous phenomenon which takes place almost instantaneously when a surface is exposed to an aqueous solution containing proteins.[1] It is generally accepted that the attractive interactions between protein and substrate are mainly driven by short- and large-range forces resulting from the combination of hydrophobic and electrostatic interactions.[2–4] Although the physicochemical features of the protein molecules and the sorbent surface play an important role to induce the protein adsorption, the surrounding environment (pH, ionic strength, temperature) also influences the adsorption process varying the properties of the protein and the interface.[5, 6] Consequently, these changes of properties are able to influence the structural conformation of the enzyme on the surface and subsequently could affect the active site of the protein.[7] This is an interesting research issue because enzymes have been used in a wide number of applications (such as industrial processes, diagnostic and therapy, biomedicine, bioprocesses, etc.) since 1962 when Clark & Lyons[8] described the first glucose biosensor. Therefore, the development and understanding of mechanisms to improve the activity and stability of adsorbed enzymes can yield to significant advances in a wide variety of biomedical and industrial applications.
Although the adsorption of enzymes can be controlled by performing chemical modifications of the substrate, a much more interesting and versatile approach results from shifting the interfacial potential (for those substrates that are electrically conductive).[9–14] In a recent article, it was demonstrated that the adsorption of bovine serum albumin (BSA) onto optically transparent carbon electrodes (OTCE) can be significantly enhanced by the application of an external potential to the sorbent surface.[15] Although the process showed a significant dependence on the experimental conditions selected, the application of higher potentials, selection of pH values around the isoelectric point (IEP) of the protein, higher concentrations of protein, and lower ionic strengths yielded faster kinetics and the accumulation of larger amounts of protein on the substrate. More importantly, the experiments obtained around the IEP of the protein contrasted with the traditional hypothesis that enhanced electrostatic interactions between the polarized substrate and the (oppositely charged) protein are solely responsible for the enhanced adsorption. Although the presented results suggested that the potential applied to the electrode is able to polarize the adsorbed layer and induce dipole–dipole interactions between the adsorbed and the incoming protein molecules, the use of BSA (soft protein with no catalytic activity) presented challenges to measure conformational changes upon the adsorption process. Aiming to address this gap in knowledge and to gain a better understanding of the effects of the electric field on the driving forces and structural integrity of adsorbed proteins, this article describes results obtained with GOx. This protein was selected as a convenient probe for the adsorption experiments because it allows an easy route to evaluate potential structural modifications affecting its catalytic activity.[16] Additionally, GOx is commercially available and has a well-characterized structure and activity. Therefore, the experiments herein presented describe the adsorption of GOx as a function of applied potential, solution pH, ionic strength, and enzyme concentration, as followed in real time by spectroscopic ellipsometry (SE). In addition, the enzymatic activity of the resulting substrates was evaluated as a function of the potential applied during the adsorption experiments. The experimental results were interpreted considering the physicochemical characteristics of the enzyme and complemented by simulations performed by molecular dynamics.
2. Experimental Design
Reagents and Solutions
All aqueous solutions were prepared using 18 MΩ·cm water (NANOpure Diamond, Barnstead; Dubuque, IA) and analytical reagent grade chemicals. Citric acid and β-D-glucose were purchased from Aldrich Chemical Company (Milwaukee, WI). Glacial acetic acid was obtained from EM Science (Gibbstown, NJ). Glucose oxidase (GOx, Type II) from Aspergillus niger, horseradish peroxidase (HRP, Type II), o-dianisidine, and flavin adenine dinucleotide disodium salt hydrate (FAD, Fluka) were obtained from Sigma-Aldrich (St. Louis, MO). Sodium hydroxide and sodium phosphate monobasic anhydrous were purchased from Fisher Scientific (Fair Lawn, NJ). The pH of different solutions was adjusted using 1 mol·L−1 NaOH and measured using a glass electrode and a digital pH meter (Orion 420A+, Thermo; Waltham, MA). Solutions of GOx (1.00, 0.50, 0.10, 0.05 and 0.01 mg·mL−1) were prepared by dissolving a known amount of enzyme in 10 mmol·L−1 citrate buffer. The optically transparent carbon electrodes (OTCE) were prepared by pyrolysis of AZ P4330-RS Photoresist purchased from AZ Electronic Materials USA Corp. (Somerville, NJ). The commercial photoresist was diluted to 60% v/v of the as-received material with propylene glycol monomethyl ether acetate (PGMEA 99%, Alfa Aesar; Ward Hill, MA). The enzymatic assay of GOx adsorbed onto OTCE was performed in 10 mmol·L−1 acetate buffer at pH = 5.1 which was prepared dissolving sodium acetate anhydrous (Mallinckrodt Baker, Inc., Paris, KY), and 1 mol·L−1 acetic acid was used to adjust the pH of buffer solution.
Substrates
Silica wafers coated with thin optically transparent carbon films (Si/SiO2/OTCE) were used as conductive platforms to adsorb GOx and investigate the effect of the potential applied. The OTCEs were obtained following the procedure described in a previous paper.[14] Briefly, standard <111> silicon wafers (Si/SiO2, Sumco; Phoenix, AZ) were first scored using a computer-controlled engraver (Gravograph IS400, Gravotech; Duluth, GA). The process defined pieces of 1 cm in width and 3 cm in length that were then manually cut and cleaned in piranha solution (30% hydrogen peroxide and 70% sulfuric acid) at 90 °C for 30 min. After thorough rinsing with water, the substrates were immersed and stored in ultrapure water until use. Subsequently the clean wafers were dried at 80 °C for 30 min; a thin layer of photoresist was deposited onto the silicon wafers using a spin coater (Laurell, Model WS-400-6NPP; North Wales, PA). Next, the photoresist-coated substrates were heated at 110 °C for 60 s in a convection oven to evaporate the solvent and then transferred to a tube furnace (Thermolyne F21135, Barnstead International; Dubuque, IA) for pyrolysis. The carbonization step began by flushing the system at 1 L·min−1 with forming gas (95% Ar + 5% H2, v/v) for 5 min. Next, the temperature was increased to 1000 °C at 20 °C·min−1. After pyrolysis during 1 h, the system was allowed to cool to room temperature. Finally, the samples were stored in a Petri dish for a minimum of 3 days to complete the spontaneous surface oxidation.
Spectroscopic Ellipsometry
Adsorption experiments were performed using a variable angle spectroscopic ellipsometer (WVASE, J.A. Woollam Co.; Lincoln, NE) following a procedure described elsewhere.[16–18] The basis of SE is the measurement of change in the reflectance and phase difference between the parallel (RP) and perpendicular (RS) components of a polarized light beam upon reflection from a surface. The intensity ratio of RP and RS can be related to the ellipsometric angles (Ψand Δ) using Equation 1:
| Equation 1 |
The collected data (amplitude ratio (Ψ) and phase difference (Δ) as function of wavelength or time) was modeled using the WVASE software package (J.A. Woollam Co.; Lincoln, NE) and the mean square error (MSE, calculated by a built-in function in WVASE) was used to quantify the difference between the experimental and model-generated data. In agreement with previous reports, MSE < 15 were considered acceptable.[16, 17] The ellipsometric measurements were interpreted using an optical model which describes the microstructure of the system under study in terms of the refractive index (n), extinction coefficient (k), and thickness (d). Therefore, the ellipsometric model used in this article to describe the experimental data was previously developed in our lab and presented in preceding papers.[14, 15] Likewise, five uniaxial layers with optical axes parallel to the surface substrate were considered in this optical model. Furthermore, because the experiments were performed in aqueous media, the optical properties of water were also considered. Concisely, the dielectric function of Si (bulk, d = 1 mm) and SiO2 (d = 2.1 ± 0.5 nm) were used to describe the optical behavior of silica wafer. Then, the optical constants of carbon[14] were used to define the ellipsometric response of OTCE (d = 19.6 ± 0.7 nm). Next, a void layer representing nano-bubbles[19–22] formed on the hydrophobic and rough surface of the OTCE was also incorporated to improve the optical model. Finally, the GOx layer adsorbed on the OTCE was described successfully using a Cauchy function.
Dynamic adsorption experiments were performed in a modified electrochemical cell[17] (J.A. Woollam Co.; Lincoln, NE) mounted directly on the vertical base of the ellipsometer, with an incident angle of 70°. Before the adsorption of GOx on the substrate, the thickness of the OTCE was always measured by placing the substrate in the ellipsometry cell and performing a spectroscopic scan from 300 to 1000 nm (with 10 nm step) using 10 mmol·L−1 buffer solution as the ambient medium. Then, the adsorption experiment was started recording a baseline of the bare OTCE at open circuit potential (OCP, the potential at which no current flows through the cell) while buffer solution was pumped inside the cell at a rate of 1 mL·min−1. After 20 min of baseline, the enzyme solution was injected to adsorb a monolayer of GOx on the OTCE at OCP (+180 ± 20 mV). As a result, an initial fast process followed by a slower one was always observed. When a plateau in the signal was noticed, the selected potential (+500, +650, +750, +800, or +950 mV) was applied and kept until the end of the experiment. The change of potential was carried out employing a CHI812B Electrochemical Analyzer (CH Instrument, Inc.; Austin, TX), a silver/silver chloride (Ag|AgCl|KClsat) reference electrode, and a platinum wire as the counter electrode. Lastly, a spectroscopic scan was performed to obtain the thickness of the protein layer after the adsorption assisted by potential. The procedure described above provided the data to calculate the thickness of the OTCE, the protein film, and the adsorbed amount of the GOx on the thin carbon electrodes.
Enzymatic Assays
GOx (EC 1.1.3.4) is a homo-dimeric glycoprotein with a molecular weight of 160 kDa (7 nm × 5.5 nm × 8 nm [23]) which contains one tightly, non-covalently bound flavin adenine dinucleotide (FAD) per monomer as cofactors.[24, 25] FAD makes up part of the active site and acts as redox center of the enzyme. In the reductive step of the enzyme during the enzymatic reaction, GOx catalyses the oxidation of β-D-glucose to β-D-glucono-δ-lactone by reducing FAD to FADH2. Then, the oxidation of GOx takes place by utilizing molecular oxygen (O2) as an electron acceptor and the simultaneous production of hydrogen peroxide (H2O2).[26] The optimum pH of GOx is 5.5 and the isoelectric point (IEP) is 4.2.[27] In order to evaluate the biological activity of the substrates modified with GOx, the enzymatic activity was measured spectrophotometrically. The technique was based on the reaction of β-D-glucose with O2 and H2O in presence of GOx to produce β-D-glucono-δ-lactone and H2O2. Then, the H2O2 was used to oxidize o-dianisidine in presence of horseradish peroxidase (HRP) to generate a color change which was monitored at 500 nm.[25] With the purpose of controlling the area exposed to the enzyme solution during the adsorption experiment, poly(dimethylsiloxane) (PDMS) was used to cover the top portion and back side of the substrate. After GOx was adsorbed onto the OTCE, PDMS was removed exposing a constant area of substrate modified with the adsorbed GOx. Then, the GOx/OTCE substrate was placed in a quartz cuvette filled with a mixture of β-D-glucose, o-dianisidine, and HRP in acetate buffer pH = 5.1 (according to the assay protocol) to begin the spectrophotometric measurement. In order to mix continuously the solution during the measurement, a magnetic bar was placed inside the cuvette, and a spinette cell stirrer (Starna Cells, Inc.; Atascadero, CA) was used to homogenize the solution. To follow the progress of enzymatic reaction, the change in absorbance at 500 nm was recorded using a spectrophotometer Genesys 10-S Thermo (Electron Corporation; Madison, WI).
Cyclic Voltammetry
Cyclic voltammetry (CV) was used to study the electrochemical response of FAD on the OTCE, and to define the working potential range for the adsorption studies.[28] In addition, the electrochemical behavior of the GOx/OTCE substrates was also investigated by CV after adsorption of the enzyme at the selected potential (OCP, +500, +650, +750, +800, and +950 mV). In all cases, experiments were performed in 10 mmol·L−1 citrate buffer using a CHI812 Electrochemical Analyzer (CH Instruments, Inc.; Austin, TX), silver/silver chloride (Ag|AgCl|KClsat) reference electrode, and a platinum wire as the counter electrode.
Molecular dynamics simulations
To gain preliminary insights about the potential effects of the potential applied on the structure of the protein, simulations were performed using the NAMD 2.9 package[29] with Charmm22 force field. The results were analyzed using VMD.[30] The initial protein coordinates were retrieved from the Protein Data Bank (PDBID: 1CF3). Before performing the simulation, the protein was solvated with water (TIP3) and placed in a rectangular box of 13.0 nm × 12.8 nm × 10.8 nm at physiological pH (7.3). The system was neutralized by the addition of NaCl. In all cases, the systems were minimized and equilibrated until reaching the equilibrium state (~1 ns). Subsequently, the Molecular Dynamics production was performed in the NVT ensemble at 292 K using a time step of 2 fs, the SHAKE algorithm, and periodic boundary conditions. In order to evaluate the polarization effects on the GOx, an external electric field of 0.43 V·nm−1 was applied along the z direction during the time selected for the simulation (40 ns).[31] The control simulation was carried out using identical conditions but without the external electric field. Electrostatic potential maps and dipole moment were calculated using APBS 1.4[32] and VMD Dipole Watcher Plugin, respectively
3. Results and Discussion
3.1 Molecular Modeling
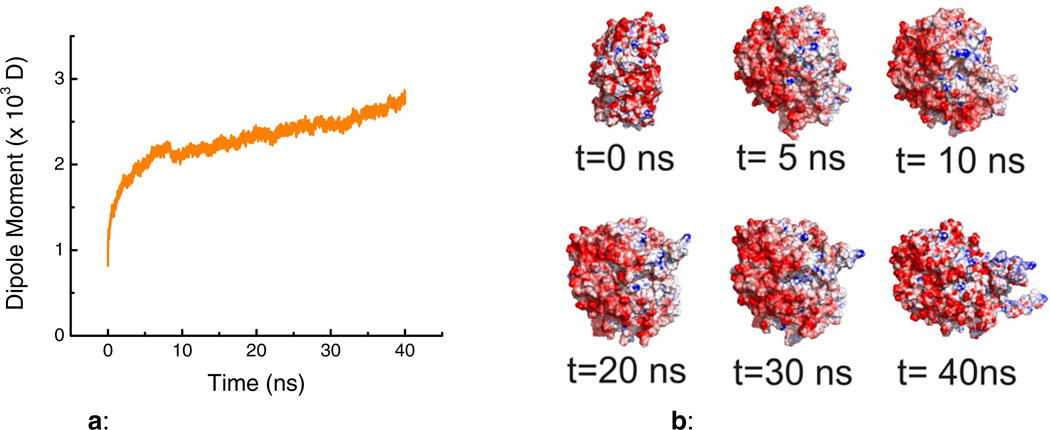
As it can be observed in Figure 1a, and in agreement with previously-reported calculations,[33] GOx shows an initial (intrinsic) molecular dipole moment of about 700D. As the simulation progressed, it was observed that the potential applied was able to induce substantial conformational changes along with the corresponding increases in the molecular dipole moment, reaching a final value of 2730 D (40 ns). It is also important to point out that the most significant conformational changes were obtained within the first 10 ns of the simulation, followed by a slower process that stretches the protein along the electric field direction (Figure 1b).
Figure 1.
a: Simulation of the molecular dipole moment of GOx under the influence of an external electric field as a function of time.
b: Simulation of the structural changes in a GOx molecule under the influence of an external electric field as a function of time. Blue and red colors represent positive and negative electrostatic potentials, respectively.
Although this computational model does not include the redox reactions described in Figure 7b (vide infra), the results of the simulation provide supporting information related to the molecular consequences of the polarization effect in agree with a recently report [34]. The observed changes can be attributed to the redistribution of charged amino acids on the protein that, under extreme conditions, could even affect the shape of the protein [35]. Considering these findings, the electrochemical behavior of the substrates was subsequently investigated.
3.2 Electrochemical behavior of GOx/OTCE substrates
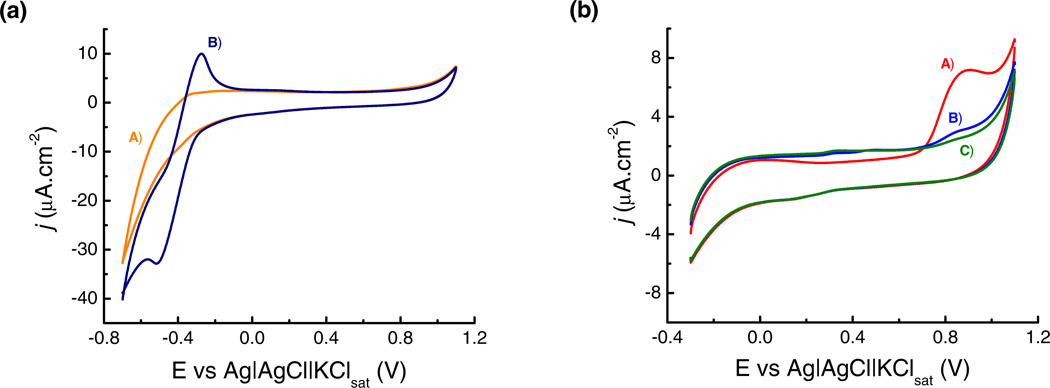
In order to define the working potential range to perform the protein adsorption experiments, the electrochemical behavior of the OTCE, GOx, and FAD was investigated by cyclic voltammetry. Representative results of current density (j, µA·cm−2) as a function of the potential applied to the OTCE (working electrode) are shown in Figure 2. As it can be observed in Figure 2a (trace A), no significant features were observed in potentiodynamic profile when the plain OTCE was immersed in the selected buffer. On the other hand, Figure 2a (trace B) shows that well-defined peaks were obtained when the electrode was immersed in a solution containing FAD. Considering reference values from previous literature reports [36–38] these peaks can be assigned to a quasi-reversible redox process involving the oxidation of FADH2 (EP = −271 mV) and the reduction of FAD (EP = −515 mV) during the anodic and cathodic sweep, respectively. In order to avoid potential interferences with the electrochemical response of GOx-FAD (that under the selected experimental conditions overlaps with the evolution of H2, see trace A in Figure 2a), the potential value corresponding to +200 mV was defined as the lower limit for the adsorption experiments.
Figure 2.
(a) Cyclic voltammograms of OTCE performed in: A) 10 mmol·L−1 citrate buffer at pH = 4.2; and B) 0.1 mmol·L−1 FAD dissolved in 10 mmol·L−1 citrate buffer at pH = 4.2. (b) Cyclic voltammograms of GOx/OTCE substrate after adsorption of GOx at +500 mV. All voltammograms were obtained in 10 mmol·L−1 citrate buffer at pH = 4.2 and correspond to: A) 1st cycle; B) 2nd cycle; and C) 3rd cycle. Scan rate: 50 mV·s−1.
On the other hand, as it can be observed in Figure 2b, an irreversible electrochemical process (oxidation, EP = +850 mV) was observed when the OTCE surface was saturated with a layer of GOx. This oxidation peak, that sequentially decreased as a function of the number of sweeping cycles has been attributed to the irreversible oxidation of three amino acids (cysteine, tryptophan and tyrosine) that, after protein adsorption, are in close proximity to the electrode surface [39, 40] and could, in some extreme cases, lead to cleavage events [41]. Considering these peak potentials, the results described support the hypothesis that the oxidation process observed at positive potentials is related to the amino acids and is clearly decoupled from the redox activity of the FADH2 (present in the active site). This irreversible chemical change on the GOx layer is critical to consider the enzymatic activity of adsorbed GOx, vide infra.
3.3 Effect of the Magnitude of Applied Potential on the Adsorption of GOx
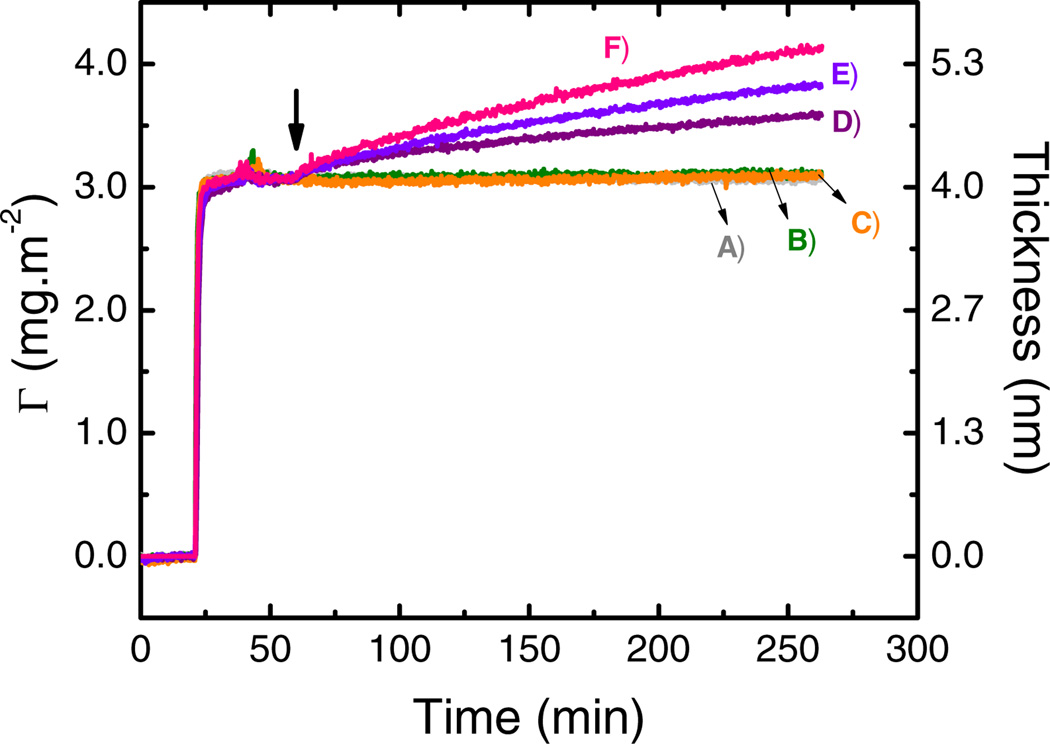
In order to study the effect of the applied potential, adsorption experiments were performed by recording the baseline (bare OTCE) and then allowing GOx to adsorb on the surface of the OTCE at OCP (4.1 ± 0.3 nm). In agreement with previous reports [16, 37], these values correspond to an adsorbed amount of 4.1 ± 0.1 mg·m−2, which are in line with the formation of a monolayer of enzyme on the surface of the OTCE with side-on orientation. When stable readings for the ellipsometric angles were obtained (typically around 60 min), the selected potential (OCP, +500, +650, +750, +800, or +950 mV) was applied and maintained until the end of the experiment. Figure 3 shows representative examples of the results obtained during the adsorption of the first layer of GOx (at OCP) and the secondary adsorption process, induced by the application of the external potential (marked as ↓). In all cases, the secondary adsorption process proceed as a fast growth process in the protein layer within the first 15 sec upon the application of the potential (dΓ/dt1), followed by a much slower one (dΓ/dt2) that remained almost constant until the end of the experiment.
Figure 3.
Effect of applied potential on the adsorption kinetic of 0.50 mg·mL−1 GOx after adsorption of a GOx layer (4.1 ± 0.3 nm) onto OTCE at OCP. Adsorption experiments were performed in 10 mmol·L−1 citrate buffer at pH = 4.2 and a flow rate of 1 mL·min−1 at: A) OCP; B) +500 mV; C) +650 mV; D) +750 mV; E) +800 mV; and E) +950 mV. The arrow shows the time which the external potential was applied.
As it can be observed, no significant differences (with respect to the values obtained at OCP) were found in the adsorbed amount of GOx when the OTCE potential was changed to +500 mV or +650 mV (traces B and C respectively). However, considerable increases in thickness (and adsorbed amount of GOx) were obtained when the imposed potential was fixed at ≥+750 mV. Additionally, it was observed that the rate of GOx adsorption was found to be proportional to the applied potential. Table 1 summarizes the results calculated (using the least square method) for each of those processes as a function of the potential applied to the electrode surface.
Table 1.
Initial adsorption rate (calculated after the corresponding potential was applied, dΓ/dt1), linear approximation of the second adsorption process (dΓ/dt2, calculated in the 150–250 min interval of the experiment) and final adsorbed amount of GOx onto the GOx/OTCE substrate as a function of the potential applied to the electrode.
| dΓ/dt1 (× 10−3 mg.m−2.min−1) |
dΓ/dt2 (× 10−3 mg.m−2.min−1) |
Γ@ 250 min (mg.m−2) |
|
|---|---|---|---|
| +500 mV | 2 ± 7 | 0.16 ± 0.03 | 3.10 ± 0.04 |
| +650 mV | 0 ± 9 | 0.38 ± 0.03 | 3.09 ± 0.04 |
| +750 mV | 20 ± 5 | 1.73 ± 0.03 | 3.57 ± 0.02 |
| +800 mV | 16 ± 5 | 3.06 ± 0.02 | 3.81 ± 0.03 |
| +950 mV | 29 ± 7 | 4.11 ± 0.03 | 4.10 ± 0.03 |
In line with the results obtained with BSA, these experiments suggest that the accumulation of GOx can be also enhanced by the so-called polarization effect [15] but the minimum potential required to induce the accumulation of GOx (+750 mV) is significantly higher than the minimum value required to induce the accumulation of BSA (+650 mV). This difference could be attributed to a combination of the initial dipole moment of the protein (at IEP and OCP), the structural molecular weight and stability of the protein, and the magnitude of the dipole induced on the GOx molecules when the electric field is imposed. In this case it is reasonable to consider that larger and harder proteins, like GOx, would be more resistant (than smaller, softer proteins like BSA) to undergo conformational transitions [3, 42, 43] and therefore would require the application of higher potential values to induce the polarization and the subsequent accumulation on the electrode surface. In other words, the results suggest that the susceptibility of the protein to the electric field applied to the sorbent surface (polarizability) could be associated with the conformational rigidity and the size of the adsorbing protein.
3.4. Effect of GOx concentration
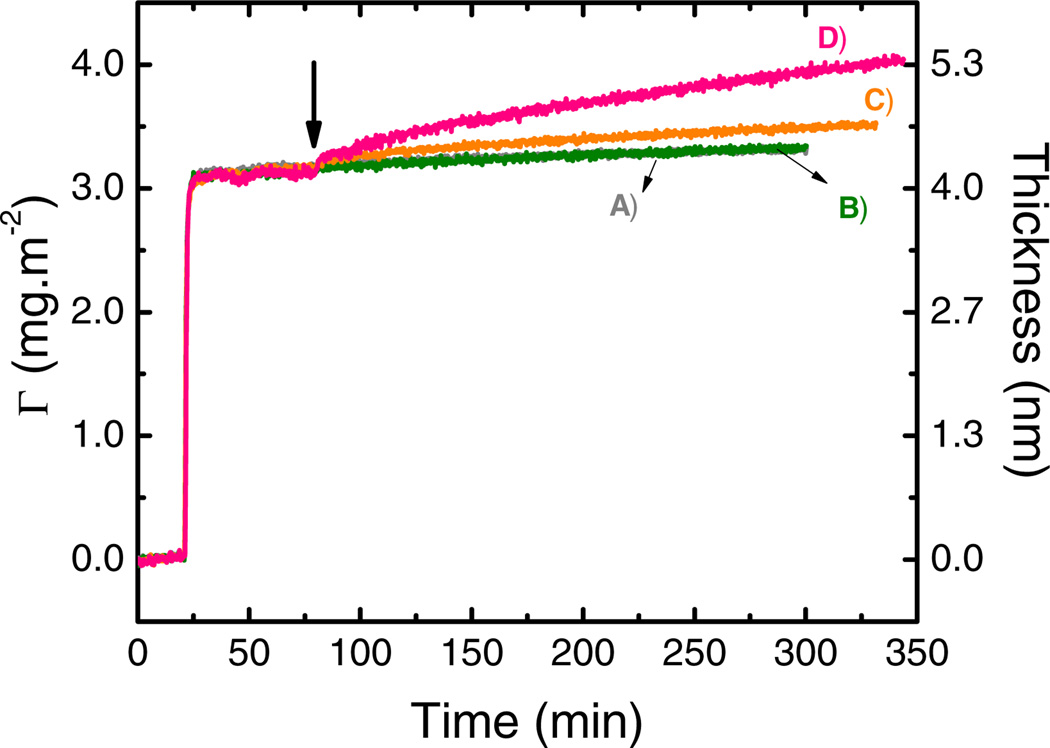
The effect of GOx concentration was investigated in the 0.01 – 0.50 mg·mL−1 range. Once again, the experiment was performed by first adsorbing a monolayer of GOx (10 mmol·L−1 citrate, pH = 4.2, 40 min) on the bare OTCE at OCP. Next, the impinging solution (10 mmol·L−1 citrate, pH = 4.2, containing GOx at the selected concentration) was pumped into the cell for 20 min to evaluate the stability of adsorbed protein layer and to establish the baseline. Then, +800 mV were applied and the experiment followed for at least another 220 min. Figure 4 summarizes the results of the dynamic adsorption experiments (adsorbed amount and layer thickness obtained as a function of time). As it can be observed, the accumulation of enzyme molecules onto the GOx/OTCE substrates was only observed upon the application of the potential to the electrode (at t=80 min). Additionally, no spontaneous desorption/adsorption processes were observed when the citrate buffer or the selected solution of GOx were introduced in the cell at OCP, respectively.
Figure 4.
Effect of GOx concentration on adsorption at +800 mV of: A) 0.01, B) 0.05, C) 0.10, and D) 0.50 mg·mL−1 after a GOx layer (4.1 ± 0.3 nm) was adsorbed onto OTCE at OCP. All experiments were performed in 10 mmol·L−1 citrate buffer at IEP and a flow rate of 1 mL·min−1. The arrow shows the time which the external potential was applied.
Also, no differences were observed in the dynamic adsorption experiments of GOx when 0.01 and 0.05 mg·mL−1 of enzyme were used to perform the experiments. On the other hand, the increase in the adsorbed amount (and thickness) was found to be proportional to the concentration of enzyme solution impinging the substrate. Consequently, the experimental results propose that the attachment of GOx to the polarized surface was controlled by the number of enzyme molecules incoming to the substrate. Considering the polarization of protein molecules as one of the most relevant driving forces of protein adsorption induced by potential, the increase of the number of enzymes incoming to the polarized substrate increased the chance of enzyme became polarized and the subsequent protein adsorption.
3.5. Effect of pH on the GOx adsorption
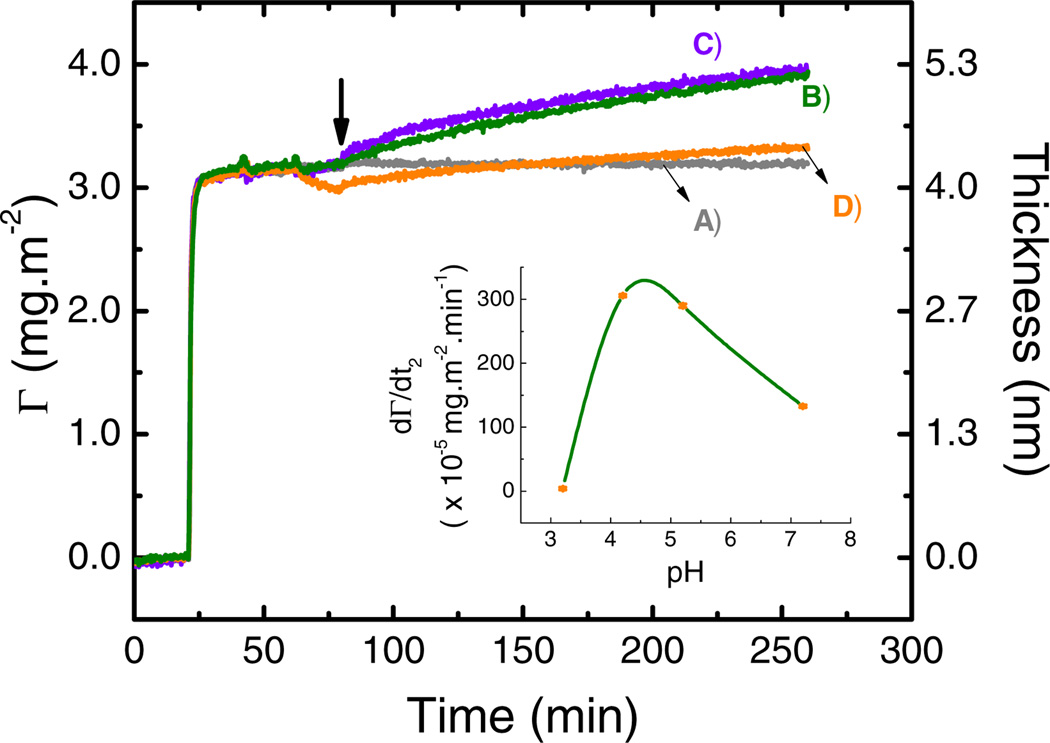
In order to evaluate the effect of protein charge on the adsorption process, adsorption experiments were performed using GOx solutions buffered in the 3.7 – 5.2 range of pH. This range was selected to include the IEP of GOx (4.2) [27] while retaining sufficient buffer capacity in the ambient solution (citrate pKa1 = 3.14, pKa2 = 4.77, pKa3 = 6.39) [44]. Moreover, to gain preliminary insights about the effect of electrode potential on the adsorption of GOx under physiological conditions, an additional experiment was performed at pH = 7.2 (buffered with 10 mmol·L−1 phosphate). As previously described, a first layer of GOx was adsorbed to the OTCE at OCP and the IEP, yielding a compact monolayer of protein with an average thickness of 4.1 ± 0.3 nm. Then, the solution impinging the substrate was sequentially replaced by the buffer at the selected pH and by a solution containing GOx (prepared in the selected buffer) to establish the baseline (at OCP and the pH selected for the experiment). Although slight changes in the thickness of the layers were observed (product of small rearrangements in the adsorbed layer) no significant spontaneous adsorption or desorption of GOx was observed within the pH range studied. Once the new baseline was established, the potential (+800 mV) was applied to the electrode surface and the adsorption process followed by SE. Figure 5 shows representative examples of the results obtained during the dynamic adsorption of GOx at different pH values. As summarized in Figure 5 (see insert), the maximum secondary adsorption rate of GOx was observed at the IEP (3.06 ± 0.02×10⁻³ mg·m−2·min−1). These results suggest that in the case of GOx, the electrostatic interactions between the incoming molecules and those already adsorbed at the surface of the electrode are able to overcome the dipole-dipole interactions induced by the potential applied to the electrode surface and limit the secondary adsorption process.
Figure 5.
Effect of pH on adsorption of 0.50 mg·mL−1 GOx at +800 mV after adsorption of a GOx layer (4.1 ± 0.3 nm) onto OTCE at OCP and IEP. All experiments were performed in 10 mmol·L−1 citrate or phosphate buffer and a flow rate of 1 mL·min−1 at pH = 3.7 (A), 4.2 (B), 5.2 (C), and 7.2 (D). The arrow shows the time which the external potential was applied.
3.6. Effect of ionic strength on the GOx adsorption
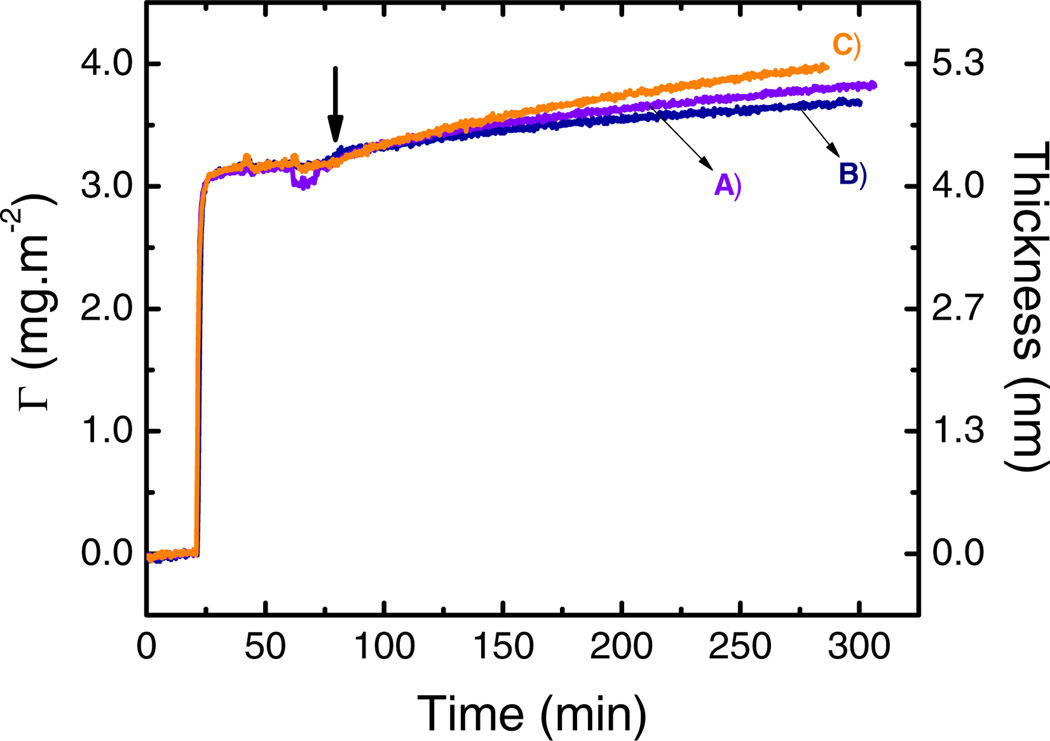
With the aim of studying the contribution of electrostatic interactions on the adsorption process assisted by the potential applied, the effect of ionic strength was investigated. For these experiments, a monolayer of GOx was first adsorbed (10 mmol·L−1 citrate, pH = 4.2, 0.50 mg·mL−1 GOx, 40 min) on the OTCE at OCP. Next, the impinging solution was switched to a solution containing the selected concentration of NaCl (10 mmol·L−1 citrate buffer, pH = 4.2, 0.50 mg·mL−1 GOx) for 20 min. Finally, the potential was changed from OCP to +800 mV to induce the enzyme accumulation on the surface. The results are shown in Figure 6.
Figure 6.
Adsorption of 0.50 mg·mL−1 GOx onto GOx/OTCE substrate at +800 mV in citrate buffer pH = 4.2 with 100 mmol·L−1 NaCl (A), 25 mmol·L−1 NaCl (B), and no NaCl (C). The experiments were performed at a flow rate of 1 mL·min−1. The arrow shows the time which the external potential was applied.
As it can be observed, increases in the ionic strength produced systematic decreases in the adsorption of GOx induced by the potential applied. Even though only slight differences in the final adsorbed amount were observed, the ionic strength seems to affect more significantly the initial stage of the secondary adsorption process (dΓ/dt2). As it was described in a previous paper [15], these results can be explained by considering that the potential applied can polarize the substrate (GOx/OTCE) and induce the polarization of the incoming proteins. When this happens, a secondary adsorption process is observed yielding to the accumulation of the proteins onto the substrate. Increasing the ionic strength of the environment can shield the effect of the potential and therefore decrease the probability for the incoming proteins to become polarized. More importantly, these experiments support the hypothesis that the polarization of the incoming proteins plays a fundamental role on the secondary adsorption process, that cannot be attributed to conventional interactions described for systems at open-circuit potential.
3.7. Enzymatic Activity of the GOx/OTCE substrates
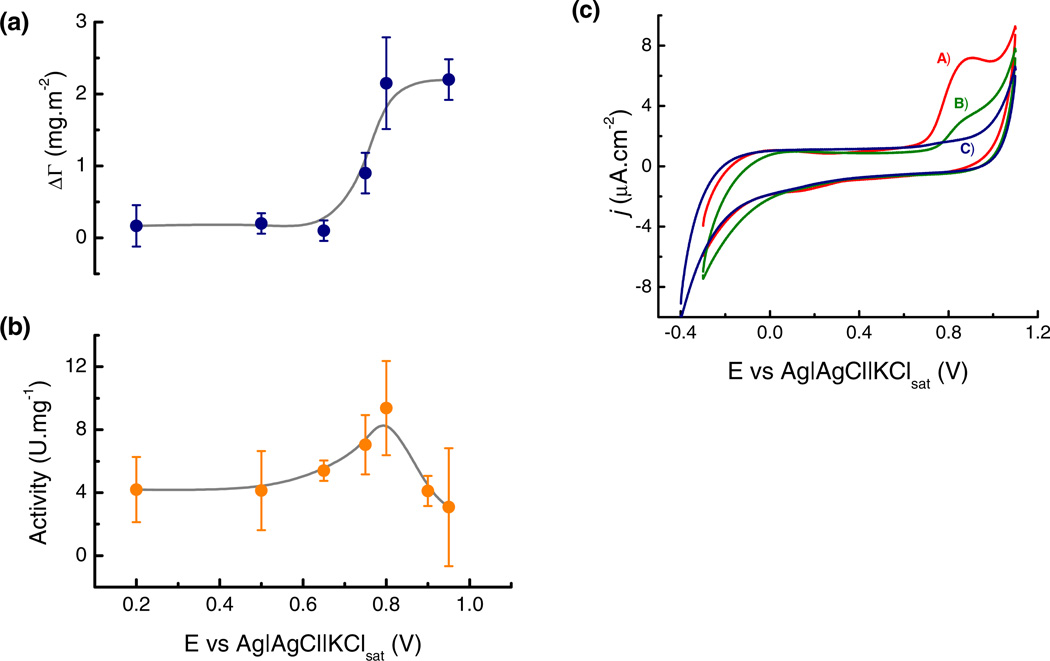
In order to understand the effect of applied potential on the structural conformation of adsorbed GOx, the activity of the enzyme was measured immediately after the adsorption at the selected potentials. In order to obtain a uniform film of GOx on the OTCE, the OTCE/GOx substrates used for the experiments herein described were assembled in batch (by submerging the OTCE in a beaker containing 0.5 mg·mL−1 GOx in citrate buffer and using an orbital shaker). Again, a monolayer of GOx was first adsorbed onto the OTCE (10 mmol·L−1 citrate, pH = 4.2) shaking the solution at 80 rpm for 60 min. After a spectroscopic scan was performed to verify the thickness of the protein layer (adsorbed at OCP), the GOx/OTCE substrate was immersed in a solution containing GOx and the potential was applied for 3 hours. Next, the thickness of GOx layer was measured by SE following the previously-described procedure. Finally, the GOx/OTCE substrate was placed in a quartz cell containing glucose, o-dianisidine, and horseradish peroxidase (HRP). The catalytic activity of the resulting substrate was evaluated by measuring the development of color (absorbance at 500 nm) using a spectrophotometer. The results are summarized in Figure 7a, where the changes in the adsorbed amount of GOx at the selected potentials in regard to the OCP and the enzymatic activity of the substrates were plotted as a function of the potential applied during the secondary adsorption process. Before turning to the data analysis, it is important to highlight that the experimental data obtained in batch showed not only more dispersion but also slightly higher values in the adsorbed amount (and thickness) respect to dynamic experiments, especially when the enzyme adsorption was assisted by potential. However, the adsorption of GOx maintained the same trend and behavior in both cases allowing the comparison of the results.
Figure 7.
(a) Change in the adsorbed amount (ΔΓ) and (b) specific enzyme activity of GOx/OTCE substrates as a function of the potential applied during the secondary adsorption experiments. (c) Cyclic voltammograms of GOx adsorbed onto the OTCE after adsorption at: A) +500 mV (the same response was observed at OCP); B) +650 mV; and C) +950 mV. All experiments were performed in 10 mmol·L−1 citrate buffer at pH = 4.2 and a flow rate of 1 mL·min−1.
As it can be observed, a correlation between the change in the adsorbed amount (ΔΓ) of GOx and the enzymatic activity was obtained at potentials ≤ +800 mV. Within this range, changes in the adsorbed amount can be correlated with the catalytic activity of the resulting substrate. In line with the results presented in Figure 3, larger amounts of GOx could be adsorbed onto the OTCE when potentials above +800 mV were applied on the electrode. However, despite the increasing amounts of GOx accumulated on the surface, applying potentials above +800 mV yielded significantly lower enzymatic activities (see Figure 7b). This findings suggest that the potential applied to the substrate to induce the accumulation of the enzyme, could also have negative effects due to the electrochemical degradation of the enzyme. In order to confirm this hypothesis, GOx/OTCE substrates prepared with layers of GOx adsorbed at different potentials were investigated using cyclic voltammetry. According to these results, a well-defined anodic peak was obtained at +850 mV when the secondary enzyme adsorption process was performed at either OCP or +500mV (see trace A in Figure 7c). This process was attributed to the irreversible oxidation of the GOx layer adsorbed onto the OTCE. As the substrates were exposed to higher potential values (required to induce the secondary adsorption process), gradual decreases in the peak current were obtained (see trace B in Figure 7c), making this peak non-evident when +950 mV were applied (see trace C in Figure 7c). In other words, potential values above +800 mV were able to oxidize residues in the layer of enzyme adsorbed on the OTCE, and negatively affect its catalytic activity. These experiments demonstrate that while the potential applied to the electrode surface can promote the adsorption process of GOx via the polarization effect, potentials applied can also irreversibly oxidize the layer of adsorbed proteins, resulting in significant decreases in the catalytic activity. It is also important to point out that slight improvements in the overall activity of the resulting composite were obtained (Figure 7b). This finding suggests that conformation of the enzyme adsorbed upon the application of an electric field could be different from the one obtained at OCP.
4. Conclusions
This article described results related to the adsorption of GOx onto OTCE as a function of the potential applied to the substrate, and are complemented by measurements of the catalytic activity as well as molecular dynamic simulations. The results demonstrated that larger potential values can increase the adsorbed amount (Γ) of the enzyme on the OTCE, and that under moderate conditions (E < +850 mV), GOx was able to retain its enzymatic activity. On the other side, potential values higher than +850 mV can induce not only the accumulation of larger amounts of enzyme, but also a secondary electrochemical process that irreversibly affects the protein structure and therefore its enzymatic activity. In summary, we believe that these experiments can provide rational guidelines to take advantage of the polarization effect and produce biosensors with a catalytic activity that is significantly better than that obtained at open-circuit potential. Additional experiments are currently underway to provide a more general link between the accumulation process, the oxidation potential, and the catalytic activity.
Highlights.
The adsorption of glucose oxidase can be affected by the application of an external potential
Potentials higher than +600mV are required to induce accumulation
Potentials higher than +850mV can oxidize the protein and result counterproductive
5. Acknowledgements
Financial support for this project has been provided in part by the University of Texas at San Antonio and the National Institutes of Health through the National Institute of General Medical Sciences (2SC3GM081085) and the Research Centers at Minority Institutions (G12MD007591).
Footnotes
Publisher's Disclaimer: This is a PDF file of an unedited manuscript that has been accepted for publication. As a service to our customers we are providing this early version of the manuscript. The manuscript will undergo copyediting, typesetting, and review of the resulting proof before it is published in its final citable form. Please note that during the production process errors may be discovered which could affect the content, and all legal disclaimers that apply to the journal pertain.
The authors have declared no conflict of interests.
References
- 1.Norde W. Macromol. Symp. 1996;103:5. [Google Scholar]
- 2.Vermeer AWP, Norde W. J. Colloid Interface Sci. 2000;225:394. doi: 10.1006/jcis.2000.6769. [DOI] [PubMed] [Google Scholar]
- 3.Norde W, Giacomelli CE. J. Biotechnol. 2000;79:259. doi: 10.1016/s0168-1656(00)00242-x. [DOI] [PubMed] [Google Scholar]
- 4.Norde W. Coll. Surfaces B. 2008;61:1. doi: 10.1016/j.colsurfb.2007.09.029. [DOI] [PubMed] [Google Scholar]
- 5.Rabe M, Verdes D, Seeger S. Adv. Colloid Interface Sci. 2011;162:87. doi: 10.1016/j.cis.2010.12.007. [DOI] [PubMed] [Google Scholar]
- 6.Vogler EA. Biomaterials. 2012;33:1201. doi: 10.1016/j.biomaterials.2011.10.059. [DOI] [PMC free article] [PubMed] [Google Scholar]
- 7.Zhang L, Sun Y. Biochem. Eng. J. 2010;48:408. [Google Scholar]
- 8.Clark LC, Lyons C. Ann. N. Y. Acad. 1962;102:29. doi: 10.1111/j.1749-6632.1962.tb13623.x. [DOI] [PubMed] [Google Scholar]
- 9.Alharthi SA, Benavidez TE, Garcia CD. Langmuir. 2013;29:3320. doi: 10.1021/la3049136. [DOI] [PMC free article] [PubMed] [Google Scholar]
- 10.Brusatori MA, Tie Y, Van Tassel PR. Langmuir. 2003;19:5089. [Google Scholar]
- 11.Fraaije J, Kleijn J, Van der Graaf M, Dijt J. Biophys. J. 1990;57:965. doi: 10.1016/S0006-3495(90)82616-3. [DOI] [PMC free article] [PubMed] [Google Scholar]
- 12.Song Y-Y, Li Y, Yang C, Xia X-H. Anal. Bioanal. Chem. 2008;390:333. doi: 10.1007/s00216-007-1666-4. [DOI] [PubMed] [Google Scholar]
- 13.Bernabeu P, Caprani A. Biomaterials. 1990;11:258. doi: 10.1016/0142-9612(90)90007-d. [DOI] [PubMed] [Google Scholar]
- 14.Benavidez TE, Garcia CD. Electrophoresis. 2013;34:1998. doi: 10.1002/elps.201300022. [DOI] [PMC free article] [PubMed] [Google Scholar]
- 15.Benavidez TE, Garcia CD. Langmuir. 2013;29:14154. doi: 10.1021/la4029657. [DOI] [PMC free article] [PubMed] [Google Scholar]
- 16.Nejadnik MR, Francis L, Garcia CD. Electroanalysis. 2011;23:1462. doi: 10.1002/elan.201000758. [DOI] [PMC free article] [PubMed] [Google Scholar]
- 17.Mora MF, Reza Nejadnik M, Baylon-Cardiel JL, Giacomelli CE, Garcia CD. J. Colloid Interface Sci. 2010;346:208. doi: 10.1016/j.jcis.2010.02.019. [DOI] [PMC free article] [PubMed] [Google Scholar]
- 18.Fujiwara H. Spectroscopic ellipsometry: principles and applications. John Wiley & Sons; 2007. [Google Scholar]
- 19.Hampton MA, Nguyen AV. Adv. Colloid Interface Sci. 2010;154:30. doi: 10.1016/j.cis.2010.01.006. [DOI] [PubMed] [Google Scholar]
- 20.Tyrrell JWG, Attard P. Phys. Rev. Lett. 2001;87:176104. doi: 10.1103/PhysRevLett.87.176104. [DOI] [PubMed] [Google Scholar]
- 21.Borkent BM, Dammer SM, Schönherr H, Vancso GJ, Lohse D. Phys. Rev. Lett. 2007;98:204502. doi: 10.1103/PhysRevLett.98.204502. [DOI] [PubMed] [Google Scholar]
- 22.Craig VSJ. Soft Matter. 2011;7:40. [Google Scholar]
- 23.Hecht HJ, Schomburg D, Kalisz H, Schmid RD. Biosens Bioelectron. 1993;8:197. doi: 10.1016/0956-5663(93)85033-k. [DOI] [PubMed] [Google Scholar]
- 24.Wilson R, Turner APF. Biosens. Bioelectron. 1992;7:165. [Google Scholar]
- 25.Bankar SB, Bule MV, Singhal RS, Ananthanarayan L. Biotechnol. Adv. 2009;27:489. doi: 10.1016/j.biotechadv.2009.04.003. [DOI] [PubMed] [Google Scholar]
- 26.Hecht HJ, Schomburg D, Kalisz H, Schmid RD. Biosens. Bioelectron. 1993;8:197. doi: 10.1016/0956-5663(93)85033-k. [DOI] [PubMed] [Google Scholar]
- 27.Pazur JH, Kleppe K. Biochemistry. 1964;3:578. doi: 10.1021/bi00892a018. [DOI] [PubMed] [Google Scholar]
- 28.Guiseppi-Elie A, Lei C, Baughman RH. Nanotechnology. 2002;13:559. [Google Scholar]
- 29.Phillips JC, Braun R, Wang W, Gumbart J, Tajkhorshid E, Villa E, Chipot C, Skeel RD, Kalé L, Schulten K. J. Comput. Chem. 2005;26:1781. doi: 10.1002/jcc.20289. [DOI] [PMC free article] [PubMed] [Google Scholar]
- 30.Humphrey W, Dalke A, Schulten K. J. Mol. Graphics. 1996;14:33. doi: 10.1016/0263-7855(96)00018-5. [DOI] [PubMed] [Google Scholar]
- 31.Kubiak-Ossowska K, Mulheran PA. Langmuir. 2012;28:15577. doi: 10.1021/la303323r. [DOI] [PubMed] [Google Scholar]
- 32.Baker Nathan A, Sept David, Joseph Simpson, Holst Michael J, McCammon JA. PNAS. 2001;98:10037. doi: 10.1073/pnas.181342398. [DOI] [PMC free article] [PubMed] [Google Scholar]
- 33.Felder CE, Prilusky J, Silman I, Sussman JL. Nucleic Acids Res. 2007;35:W512. doi: 10.1093/nar/gkm307. [DOI] [PMC free article] [PubMed] [Google Scholar]
- 34.Bekard I, Dunstan DE. Soft Matter. 2014;10:431. doi: 10.1039/c3sm52653d. [DOI] [PubMed] [Google Scholar]
- 35.Miller S, Janin J, Lesk AM, Chothia C. J. Mol. Biol. 1987;196:641. doi: 10.1016/0022-2836(87)90038-6. [DOI] [PubMed] [Google Scholar]
- 36.Goran JM, Mantilla SM, Stevenson KJ. Anal. Chem. 2013;85:1571. doi: 10.1021/ac3028036. [DOI] [PubMed] [Google Scholar]
- 37.Szucs A, Hitchens GD, Bockris JOM. J. Electrochem. Soc. 1989;136:3748. [Google Scholar]
- 38.Wooten M, Karra S, Zhang M, Gorski W. Anal. Chem. 2013;86:752. doi: 10.1021/ac403250w. [DOI] [PMC free article] [PubMed] [Google Scholar]
- 39.Vacek J, Vrba J, Zatloukalová M, Kubala M. Electrochim. Acta. 2014 [Google Scholar]
- 40.Wei M-Y, Famouri P, Guo L-H. TrAC, Trends Anal. Chem. 2012;39:130. [Google Scholar]
- 41.Permentier HP, Bruins AP. J. Am. Soc. Mass Spectrom. 2004;15:1707. doi: 10.1016/j.jasms.2004.09.003. [DOI] [PubMed] [Google Scholar]
- 42.Haynes CA, Norde W. J. Colloid Interface Sci. 1995;169:313. [Google Scholar]
- 43.Norde W. Colloids Surf. B. 2008;61:1. doi: 10.1016/j.colsurfb.2007.09.029. [DOI] [PubMed] [Google Scholar]
- 44.Lide DR. CRC Handbook of Chemistry and Physics - 77th edition 1996–1997. CRC Press; 1996. [Google Scholar]


