Abstract
Surface microroughness plays an important role in determining osteoblast behavior on titanium. Previous studies have shown that osteoblast differentiation on microtextured titanium substrates is dependent on alpha-2 beta-1 (α2β1) integrin signaling. This study used focused ion beam (FIB) milling and scanning electron microscopy (SEM), combined with 3D image reconstruction, to investigate early interactions of individual cells with their substrate and the role of integrin α2β1 in determining cell shape. MG63 osteoblast-like cells on sand blasted/acid etched (SLA) Ti surfaces after 3 days of culturing indicated decreased cell number, increased cell differentiation, and increased expression of mRNA levels for α1, α2, αV and β1 integrin subunits compared to cells on smooth Ti (PT) surfaces. α2 or β1 silenced cells exhibited increased cell number and decreased differentiation on SLA compared to wild type cells. Wild type cells on SLA possessed an elongated morphology with reduced cell area, increased cell thickness, and more apparent contact points. Cells on PT exhibited greater spreading and were relatively flat. Silenced cells possessed a morphology and phenotype similar to wild type cells grown on PT. These observations indicate that surface microroughness affects cell response via α2β1 integrin signaling, resulting in a cell shape that promotes osteoblastic differentiation.
Keywords: osteoblast, surface microroughness, 3D reconstruction, focused ion beam, α2β1 integrin, cell morphology
Introduction
Although titanium has been widely used in orthopaedic and dental implants [1, 2], the mechanisms causing osseointegration between the implant and bone tissue are still not fully understood. We and others have noted that osteoblasts tend to spread relatively uniformly on smooth titanium surfaces to yield non-aspected cell shapes, while they elongate to form aspected cell shapes on rough surfaces [3-6]. Cells initially come into contact with titanium implant surfaces through interaction with adsorbed proteins via integrin binding [7-9]. This process is sensitive to implant surface properties, such as micron-scale roughness, topography, chemical composition, and wettability [10-12]. These surface properties have been shown to influence cell attachment, adhesion, migration, proliferation, and differentiation [13-15]. Previously, we demonstrated that microstructured titanium surfaces can inhibit osteoblast proliferation and promote osteoblast differentiation [3, 4, 16, 17], which suggested that early integrin-dependent events at the interface are important.
Integrins are a large family of heterodimeric transmembrane receptors composed of alpha and beta subunits. Each αβ combination has its own binding specificity, with corresponding intracellular signaling pathways [18, 19]. Studies have shown that different αβ combinations induce different cellular responses in osteoblasts grown on titanium substrates. The β1 integrin subunit plays an important role in osteoblast differentiation modulated by surface microarchitecture. It partners with a number of α subunits, with different protein targets. α5β1, which binds to sites on fibronectin, mediates osteoblast attachment and proliferation on Ti surfaces [20]. Others have shown that the alignment of fibronectin fibrils depended on the capability of β1-integrins to form fibrillar adhesions, which was in turn affected by the surface roughness of titanium [21], thereby demonstrating the interrelationship between the cell and proteins adsorbed on the substrate.
When β1 is knocked down, osteoblast differentiation on rough, textured Ti is prevented [22], which suggests that β1 partners other than α5 are involved. Recently, we showed that α2β1, which binds to sites on collagen, does mediate responses to micron-scale roughness, including osteoblast differentiation of mesenchymal stem cells and cells already committed to the osteoblast lineage [23, 24].
The goal of the present study was to examine the role of α2β1 in determining early surface-dependent differences in cell shape. To accomplish this, we used high resolution focused ion beam (FIB) milling with scanning electron microscope (SEM) analyses. FIB milling has traditionally been used to prepare various materials for transmission electron microscope (TEM) analyses [25, 26]. It can also be used to prepare cross sections of biological samples for interrogating cell/surface interfaces [27-31]. We systematically investigated changes in cell morphology with varying microroughness using FIB/SEM, cytomorphometric analysis, and 3D reconstructions. Cells were cultured on smooth and microtextured Ti surfaces for 3 days, during which initial attachment occurred and mRNA could be generated in response to surfaces. Following fixation, individual cells and their underlying substrates were cross-sectioned using FIB milling. Cross-sectional images were analyzed to evaluate cell shape and size, as well as the number of apparent contact points and the distance and volume of the space between the cell and substrate. Results were compared to cells that were silenced for α2 and β1 subunits in order to evaluate the role of integrin expression on cell morphology and its correlation to cell function.
2. Materials and methods
2.1 Titanium (Ti) substrates
Ti disks (grade 2 unalloyed Ti, 15 mm in diameter, 1 mm thick) were supplied by Institut Straumann AG (Basel, Switzerland). After degreasing with acetone, the disks were immersed in an aqueous solution of 2% w ammonium fluoride, 2% v/v of 40% hydrofluoric acid and 10% v/v of 65% nitric acid at 55 °C for 30 s to produce “pretreated” Ti (PT) disks. The PT disks were further sandblasted with corundum grit (0.25-0.50 μm diameter), followed by an acid etch treatment, to generate microrough (SLA) surfaces. The surface characteristics of such disks have previously been described in detail [32-34].
2.2 Cell culture
Osteoblast-like MG63 cells (American Type Culture Collection, Rockville, MD) were cultured in Dulbecco's modified Eagle's medium (DMEM; Mediatech, Inc., Manassas, VA) supplemented with 10% v/v fetal bovine serum (Gibco, Carlsbad, CA) and 1% v/v penicillin– streptomycin (5,000 units/mL Penicillin and 5,000 μg/mL Streptomycin, Gibco) at 37 °C under 5% CO2. The MG63 cells were plated at 10,000 cells/cm2 on tissue culture polystyrene (TCPS), PT, and SLA surfaces.
2.3 Cell response
After plating and culturing for 48 h, cells were incubated with fresh medium and cultured for an additional 24 h. The conditioned media were collected for analyses of osteocalcin (OCN) and osteoprotegerin (OPG). Cell layers were rinsed two times with phosphate buffered saline (PBS) and lysed in 0.5 ml/well of 0.05% v/v 1.7M Triton X-100 (Sigma Aldrich, St. Louis, MO). DNA content was measured using a Quant-iT™ PicoGreen dsDNA Assay Kit (Invitrogen, Carlsbad, CA) to obtain an approximate cell number. Fluorescence measurements were conducted using a fluorescent multimode detector (DTX880, Beckman Coulter, Brea, CA). Alkaline phosphatase (ALP) activity was measured in cell lysates as a function of p-nitrophenol (pNP) production from p-nitrophenylphosphate (pNPP) at pH 10.2 and normalized to total protein content, which was measured using a BCA Protein Assay Kit (Pierce) [35]. OCN production was measured by radioimmunoassay (Human Osteocalcin RIA Kit, Biomedical Technologies, Inc., Stoughton, MA) [13] and OPG production was measured by enzyme-linked immunosorbent assay (ELISA) (DuoSet, R&D Systems, Minneapolis, MN) [36] and normalized to DNA content. Each variable was assessed on 6 disks (n=6) per surface type per experiment. Experiments were performed at least twice to ensure validity of the results.
2.4 Role of α2β1
2.4.1 Integrin expression
MG63 cells were plated on TCPS, PT, and SLA surfaces as described above. After 60 h of total culture time, cells were incubated with fresh medium and cultured for an additional 12 h. Total RNA was extracted using TriZol (Invitrogen) according to the manufacturer's protocol and measured using a Nanodrop spectrophotometer (Thermo Scientific, Waltham, MA). 250 ng of RNA was reverse transcribed into cDNA (High Capacity cDNA Kit, Applied Biosystems, Carlsbad, CA) and the cDNA was amplified by real-time PCR with gene-specific primers using Power Sybr Green (Applied Biosystems). mRNA levels for α1, α2, α5, αV, β1 and β3 integrin subunits were quantified using standard curves created by known dilutions of MG63 cells and normalized to GAPDH. The primers (Table 1) were designed using Beacon Designer Software and synthesized by Eurofins MWG Operon (Huntsville, AL) [12]. For these experiments, mRNA was extracted from cells grown on 6 disks per surface type.
Table 1.
Primer sequences used for Real-time PCR analyses of gene expression.
| Gene | Primer sequence | Accession number | |
|---|---|---|---|
| GAPDH | R | GCG AGC ACA GGA AGA AGC | NM_002046.3 |
| F | GCT CTC CAG AAC ATC ATC C | ||
| ITGA1 | R | TGC TTC ACC ACC TTC TTG | NM_181501.1 |
| F | CAC TCG TAAATGCCAAGAAAAG | ||
| ITGA2 | R | TAGAACCCAACACAAAGATGC | NM_002203 |
| F | ACT GTT CAA GGA GGA GAC | ||
| ITGA5 | R | GGT CAA AGG CTT GTT TAG G | NM_002205 |
| F | ATC TGT GTG CCT GAC CTG | ||
| ITGAV | R | AAG TTC CCT GGG TGT CTG | NM_002210.2 |
| F | GTT GCT ACT GGC TGT TTT GG | ||
| ITGB1 | R | CTG CTC CCT TTC TTG TTC TTC | NM_002211 |
| F | ATT ACT CAG ATC CAA CCA C | ||
| ITGB3 | R | TCC TCC TCA TTT CAT TCA TC | NM_000212 |
| F | AAT GCC ACC TGC CTC AAC | ||
2.4.2 Silencing integrin α2 and β1 subunits
MG63 cells that were stably silenced for either α2 or β1 integrin subunits were used for this study [22, 24]. Briefly, MG63 cells were transduced with shRNA lentiviral transduction particles targeting mRNAs for either integrin α2 (SHCLNV-NM 002203.3, Sigma-Aldrich) or β1 (SHCLNV-NM_002211, Sigma-Aldrich). MG63 cells were plated at 20,000 cells/cm2 and cultured overnight and lentivirus particles were added to the cells at a multiplicity of infection (MOI) of 7.5. After 18 h of total culture time, transduced cells were selected with full medium containing 0.25 μg/ml puromycin (Sigma–Aldrich). Silencing was confirmed using real-time PCR and western blot analysis [24].
2.4.3 Cell morphology
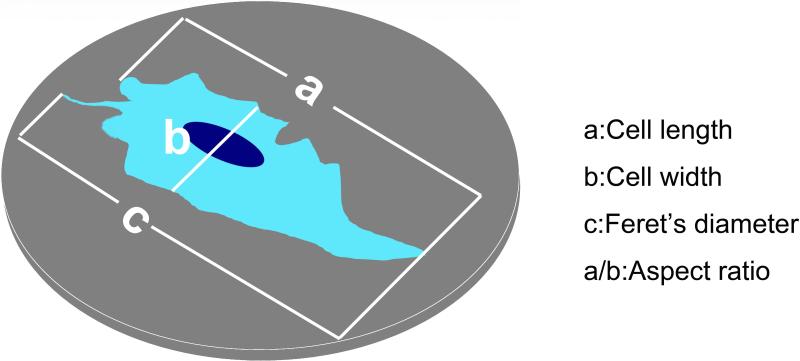
Wild type MG63 cells were plated on PT and SLA substrates, and α2-silenced and β1-silenced cells were plated on SLA substrates, as described above. After culturing for 72 h, cells were washed three times with PBS and fixed overnight with Karnovsky's fixative solution (Electron Microscopy Sciences, Hatfield, PA). Cultures were washed three times with PBS and dehydrated with a graded series of aqueous ethanol solutions (15%, 30%, 45%, 60%, 75%, 90% and 100% v/v ethanol). Finally, samples were dried using an EMS 850 critical point drier (Electron Microscopy Sciences, Hatfield, PA), mounted on aluminum stubs, and sputter coated with gold for 1 min using a SC7640 Polaron Sputter Coater (Quorum Technologies, Ontario, Canada) with a current of 18 mA and a voltage of 2.2 V. Images were obtained using a Hitachi S800 SEM with an accelerating voltage of 4 kV. Cell morphologies were analyzed using Image J software (National Institutes of Health, Bethesda, MD). Cell parameters such as length, width, area, perimeter (the length of the outside boundary of the cell), Feret's diameter (the longest distance between any two points on the cell boundary), aspect ratio (length divided by width), roundness or the inverse of aspect ratio), and circularity [ with a value of 1.0 indicating a perfect circle)] were determined (Fig. 1). More than 60 cells per disk and 3 disks per specimen (cell/substrate) type were analyzed.
Figure 1.
Cell morphology parameters: cell length (a), cell width (b) and Feret's diameter (c).
2.5 Cell/material interface
2.5.1 Focused ion beam (FIB) milling
Serial sections of the cells with their underlying substrate were obtained by focused ion beam milling using a Nova Nanolab 200 FIB/SEM (FEI, Hillsboro, OR). Samples were adjusted at a working distance of 5 mm and tilted to 52 ° in order to reach the coincident point of the electron beam (e-beam) and the gallium ion beam (ion-beam). Serial sections were obtained every 2 μm by milling with the ion beam using an acceleration voltage of 30 keV, a beam current between 0.5 and 1.0 nA, and a milling time of 4 – 8 min per “cut”. Secondary electron images were obtained using the e-beam with an acceleration voltage of 5 keV and a current of 1.6 nA.
2.5.2 Three dimensional reconstruction and analysis
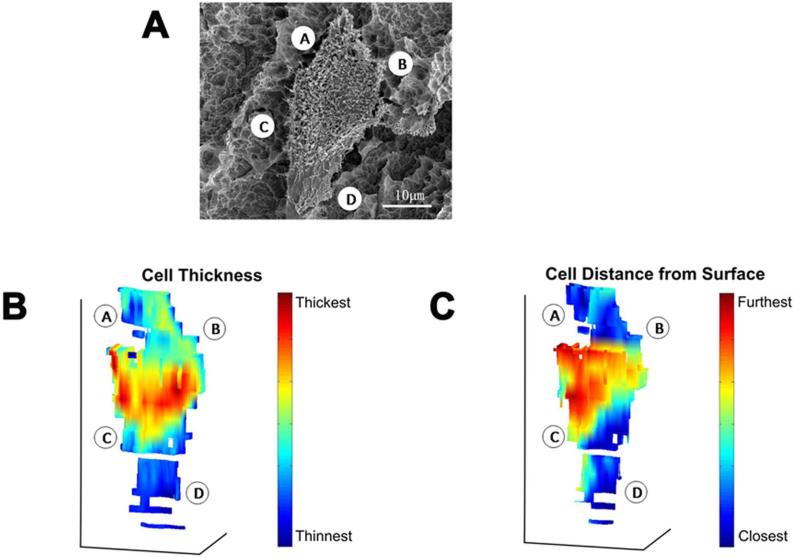
After milling, three-dimensional (3D) reconstructions of individual cells were generated from secondary electron images. The number of cuts required to mill through each cell, average cell thickness, average cross sectional area, cell volume, and average distance and volume of space between the cell and substrate surface, as well as the total and average number of apparent contact points between the cell and substrate surface, were determined after outlining the observed cell boundaries. The reconstructions were created by tracing the boundary of each individual section and aligning the boundaries in 3D based on the locations of the individual sections. A color gradient was used to represent either cell thickness or the distance between the cells and the surface. Red represented the thickest region of the cell or the furthest distance between the cell and substrate surface, while blue was the thinnest region or closest distance. All 3D reconstruction and analysis software was written using Matlab (version R2010a, Mathworks). One cell per disk and six disks per cell/substrate type were analyzed.
2.6 Statistical analysis
All data are expressed as mean ± standard error of the mean (StEM). Statistical analyses were performed with one-way analysis of variance (ANOVA) and Bonferroni's modification of Student's t-test, with p values less than 0.05 considered to be statistically significant. The presented data in bar graphs were obtained from one of two repeated experiments, with both experiments yielding comparable results.
3. Results
3.1 Cell response
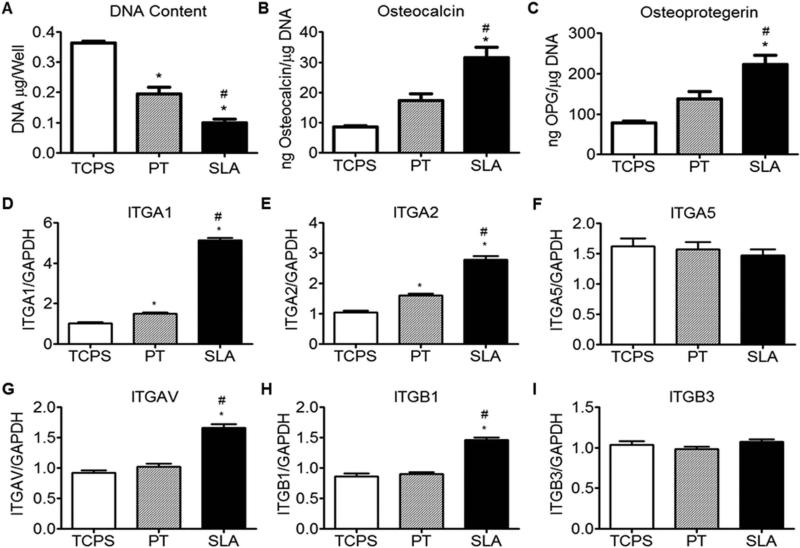
At three days after plating, cultures on titanium substrates exhibited reduced DNA content compared to cultures on TCPS (SLA < PT < TCPS) (Fig. 2A). In contrast, the OCN and OPG contents detected in the conditioned media were greater in cultures grown on SLA than for cultures on both PT and TCPS surfaces (SLA > PT > TCPS) (Fig. 2B,C). Messenger RNAs for α1 and α2 were higher for cells on the Ti surfaces than on TCPS (SLA > PT > TCPS) (Fig. 2D,E). In contrast, mRNAs for α5 were comparable for cells on all substrates examined (Fig. 2F). Expression of mRNAs for αV and β1 were significantly higher for cells on SLA than for cells on both PT and TCPS surfaces (Fig. 2G,H). Integrin β3 results were comparable for cells on all substrates (Fig. 2I).
Figure 2.
Effect of substrate microstructure on the behavior of MG63 cells. Cells were grown on TCPS, PT, and SLA substrates. At 3 days, DNA content (A), OCN (B), and OPG (C) were measured and integrin subunit mRNA expression of MG63 cells was evaluated for α1 (D), α2 (E), α5 (F), αV (G), β1 (H) and β3 (I). Data represented are mean ± one standard error of the mean (StEM) of six independent samples. *p < 0.05, Ti vs TCPS; #p < 0.05, SLA vs PT.
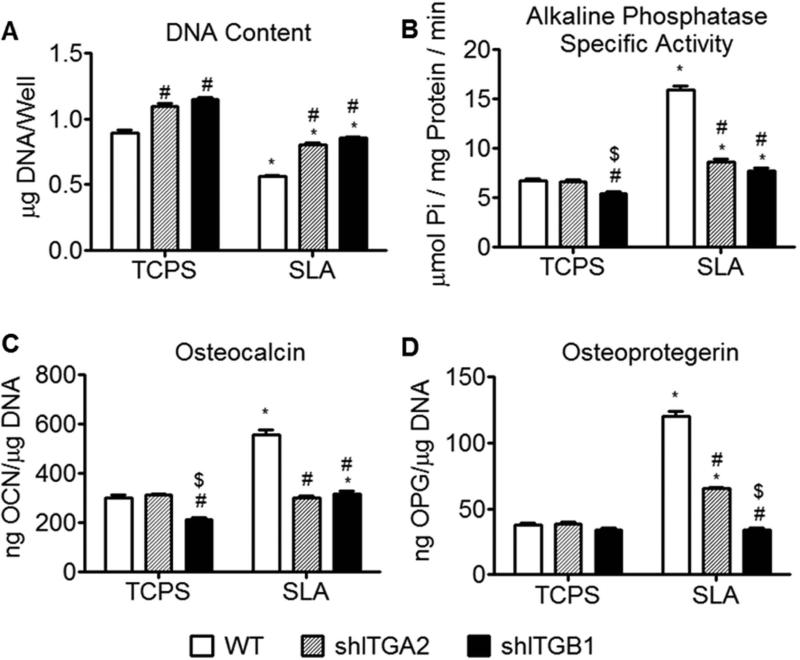
Knock down of α2 resulted in increased DNA on TCPS and SLA surfaces, and reduced alkaline phosphatase activity and production of osteocalcin and osteoprotegerin on SLA surfaces, relative to wild type cultures (Fig 3A-D). Knock down of β1 resulted in increased DNA content on TCPS and SLA surfaces (Fig. 3A), decreased alkaline phosphatase on TCPS and SLA surfaces (Fig 3B), reduced osteocalcin on TCPS and SLA surfaces (Fig. 3C), and reduced osteoprotegerin on the SLA surface (Fig 3D) relative to wild type cultures.
Figure 3.
Effect of integrins on the behavior of different cells. Wild type MG63 cells, α2-silenced MG63 cells, and β1-silenced MG63 cells were grown on TCPS and SLA surfaces. At 3 days, DNA content (A), alkaline phosphatase specific activity (B), OCN (C), and OPG (D) were measured. Data represented are mean ± StEM of six independent samples. *p < 0.05, vs TCPS; #p < 0.05, vs WT, $p < 0.05, vs α2-silenced MG63 cells on SLA.
3.2 Cell shape
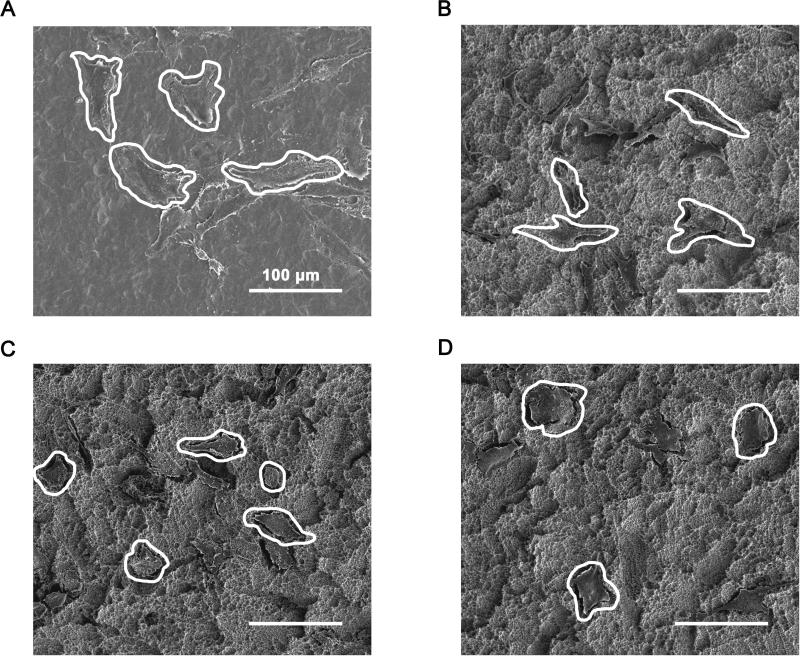
Wild type cells grown on PT had spread to become relatively flat and possessed relatively large areas when viewed from above (Fig. 4A). In contrast, cells grown on SLA were generally shorter and possessed an elongated (more aspected) morphology (Fig. 4B). After α2 and β1 silencing, cells grown on SLA had spread to become relatively flat and generally less aspected (Fig. 4C,D). This was particularly evident for the β1-silenced cells (Fig. 4D).
Figure 4.
Cell morphology analyses: SEM images of wild type MG63 cells grown on PT (A) and SLA (B) surfaces, α2-silenced MG63 cells grown on an SLA surface (C), and β1-silenced MG63 cells grown on an SLA surface (D). Scale bars = 100 μm.
Detailed quantitative cytomorphometric analysis confirmed the qualitative SEM observations. The lengths of wild type MG63 cells grown on PT substrates exhibited a roughly normal distribution spanning from 20 μm to >120 μm, with a peak in the distribution at 80-90 μm (Supplemental Fig. 1A). Cells grown on SLA possessed lengths varying from <20 μm to 120 μm, with peak lengths at 60-70 μm (Supplemental Fig. 1A). The widths of wild type cells grown on PT surfaces varied from 10 μm to >45 μm, with a peak at 20-25 μm, whereas the cell widths on SLA varied from <10 μm to 40 μm, with a peak at 10-15 μm (Supplemental Fig. 1B). These results indicated that the cells had a more elongated (aspected) shape on SLA than on PT surfaces. While cell widths were distributed in a roughly normal fashion on PT surfaces, cell widths on SLA exhibited a noticeably skewed distribution, with more than 80% of the cells being ≤25 μm in width. Cell areas (viewed from above) also varied with surface topography. Wild type cells cultured on PT surfaces possessed areas varying from <500 μm2 to 3,000 μm2, with most cell areas falling between 1,000-2,000 μm2 (Supplemental Fig. 1C). In contrast, more than 80% of the cells grown on SLA surfaces possessed areas less than 1,000 μm2 (Supplemental Fig. 1C). Sixty percent of the cells grown on PT surfaces possessed an aspect ratio ≤2-3, whereas most of the cells grown on SLA surfaces possessed an aspect ratio of ≥3-4 (Supplemental Fig. 1D).
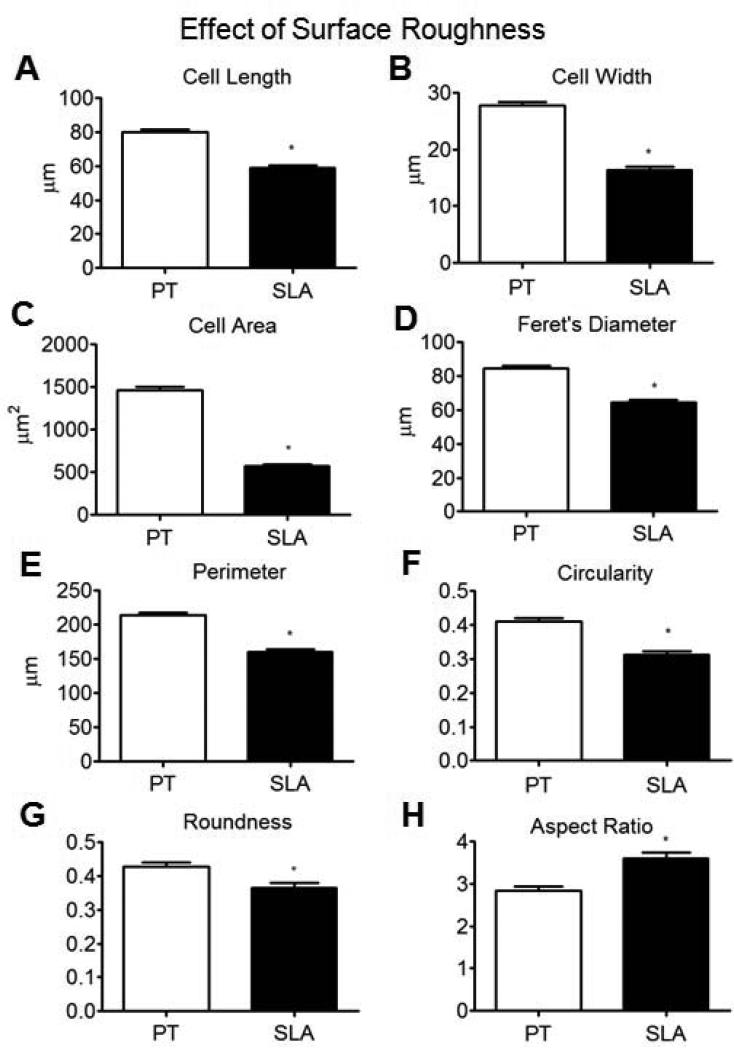
The overall distributions of morphological traits were also reflected in the mean values for each parameter. Compared with cells on PT surfaces, cells grown on SLA substrates displayed significantly smaller mean values of cell length, cell width, cell area, Feret's diameter, perimeter, circularity, and roundness (Fig. 5A-G). As a result, cells grown on SLA surfaces possessed a significantly larger value of average aspect ratio (Fig. 5H).
Figure 5.
Cytomorphometric analyses of wild type MG63 cells grown on PT and SLA surfaces: cell length (A), cell width (B), cell area (C), Feret's diameter (D), perimeter (E), circularity (F), roundness (G), and aspect ratio (H) (n>180). *p < 0.05, WT on SLA vs WT on PT.
3.3 Role of α2 and β1
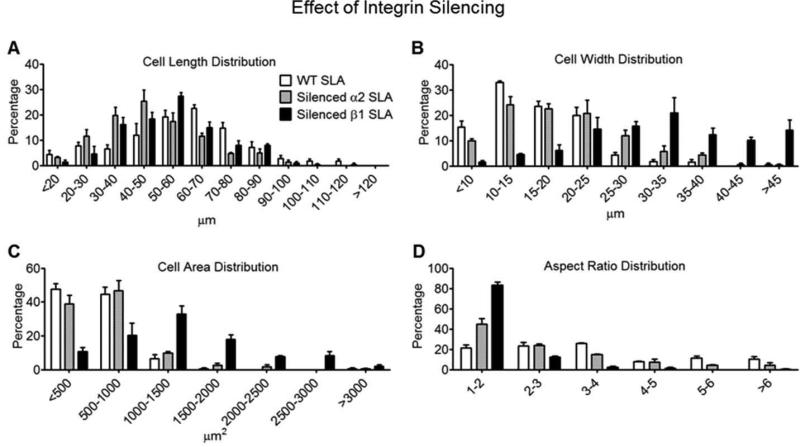
Silencing either α2 or β1 subunits altered the shapes of MG63 cells grown on SLA substrates. Cell lengths were distributed in a roughly normal fashion. Wild type MG63 cells exhibited a peak in the cell length distribution at 60-70 μm. However, peaks in the lengths of α2-silenced and β1-silenced cells grown on SLA were observed at 40-50 μm and 50-60 μm, respectively (Fig. 6A). The predominant widths of α2-silenced and β1-silenced cells were 10-15 μm and 30-35 μm, respectively (Fig. 6B). Wild type cells exhibited a significantly skewed distribution with respect to cell width; that is, a peak in cell width was observed at 10-15 μm and >80% of the cells possessed widths of ≤25 μm. α2-silenced cells exhibited a similar skewed distribution, but with fewer cell widths at ≤15 μm and more cells with widths of ≥25 μm. In contrast, cells silenced for β1 possessed widths of predominantly >25 μm, with 50% of these cells having widths ≥30 μm (Fig. 6B). Wild type cells tended to possess areas of less than 1,000 μm2, as did α2-silenced cells, on SLA substrates. In contrast, the areas of β1-silenced cells were predominantly greater than 1,000 μm2. Most (56 percent) of the wild type cells possessed aspect ratios of 3-4, whereas 69 percent of α2-silenced cells and 96 percent of β1-silenced cells possessed aspect ratios of ≤2-3 (Fig. 6D).
Figure 6.
Cytomorphometric analyses of wild type MG63 cells, α2-silenced MG63 cells, and β1-silenced MG63 cells grown on SLA surfaces: cell length distribution (A), cell width distribution (B), cell area distribution (C), and aspect ratio distribution (D)(n=3).
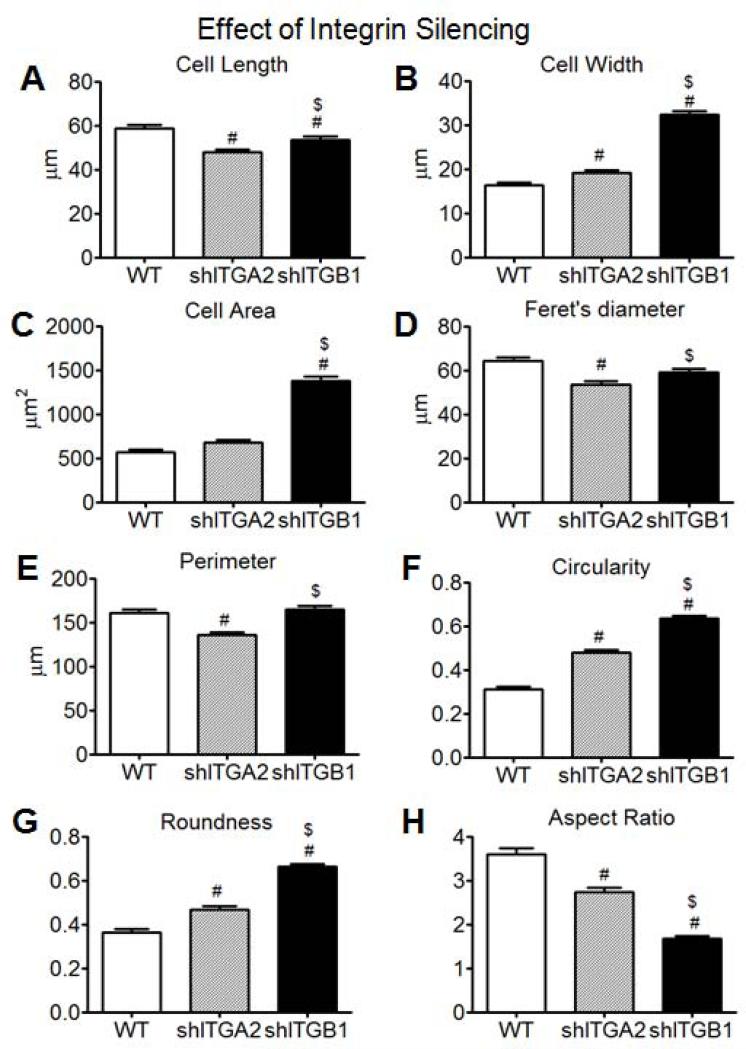
Compared with wild type cells on SLA surfaces, α2-silenced cells grown on SLA displayed a smaller average cell length and a larger average cell width (Fig. 7A,B). While the mean cell area was not statistically affected (Fig. 7C), the mean values of Feret's diameter and perimeter were reduced (Fig. 7D, E) for α2-silenced cells. Mean values of circularity (Fig. 7F) and roundness (Fig. 7G) increased, and the mean aspect ratio decreased (Fig. 7H), for α2-silenced cells relative to wild type cells. Compared to α2-silenced cells, β1-silenced cells displayed larger mean values of cell length, cell width, cell area, Feret's diameter, and perimeter (Fig. 7A-E). Among the different cell types, β1-silenced cells displayed the largest average values of cell area, circularity, and roundness as well as the smallest mean aspect ratio (Fig. 7C,F,G,H).
Figure 7.
Cytomorphometric analyses of wild type MG63 cells, α2-silenced MG63 cells, and β1-silenced MG63 cells grown on SLA surfaces: cell length (A), cell width (B), cell area (C), Feret's diameter (D), perimeter (E), circularity (F), roundness (G), and aspect ratio (H) (n>180). #p < 0.05, silenced cells on SLA vs WT on SLA, $p < 0.05, β1-silenced MG63 cells on SLA vs α2-silenced MG63 cells on SLA.
3.4 Cell/material interface
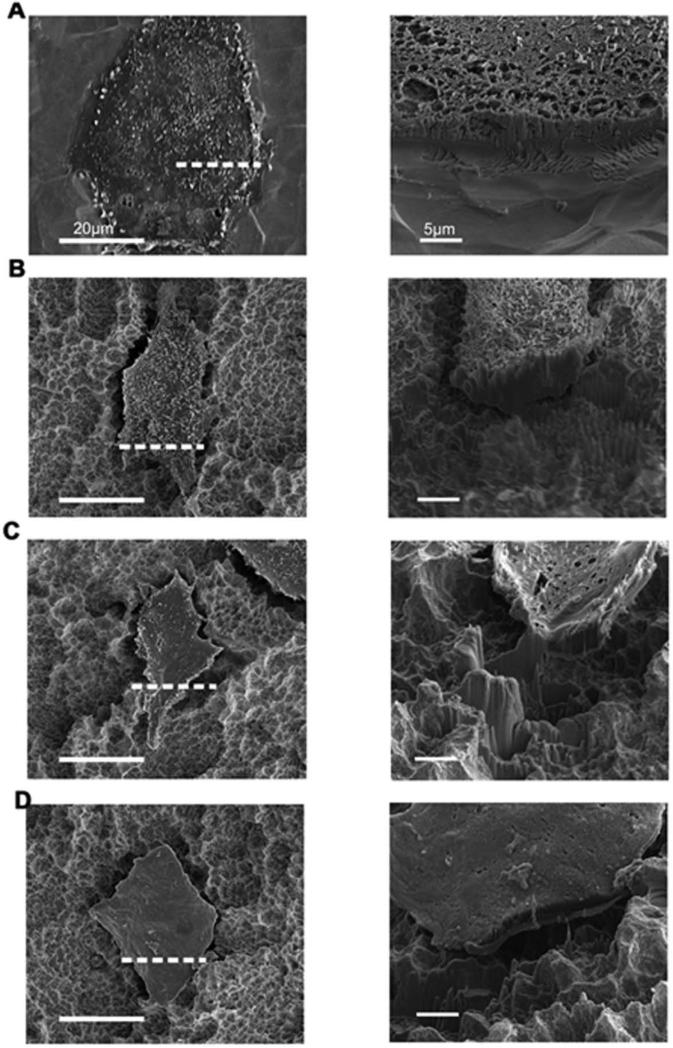
SEM analyses of FIB-milled cross-sections of wild type cells revealed that these cells were well spread on PT surfaces (Fig 8A). When wild type cells were grown on SLA surfaces, the cells appeared to be attached to the tops of the rough Ti projections and to have penetrated into the valleys to form contact points that increased the cell thickness in these valley regions (Fig. 8B). The wild type cells grown on SLA substrates also appeared to possess more filopodia than for cells grown on PT surfaces. α2-silenced cells did not appear to be as well connected to SLA surfaces as wild type cells as evidenced by a larger void space underneath the cell, and exhibited more spreading and reduced cell thickness than for wild type cells on this type of surface (Fig. 8C). Such reduced contact and enhanced spreading was even more evident for β1-silenced cells on the SLA type surface (Fig. 8D). A high magnification view of each cut shown in the right column of images (corresponding to the location indicated by the dashed line in each of the left column images) in Fig. 8 provides a closer view of the cell-material interface.
Figure 8.
Secondary electron (SE) images of the cell-substrate cross-section after FIB milling of wild type MG63 cells grown on PT (A) and SLA(B), α2-silenced MG63 cells grown on SLA (C), and β1-silenced MG63 cells grown on SLA (D). The dashed line in each left column image corresponds to the location of the high magnification cross sectional image shown in the right column for each cell.
After FIB milling, 3D reconstructions of the same complete cell (Fig. 9A) from all cross-sections were created, and cell cross-section parameters were evaluated using Matlab software. A color gradient was used to represent cell thickness with red indicating an increase in the thickness (Fig. 9B) of the main cell body. The same color gradient was used to represent the distance between cell and substrate surface, with red indicating a greater distance (Fig. 9C). Analysis of the 3D reconstruction data indicated that the cells became thicker as the distance between the cell and the substrate surface increased.
Figure 9.
3D reconstructions of a wild type MG63 cell grown on SLA (A), a color gradient indicating its cell thickness (B), the same color gradient indicating the distance between the cell and substrate surface (C). The reconstructions in (B) and (C) are viewed from a top-down perspective, as for the cell shown in (A). The locations indicated by A, B, C and D for the imaged cell in (A) are also indicated in the 3D reconstructions in (B) and (C).
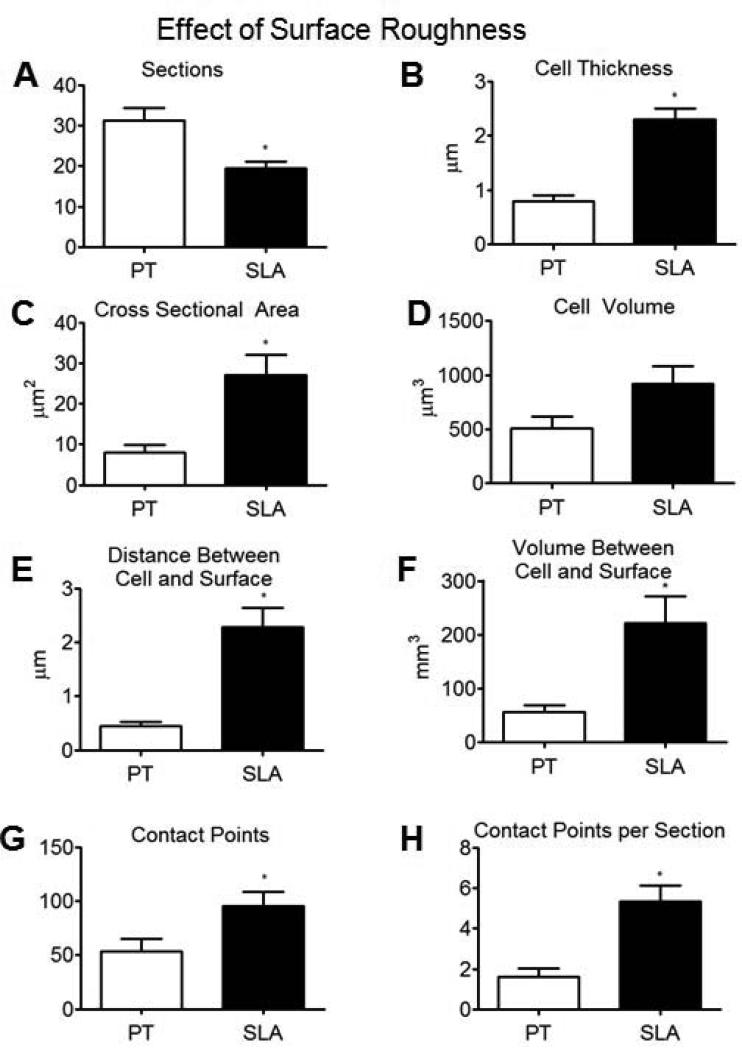
Compared to wild type cells grown on PT surfaces, a smaller number of FIB-milled cuts were required to span cells grown on SLA surfaces (Fig. 10A), as these cells had spread less when cultured on the smoother substrate. The average cell thickness and cross-sectional area were larger for wild type cells grown on SLA surfaces than for these cells grown on PT surfaces (Fig. 10B,C). However, there was no statistical difference in average cell volume between cells grown on PT or SLA surfaces (Fig. 10D). A gap of about 0.5 μm was typically observed between the bottom of the cell body and the PT substrate (Fig. 10E). The average distance between the cell and the substrate surface was larger for cells grown on SLA substrates than on PT substrates (Fig. 10E), and this was also consistent with the observed differences in the average volume of the space between the cell and its underlying surface for both types of substrates (Fig. 10F). Moreover, relative to cells grown on PT surfaces, cells grown on SLA substrates had a higher total number of apparent contact points (Fig. 10G), with each FIB-milled cross-section revealing a greater number of contract points (Fig. 10H); that is, the apparent contact points were distributed over the entire surface and not just at the perimeter.
Figure 10.
Analyses of serial sectioned wild type MG63 cells grown on PT and SLA surfaces; number of cuts (A), mean cell thickness (B), mean cross sectional area (C), mean cell volume (D), mean distance between the cell and substrate surface (E), mean volume of space between the cell and substrate surface (F), number of apparent contact points (G), average number of apparent contact points (H), (n=6).*p < 0.05, WT on SLA vs WT on PT.
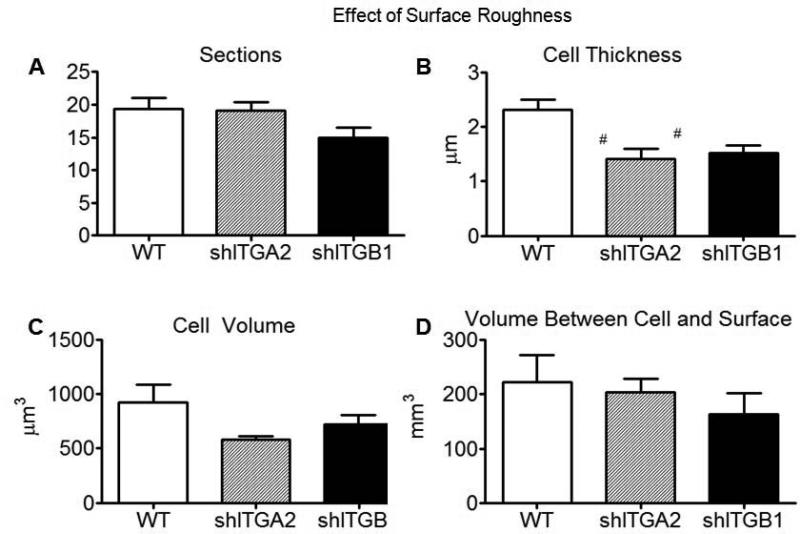
Average cell thickness was significantly smaller in the silenced cells than wild type cells on SLA (Fig. 11B). There was no statistical difference in cell volume, or in the volume of the space between the cell and substrate surface, for different cells grown on SLA (Fig. 11C,D). The average values of cross sectional area and distance between the cell and substrate surface, and the total and average number of apparent contact points between the cell and substrate surface were also not statistically different (data not shown).
Figure 11.
Analyses of serial sectioned wild type MG63 cells, α2-silenced MG63 cells, and β1-silenced MG63 cells grown on SLA surfaces; number of cuts (A), average cell thickness (B), mean cell volume (C), mean volume between the cell and substrate surface (D), (n=6). #p < 0.05, silenced cells on SLA vs WT on SLA.
Discussion
This study used FIB-enabled SEM imaging and a novel algorithm developed in our laboratory to investigate the interface between cells and their substrate, in order to better learn how cell morphology is affected by substrate surface microtexture. Our results confirm prior observations showing that osteoblasts become elongated (more aspected in shape) when cultured on Ti with micron scale and submicron scale roughness, whereas such cells assume a more flattened, less-aspected shape of larger area when grown on smoother Ti surfaces [3, 4]. Moreover, they exhibit a more differentiated phenotype on the rougher surface. Here, we also show that osteoblasts interact with the microtextured substrate at multiple points across the basal surface of the cell, whereas the interactions (i.e., the number of apparent contact points) are fewer for cells on smoother substrates. Importantly, this study demonstrates the role of α2β1 in mediating the cell's shape on microtextured Ti, and supports our previous studies implicating signaling by this integrin in osteoblastic differentiation [22, 23, 37].
Our algorithm enabled us to generate 3D reconstructions of individual cells using cell boundary tracings obtained from the SEM images of FIB-milled cross-sections. Cells grown on SLA surfaces possessed higher values of average cell thickness, average volume of space between the cell and the substrate surface, and average distance between the cell and substrate surface than for cells grown on PT surfaces. Despite this difference in cell shape, there was no statistical difference in cell volume. Similar observations were reported by Wieland, et al. who compared cell shape on Ti replicas of PT and SLA surfaces [38]. The conservation of cell volume indicated that the effect of surface microtexture was due to cytoskeletal conformation and not due to loss or gain of water by the cell.
Previously we reported that cells grown on SLA appear to “tent” over the surface, forming focal adhesions at the ends of their filopodia [39]. The greater volume of space between the wild type cells and SLA surfaces, compared to the cells and PT surfaces, suggested that this does occur. However, the FIB/SEM analyses indicated that cells on SLA were interacting with the microtextured surfaces at multiple foci, and not only at the periphery or filopodia ends. This increase in anchorage may explain the greater forces needed to dissociate osteoblasts from SLA compared to PT surfaces [40], as well as the requirement for sequential trypsin digestions to release the cells from their SLA substrate compared to the case of cells on PT surfaces [41].
Our results also show that the stimulation effect of the surface microtexture observed in confluent cultures on osteoblast differentiation [4] is evident in pre-confluent cultures, as early as 3 days after plating. This suggests that cell shape is a regulatory factor in determining cell phenotype. Others have reported similar findings in studies where cell shape has been controlled via the use of micropatterning [42-44], as well as other techniques [45-47].
Our results also suggest that integrin signaling is a determining factor in mediating the effects of surface microtexture on cell differentiation. We previously reported that integrin expression on PT and SLA changes over time, with reduced expression of α5 and increased expression of α2 and β1 as cultures approach confluence [24]. Exposure of antibodies to individual integrin subunits and specific knockdown of α5, α2 and β1 show that α5 is involved in initial attachment and proliferation [48-50], but α2 is required for differentiation [24]. The present study indicates that α2 may act in part by mediating the cell shape change itself, since osteoblasts stably silenced for α2 and β1 exhibit a morphology on SLA that is similar to wild type cells on PT surfaces. The silenced cells on SLA surfaces were significantly more circular and less thick, which was consistent with enhanced spreading and flattening, in comparison to wild type cells grown on SLA surfaces. Because α2β1 specifically binds to collagen [51], the extracellular matrix synthesis may also have been affected (in addition to cell shape and osteoblastic differentiation).
Conclusion
In this study, we developed a method for correlating cell proliferation and differentiation with integrin expression and function, and cell morphology. SEM analyses of FIB-milled cross-sections were combined with Matlab analyses to evaluate cell shape and size, as well as features at the interface of individual cells and their substrate. 3D reconstructions of whole cells in situ confirmed top-down morphological observations. The introduction of substrate surface microroughness reduced proliferation and promoted differentiation of MG63 osteoblasts, which were mediated by integrin α2β1. Silencing of α2 or β1 subunits resulted in cells exhibited greater spreading and reduced thickness, along with increased cell proliferation and reduced cell differentiation as was typical of wild type cells on relatively smooth surfaces. This study provides a new and useful tool for investigation of the interfaces between cells and biomaterials, and of the relationships between substrate surface roughness and integrins with cell morphology and fate.
Supplementary Material
Supplemental Figure 1. Cytomorphometric analysis of wild type MG63 cells grown on PT and SLA; cell length distribution (A), cell width distribution (B), cell area distribution (C), aspect ratio distribution (D)(n=3).
Acknowledgements
The authors gratefully thank Sharon Hyzy for assistance with the cell study. This work was supported by NIH AR052102 and the China Scholarship Council (2011605043).
References
- 1.Durán A, Conde A, Coedo AG, Dorado T, García C, Ceré S. Sol-gel coatings for protection and bioactivation of metals used in orthopaedic devices. J Mater Chem. 2004;14:2282–2290. [Google Scholar]
- 2.Jovanovic SA, Spiekermann H, Richter EJ. Bone regeneration around titanium dental implants in dehisced defect sites: a clinical study. Int J Oral Maxillofac Implants. 1992;7(2):233–245. [PubMed] [Google Scholar]
- 3.Zhao G, Zinger O, Schwartz Z, Wieland M, Landolt D, Boyan BD. Osteoblast-like cells are sensitive to submicron-scale surface structure. Clin Oral Implants Res. 2006;17(3):258–264. doi: 10.1111/j.1600-0501.2005.01195.x. [DOI] [PubMed] [Google Scholar]
- 4.Zinger O, Zhao G, Schwartz Z, Simpson J, Wieland M, Landolt D, et al. Differential regulation of osteoblasts by substrate microstructural features. Biomaterials. 2005;26(14):1837–1847. doi: 10.1016/j.biomaterials.2004.06.035. [DOI] [PubMed] [Google Scholar]
- 5.Zinger O, Anselme K, Denzer A, Habersetzer P, Wieland M, Jeanfils J, et al. Time-dependent morphology and adhesion of osteoblastic cells on titanium model surfaces featuring scale-resolved topography. Biomaterials. 2004;25(14):2695–2711. doi: 10.1016/j.biomaterials.2003.09.111. [DOI] [PubMed] [Google Scholar]
- 6.Köunönen M, Hormia M, Kivilahti J, Hautaniemi J, Thesleff I. Effect of surface processing on the attachment, orientation, and proliferation of human gingival fibroblasts on titanium. J Biomed Mater Res. 1992;26(10):1325–1341. doi: 10.1002/jbm.820261006. [DOI] [PubMed] [Google Scholar]
- 7.Krause A, Cowles EA, Gronowicz G. Integrin-mediated signaling in osteoblasts on titanium implant materials. J Biomed Mater Res. 2000;52(4):738–747. doi: 10.1002/1097-4636(20001215)52:4<738::aid-jbm19>3.0.co;2-f. [DOI] [PubMed] [Google Scholar]
- 8.Puleo DA, Nanci A. Understanding and controlling the bone-implant interface. Biomaterials. 1999;20(23-24):2311–2321. doi: 10.1016/s0142-9612(99)00160-x. [DOI] [PubMed] [Google Scholar]
- 9.Siebers MC, Ter Brugge PJ, Walboomers XF, Jansen JA. Integrins as linker proteins between osteoblasts and bone replacing materials. A critical review. Biomaterials. 2005;26(2):137–146. doi: 10.1016/j.biomaterials.2004.02.021. [DOI] [PubMed] [Google Scholar]
- 10.Deligianni DD, Katsala N, Ladas S, Sotiropoulou D, Amedee J, Missirlis YF. Effect of surface roughness of the titanium alloy Ti–6Al–4V on human bone marrow cell response and on protein adsorption. Biomaterials. 2001;22(11):1241–1251. doi: 10.1016/s0142-9612(00)00274-x. [DOI] [PubMed] [Google Scholar]
- 11.Cai KY, Frant M, Bossert J, Hildebrand G, Liefeith K, Jandt KD. Surface functionalized titanium thin films: zeta-potential, protein adsorption and cell proliferation. Colloids Surf B Biointerfaces. 2006;50(1):1–8. doi: 10.1016/j.colsurfb.2006.03.016. [DOI] [PubMed] [Google Scholar]
- 12.Park JH, Wasilewski CE, Almodovar N, Olivares-Navarrete R, Boyan BD, Tannenbaum R, et al. The responses to surface wettability gradients induced by chitosan nanofilms on microtextured titanium mediated by specific integrin receptors. Biomaterials. 2012;33(30):7386–7393. doi: 10.1016/j.biomaterials.2012.06.066. [DOI] [PMC free article] [PubMed] [Google Scholar]
- 13.Lincks J, Boyan BD, Blanchard CR, Lohmann CH, Liu Y, Cochran DL, et al. Response of MG63 osteoblast-like cells to titanium and titanium alloy is dependent on surface roughness and composition. Biomaterials. 1998;19(23):2219–2232. doi: 10.1016/s0142-9612(98)00144-6. [DOI] [PubMed] [Google Scholar]
- 14.Ponsonnet L, Reybier K, Jaffrezic N, Comte V, Lagneau C, Lissac M, et al. Relationship between surface properties (roughness, wettability) of titanium and titanium alloys and cell behaviour. Mat Sci Eng C. 2003;23(4):551–560. [Google Scholar]
- 15.Khang D, Choi J, Im YM, Kim YJ, Jang JH, Kang SS, et al. Role of subnano-, nano-and submicron-surface features on osteoblast differentiation of bone marrow mesenchymal stem cells. Biomaterials. 2012;33(26):5997–6007. doi: 10.1016/j.biomaterials.2012.05.005. [DOI] [PubMed] [Google Scholar]
- 16.Boyan BD, Dean DD, Lohmann CH, Cochran DL, Sylvia VL, Schwartz Z. The titanium-bone cell interface in vitro: The role of the surface in promoting osteointegration. In: Brunette DM, Tengvall P, Textor M, Thomsen P, editors. Titanium in medicine. Berlin and Heidelberg. Springer; 2001. pp. 561–586. [Google Scholar]
- 17.Schwartz Z, Olivares-Navarrete R, Wieland M, Cochran DL, Boyan BD. Mechanisms regulating increased production of osteoprotegerin by osteoblasts cultured on microstructured titanium surfaces. Biomaterials. 2009;30(20):3390–3396. doi: 10.1016/j.biomaterials.2009.03.047. [DOI] [PMC free article] [PubMed] [Google Scholar]
- 18.Hynes RO. Integrins: versatility, modulation, and signaling in cell adhesion. Cell. 1992;69(1):11–25. doi: 10.1016/0092-8674(92)90115-s. [DOI] [PubMed] [Google Scholar]
- 19.Giancotti FG, Ruoslahti E. Integrin signaling. Science. 1999;285(5430):1028–1033. doi: 10.1126/science.285.5430.1028. [DOI] [PubMed] [Google Scholar]
- 20.Keselowsky BG, Wang L, Schwartz Z, Garcia AJ, Boyan BD. Integrin alpha(5) controls osteoblastic proliferation and differentiation responses to titanium substrates presenting different roughness characteristics in a roughness independent manner. J Biomed Mater Res A. 2006;80A(3):700–710. doi: 10.1002/jbm.a.30898. [DOI] [PubMed] [Google Scholar]
- 21.Lüthen F, Lange R, Becker P, Rychly J, Beck U, Nebe JG. The influence of surface roughness of titanium on beta1-and beta3-integrin adhesion and the organization of fibronectin in human osteoblastic cells. Biomaterials. 2005;26(15):2423–2440. doi: 10.1016/j.biomaterials.2004.07.054. [DOI] [PubMed] [Google Scholar]
- 22.Wang LP, Zhao G, Olivares-Navarrete R, Bell BF, Wieland M, Cochran DL, et al. Integrin beta1 silencing in osteoblasts alters substrate-dependent responses to 1,25-dihydroxy vitamin D3. Biomaterials. 2006;27(20):3716–3725. doi: 10.1016/j.biomaterials.2006.02.022. [DOI] [PubMed] [Google Scholar]
- 23.Olivares-Navarrete R, Hyzy SL, Hutton DL, Erdman CP, Wieland M, Boyan BD, et al. Direct and indirect effects of microstructured titanium substrates on the induction of mesenchymal stem cell differentiation towards the osteoblast lineage. Biomaterials. 2010;31(10):2728–2735. doi: 10.1016/j.biomaterials.2009.12.029. [DOI] [PMC free article] [PubMed] [Google Scholar]
- 24.Olivares-Navarrete R, Raz P, Zhao G, Chen JD, Wieland M, Cochran DL, et al. Integrin alpha2beta1 plays a critical role in osteoblast response to micron-scale surface structure and surface energy of titanium substrates. Proc Natl Acad Sci USA. 2008;105(41):15767–15772. doi: 10.1073/pnas.0805420105. [DOI] [PMC free article] [PubMed] [Google Scholar]
- 25.Giannuzzi LA, Stevie FA. A review of focused ion beam milling techniques for TEM specimen preparation. Micron. 1999;30(3):197–204. [Google Scholar]
- 26.Li J, Malis T, Dionne S. Recent advances in FIB-TEM specimen preparation techniques. Mater Charact. 2006;57(1):64–70. [Google Scholar]
- 27.Bittermann AG, Burkhardt C, Hall H. Imaging of Cell-to-Material Interfaces by SEM after in situ Focused Ion Beam Milling on Flat Surfaces and Complex 3D-Fibrous Structures. Adv Eng Mater. 2009;11(11):B182–B188. [Google Scholar]
- 28.Martínez E, Engel E, López-Iglesias C, Mills CA, Planell JA, Samitier J. Focused ion beam/scanning electron microscopy characterization of cell behavior on polymer micro-/nanopatterned substrates: a study of cell-substrate interactions. Micron. 2008;39(2):111–116. doi: 10.1016/j.micron.2006.12.003. [DOI] [PubMed] [Google Scholar]
- 29.Engqvist H, Svahn F, Jarmar T, Detsch R, Mayr H, Thomsen P, et al. A novel method for producing electron transparent films of interfaces between cells and biomaterials. J Mater Sci Mater Med. 2008;19(1):467–470. doi: 10.1007/s10856-006-0042-9. [DOI] [PubMed] [Google Scholar]
- 30.Friedmann A, Cismak A, Tautorat C, Koester PJ, Baumann W, Held J, et al. FIB preparation and SEM investigations for three-dimensional analysis of cell cultures on microneedle arrays. Scanning. 2012;34(4):221–229. doi: 10.1002/sca.20297. [DOI] [PubMed] [Google Scholar]
- 31.Friedmann A, Hoess A, Cismak A, Heilmann A. Investigation of cell-substrate interactions by focused ion beam preparation and scanning electron microscopy. Acta Biomater. 2011;7(6):2499–2507. doi: 10.1016/j.actbio.2011.02.024. [DOI] [PubMed] [Google Scholar]
- 32.Rupp F, Scheideler L, Olshanska N, De Wild M, Wieland M, Geis-Gerstorfer J. Enhancing surface free energy and hydrophilicity through chemical modification of microstructured titanium implant surfaces. J Biomed Mater Res A. 2006;76A(2):323–334. doi: 10.1002/jbm.a.30518. [DOI] [PubMed] [Google Scholar]
- 33.Olivares-Navarrete R, Hyzy SL, Park JH, Dunn GR, Haithcock DA, Wasilewski CE, et al. Mediation of osteogenic differentiation of human mesenchymal stem cells on titanium surfaces by a Wnt-integrin feedback loop. Biomaterials. 2011;32(27):6399–6411. doi: 10.1016/j.biomaterials.2011.05.036. [DOI] [PMC free article] [PubMed] [Google Scholar]
- 34.Gittens RA, McLachlan T, Olivares-Navarrete R, Cai Y, Berner S, Tannenbaum R, et al. The effects of combined micron-/submicron-scale surface roughness and nanoscale features on cell proliferation and differentiation. Biomaterials. 2011;32(13):3395–3403. doi: 10.1016/j.biomaterials.2011.01.029. [DOI] [PMC free article] [PubMed] [Google Scholar]
- 35.Martin JY, Schwartz Z, Hummert TW, Schraub DM, Simpson J, Lankford J, Jr, et al. Effect of titanium surface roughness on proliferation, differentiation, and protein synthesis of human osteoblast-like cells (MG63). J Biomed Mater Res. 1995;29(3):389–401. doi: 10.1002/jbm.820290314. [DOI] [PubMed] [Google Scholar]
- 36.Kieswetter K, Schwartz Z, Hummert TW, Cochran DL, Simpson J, Dean DD, et al. Surface roughness modulates the local production of growth factors and cytokines by osteoblast-like MG-63 cells. J Biomed Mater Res. 1996;32(1):55–63. doi: 10.1002/(SICI)1097-4636(199609)32:1<55::AID-JBM7>3.0.CO;2-O. [DOI] [PubMed] [Google Scholar]
- 37.Raz P, Lohmann CH, Turner J, Wang L, Poythress N, Blanchard C, et al. 1alpha 25 (OH)2D3 regulation of integrin expression is substrate dependent. J Biomed Mater Res A. 2004;71A(2):217–225. doi: 10.1002/jbm.a.30134. [DOI] [PubMed] [Google Scholar]
- 38.Wieland M, Chehroudi B, Textor M, Brunette DM. Use of Ti-coated replicas to investigate the effects on fibroblast shape of surfaces with varying roughness and constant chemical composition. J Biomed Mater Res. 2002;60(3):434–444. doi: 10.1002/jbm.10059. [DOI] [PubMed] [Google Scholar]
- 39.Zhao G, Raines A L, Wieland M, Schwartz Z, Boyan BD. Requirement for both micron-and submicron scale structure for synergistic responses of osteoblasts to substrate surface energy and topography. Biomaterials. 2007;28(18):2821–2829. doi: 10.1016/j.biomaterials.2007.02.024. [DOI] [PMC free article] [PubMed] [Google Scholar]
- 40.Athanasiou KA, Thoma BS, Lanctot DR, Shin D, Agrawal CM, LeBaron RG. Development of the cytodetachment technique to quantify mechanical adhesiveness of the single cell. Biomaterials. 1999;20(23-24):2405–2415. doi: 10.1016/s0142-9612(99)00168-4. [DOI] [PubMed] [Google Scholar]
- 41.Boyan BD, Sylvia VL, Liu YH, Sagun R, Cochran DL, Lohmann CH, et al. Surface roughness mediates its effects on osteoblasts via protein kinase A and phospholipase A2. Biomaterials. 1999;20(23-24):2305–2310. doi: 10.1016/s0142-9612(99)00159-3. [DOI] [PubMed] [Google Scholar]
- 42.Chen CS, Mrksich M, Huang S, Whitesides GM, Ingber DE. Micropatterned surfaces for control of cell shape, position, and function. Biotechnol Prog. 1998;14(3):356–363. doi: 10.1021/bp980031m. [DOI] [PubMed] [Google Scholar]
- 43.McBeath R, Pirone DM, Nelson CM, Bhadriraju K, Chen CS. Cell shape, cytoskeletal tension, and RhoA regulate stem cell lineage commitment. Dev Cell. 2004;6(4):483–495. doi: 10.1016/s1534-5807(04)00075-9. [DOI] [PubMed] [Google Scholar]
- 44.Peng R, Yao X, Ding JD. Effect of cell anisotropy on differentiation of stem cells on micropatterned surfaces through the controlled single cell adhesion. Biomaterials. 2011;32(32):8048–8057. doi: 10.1016/j.biomaterials.2011.07.035. [DOI] [PubMed] [Google Scholar]
- 45.Hersel U, Dahmen C, Kessler H. RGD modified polymers: biomaterials for stimulated cell adhesion and beyond. Biomaterials. 2003;24(24):4385–4415. doi: 10.1016/s0142-9612(03)00343-0. [DOI] [PubMed] [Google Scholar]
- 46.Rape AD, Guo WH, Wang YL. The regulation of traction force in relation to cell shape and focal adhesions. Biomaterials. 2011;32(8):2043–2051. doi: 10.1016/j.biomaterials.2010.11.044. [DOI] [PMC free article] [PubMed] [Google Scholar]
- 47.Kumar G, Waters MS, Farooque TM, Young MF, Simon CG., Jr Freeform fabricated scaffolds with roughened struts that enhance both stem cell proliferation and differentiation by controlling cell shape. Biomaterials. 2012;33(16):4022–4030. doi: 10.1016/j.biomaterials.2012.02.048. [DOI] [PMC free article] [PubMed] [Google Scholar]
- 48.Keselowsky BG, Wang L, Schwartz Z, Garcia AJ, Boyan BD. Integrin alpha(5) controls osteoblastic proliferation and differentiation responses to titanium substrates presenting different roughness characteristics in a roughness independent manner. J Biomed Mater Res A. 2007;80A(3):700–710. doi: 10.1002/jbm.a.30898. [DOI] [PubMed] [Google Scholar]
- 49.Enomoto-Iwamoto M, Iwamoto M, Nakashima K, Mukudai Y, Boettiger D, Pacifici M, et al. Involvement of alpha5beta1 integrin in matrix interactions and proliferation of chondrocytes. J Bone Miner Res. 1997;12(7):1124–1132. doi: 10.1359/jbmr.1997.12.7.1124. [DOI] [PubMed] [Google Scholar]
- 50.Kuwada SK, Li XF. Integrin alpha5/beta1 mediates fibronectin-dependent epithelial cell proliferation through epidermal growth factor receptor activation. Mol Biol Cell. 2000;11(7):2485–2496. doi: 10.1091/mbc.11.7.2485. [DOI] [PMC free article] [PubMed] [Google Scholar]
- 51.Emsley J, Knight CG, Farndale RW, Barnes MJ, Liddington RC. Structural basis of collagen recognition by integrin alpha2beta1. Cell. 2000;101(1):47–56. doi: 10.1016/S0092-8674(00)80622-4. [DOI] [PubMed] [Google Scholar]
Associated Data
This section collects any data citations, data availability statements, or supplementary materials included in this article.
Supplementary Materials
Supplemental Figure 1. Cytomorphometric analysis of wild type MG63 cells grown on PT and SLA; cell length distribution (A), cell width distribution (B), cell area distribution (C), aspect ratio distribution (D)(n=3).


