Abstract
Retinal degeneration describes a group of disorders which lead to progressive photoreceptor cell death, resulting in blindness. As this occurs, retinal ganglion cells (RGCs) begin to develop oscillatory physiological activity. Here, we studied the morphological and physiological properties of RGCs in rd1 mice, aged 30–60 days, to determine how this aberrant activity correlates with morphology. Patch-clamp recordings of excitatory and inhibitory currents were performed, then dendritic structures were visualized by infusion of fluorescent dye. Only RGCs with oscillatory activity were selected for further analysis. Oscillatory frequency and power were calculated using power spectral density analysis of recorded currents. Dendritic arbor stratification, total length, and area were measured from confocal microscope image stacks. These measurements were used to sort RGCs by cluster analysis using Ward’s method. This resulted in a total of 10 clusters, with monostratified and bistratified cells having 5 clusters each. Both populations exhibited correlations between arbor stratification and aberrant inhibitory input, while excitatory input did not vary with arbor distribution. These findings illustrate the relationship between aberrant activity and RGC morphology at early stages of retinal degeneration.
Keywords: retinal degeneration, ganglion cell, cluster analysis
Introduction
Retinal degeneration (RD) encompasses a family of diseases in which photoreceptors progressively die. The loss of photoreceptors precipitates an array of anatomical and physiological alterations to the downstream retinal network (Jones et al., 2012; Marc et al., 2003). Modifications to dendritic structure and receptor expression and function, secondary to photoreceptor degeneration, occur in the surviving retina (Chua et al., 2009; Puthussery et al., 2009; Strettoi and Pignatelli, 2000). This is accompanied by changes to the resting activity of inner retinal neurons. Bipolar and amacrine cells develop spontaneous membrane oscillations (Borowska et al., 2011; Margolis et al., 2014; Menzler and Zeck, 2011; Trenholm et al., 2012). This aberrant physiological activity is conveyed to postsynaptic retinal ganglion cells (RGCs), resulting in rhythmic spiking that correlates to oscillatory excitatory and inhibitory synaptic input, which is not present in wildtype RGCs (Margolis et al., 2008; Menzler and Zeck, 2011; Stasheff, 2008). Variations in physiological properties have been observed in different morphological classes of RGCs (Margolis et al., 2014; Yee et al., 2012). RGCs survive and remain functional through late stages of RD, although undersized dendritic arbors and sprouting have been observed in the rd1 mouse model of early-onset RD (Damiani et al., 2012; O’Brien et al., 2014).
Although these changes in the rd1 mouse may be due to the incomplete development of RGCs, and may thus not exclusively reflect the remodeling that occurs in RD retina (Marc et al., 2003), it has previously been shown that RGCs in this mouse model largely retain the physiological properties of those in wildtype retina (Margolis et al., 2008), making this a viable model for determining potential sources of aberrant activity in RD. Here, we study the morphology and physiology of oscillatory RGCs in the retina of the rd1 mouse. Spontaneous excitatory and inhibitory postsynaptic currents (sEPSCs and sIPSCs) were recorded from RGCs in a whole mount retinal preparation, and the recorded cells were visualized for the measurement of anatomical structures. Statistical analyses were performed to determine whether aberrant activity varies with RGC morphology, including a cluster analysis, which utilized measurements of both physiological and morphological properties as parameters.
Materials and methods
Animals
In all experimental procedures, animals were treated according to regulations in the ARVO Statement for the Use of Animals in Ophthalmic and Vision Research, in accordance with protocols approved by the Institutional Animal Care and Use Committee of Weill Cornell Medical College, and the NIH Guide for the Care and Use of Laboratory Animals. rd1 mice of either sex were obtained from the Jackson Laboratory (RRID:Jax 000659, Bar Harbor, ME).
Retinal whole mount preparation
Experimental procedures were similar to those reported in earlier work (Sagdullaev et al., 2011). All mice (P30–60) were euthanized in the morning on the day of the experiment. The eyes were enucleated and placed in oxygenated standard HEPES-buffered extracellular solution. The cornea, iris and lens were removed with small scissors. The retina was dissected into four equal quadrants, which were attached photoreceptor surface down to a modified translucent Millicell filter ring (Millipore, Bedford, MA, USA). Individual rings were transferred to a recording chamber on the stage of an upright Nikon FN1 microscope. To reduce discrepancy between preparations and reduce contribution of photoreceptors to maintained activity, both wt and rd1 retinas were maintained in light-adapted conditions. The recording chamber was constantly superfused (1 mL/min) with bicarbonate-buffered Ringer’s extracellular solution, bubbled with 95% O2 and 5% CO2.
Electrophysiology
Whole-cell recordings were made using patch pipettes filled with intracellular solution containing (in mM) 120 Cs-gluconate, 10 tetraethylammonium chloride (TEA-Cl), 1.0 CaCl2, 1.0 MgCl2, 11 ethylene glycol-bis-(beta-aminoethyl ether)-N,N,N′,N′-tetraacetic acid (EGTA), and 10 sodium N-2-hydroxyethylpiperazine-N′-2-ethanesulfonic acid (Na-HEPES), adjusted to pH 7.2 with CsOH. The calculated ECl for this solution was −58 mV. The intracellular solution was supplemented with 0.05% sulforhodamine B. Electrodes were pulled from borosilicate glass (1B150F-4; WPI, Sarasota, FL, USA) with a P-97 Flaming/Brown puller (Sutter Instruments, Novato, CA, USA) and had a measured resistance of ~4–7 ML. Cell-attached and voltage-clamp recordings were made with MultiClamp 700B patch-clamp amplifiers (Molecular Devices, Sunnyvale, CA, USA). All recording routines were controlled by Signal software (CED, UK). Data were filtered at 5 kHz with a four-pole Bessel filter and were sampled at 15 kHz. Resting excitatory and inhibitory postsynaptic currents, EPSCs (Vh = −60 mV) and IPSCs (Vh = 0 mV), respectively, were recorded for all cells. The temperature of the solution and recording chamber was maintained at 32–35°C.
Morphological characterization
Each GC was filled with sulforhodamine B (Sigma, St. Louis, MO), included in the patch pipette solution. At the end of each recording session, the preparation was immediately placed in a glass bottom culture dish (MatTek, Ashland, MA) and transferred to a stage of a Nikon C1 confocal microscope. A z-stack of 160 images was acquired at 0.5 μm steps at a resolution of 1024 × 1024 pixels. A nuclear stain stock solution, 2 μL of an equal mixture of 12 mM ethidium bromide and 100 μM To-Pro-3 (Invitrogen, Carlsbad, CA) was added for determining the borders of the inner plexiform layer (IPL, Fig. 1). GCs were distinguished from displaced ACs by the presence of an axon. As previously described (Yee et al., 2012), for dendritic field (DF) size, a polygon was drawn by linking the tips of dendrites, and the area calculated. The area was converted back to diameter by assuming a circular DF. Cell body size was measured similarly. The level at which the GC dendritic arbor stratified in the IPL was measured as its distance from the proximal (0%) to distal margin (100%) of the IPL. In general, ON GCs were defined as those with dendrites that stratified <60% of the IPL depth, and OFF GCs stratified >60% of the IPL depth. Measurement of cell properties was performed with ImageJ (RRID: nif-0000-30467) and Nikon EZ-C1 software.
Figure 1.
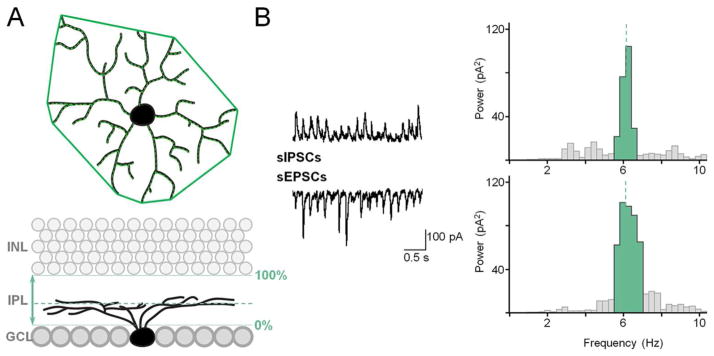
Morphometric and physiological parameters measured in rd1 RGCs. A: Dendritic arbor area, total length, and stratification depth. B: Oscillation frequency and power determined from power spectral histogram.
Statistical analysis
All statistics were performed using SPSS (RRID: 000042, SPSS Inc., Chicago, IL, USA). Cluster analysis utilized three morphological parameters (Kong et al., 2005): dendritic arbor stratification, area, and total length. Total length was used instead of density, as area is used to calculate density (d = l/a) and was already a separate parameter. Excitatory and inhibitory oscillatory power, determined by power spectral density analysis, were used as physiological parameters (Fig. 1B). Cells with a peak greater than 2 standard deviations above the mean within the range of 0.1 and 30 Hz were considered to be oscillatory. Only oscillatory cells were included in subsequent cluster analyses. Cluster membership was determined as previously described (Badea and Nathans, 2004; Yee et al., 2012). Briefly, a hierarchical cluster analysis using Ward’s Method was performed using the described parameters, which were standardized and separated by squared Euclidean distance. The number of clusters was based on minimum linkage distance in the generated dendrogram. This was accompanied by a k-means analysis to verify cluster separation. Monostratified and bistratified cells were analyzed separately. For bistratified cells, each morphological parameter was measured for both dendritic arbors.
Results
RGCs were clustered according to anatomical and physiological measurements. Dendritic arbor area, stratification, and total length were used as anatomical parameters (Fig. 1A), similar to a previous cluster analysis of wildtype RGCs (Kong et al., 2005). Arbor density was calculated based on length and area (d = l/a). For bistratified cells, parameters were measured for both inner and outer dendritic arbors. Morphometric classifications of wildtype mouse RGCs have identified 11–22 groups (Badea and Nathans, 2004; Coombs et al., 2006; Kong et al., 2005; Sun et al., 2002; Volgyi et al., 2009), and these same cell types have been identified in RD mouse retina (Damiani et al., 2012; Mazzoni et al., 2008; O’Brien et al., 2014; Yee et al., 2012). Here, the addition of physiological parameters may result in clusters which do not fully reflect previous classifications, though it should be noted that the aim is not to create a new RGC classification scheme, but rather, to use cluster analysis as a tool to determine how morphological and physiological properties intersect in RD.
The aberrant activity of RGCs has been attributed to the aberrant activity of bipolar and amacrine cells, corresponding to oscillations in sEPSCs and sIPSCs, respectively (Borowska et al., 2011). The oscillatory power of sEPSCs and sIPSCs was measured using power spectral density analysis (Fig. 1B). No direct comparison was made to wildtype RGCs, which do not exhibit this type of spontaneous oscillatory activity (Margolis et al., 2008). The dominant frequency was determined to be at the point of maximal power, and oscillatory power was measured as the sum of the bins of the peak at the dominant frequency. Our previous cluster analysis only included anatomical parameters, and included cells that did not have oscillations, which comprised approximately 30 percent of recorded cells (Yee et al., 2012). In this study, only cells with oscillations were included in the cluster analysis (n = 45 monostratified, n = 31 bistratified). The oscillatory frequency of either sESPCs or sIPSCs did not correlate with any other parameter as a population, and when included in the cluster analysis, clusters did not significantly differ in frequency. Therefore, frequency was not used as a parameter in the final analysis.
Monostratified clusters
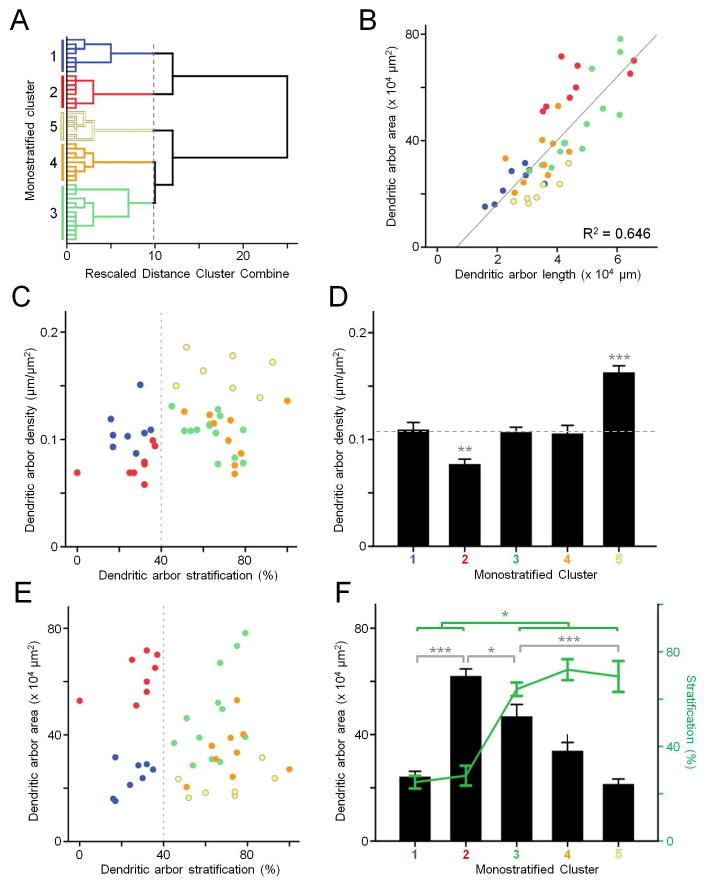
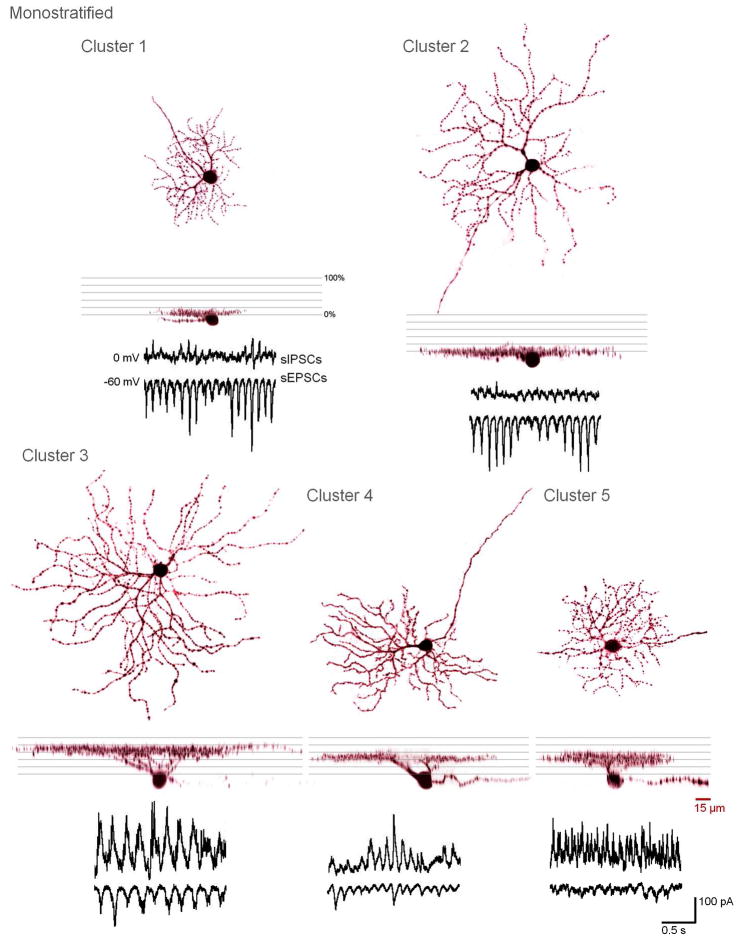
Monostratified cells were analyzed based on 5 parameters: dendritic arbor area, total length, stratification, sEPSC oscillatory power, and sIPSC oscillatory power. Hierarchical analysis revealed 5 clusters (Fig. 2A). Dendritic arbor length strongly correlates to arbor area (R2 = 0.65, Fig. 2B), though there are variations between clusters. Combining these parameters into density (μm length per μm2 area) and plotting this against arbor stratification shows cluster separation more clearly. (Fig. 2C). Clusters 1, 3, and 4 do not differ in density (p > 0.99), while cluster 2 is less dense, and cluster 5 is more dense (cluster 2, p = 0.0002; cluster 5, p < 0.0001; Fig. 2D). Additionally, clusters 1 and 2 separate from clusters 3, 4, and 5 at the border of the S3 and S4 zones (Ghosh et al., 2004) of inner plexiform layer (IPL), at 40% of the distance between the ganglion cell layer and the inner nuclear layer (dotted line, Fig. 2C). Clusters 1 and 2 stratify below 40%, proximal to the ganglion cell layer (25 ± 3 and 18 ± 4%, Fig. 3). Clusters 3, 4, and 5 stratify above 40%, distal to the GCL (64 ± 3, 72 ± 4, and 70 ± 7%, Fig. 3, see also Table 1). Note that these two groups of clusters are separated by the first bifurcation of the dendrogram (Fig. 2A). Additionally, clusters separate by dendritic arbor area, within sublaminae (Fig. 2E). The proximal clusters (1 and 2) are different in size (p < 0.0001), as are the distal clusters (3, 4, and 5; p = 0.001) (Fig. 2F).
Figure 2.
Monostratified retinal ganglion cells. A: Dendrogram of clustering based on morphometric and physiological parameters using Ward’s joining method, color coded for individual clusters. B: Scatterplot of dendritic arbor length vs. area. C: Scatterplot of dendritic arbor stratification vs. density. Dotted line illustrates the division between clusters. D: Mean dendritic arbor density of each cluster. Dotted line indicates that clusters 1, 3, and 4 do not significantly differ. E: Scatterplot of dendritic arbor stratification vs. area. Dotted line illustrates the division between clusters. F: Mean dendritic arbor area and stratification of each cluster. * p > 0.05, ** p > 0.01, *** p > 0.001.
Figure 3.
3D-projections and spontaneous activity of representative cells from monostratified clusters 1–5.
Table 1.
Monostratified Clusters
| N | Dendrites | Oscillation Frequency (Hz) | Oscillation Power (pA2) | |||||
|---|---|---|---|---|---|---|---|---|
|
| ||||||||
| Stratification (%) | Area (x 103 μm) | Length (μm) | Excitatory | Inhibitory | Excitatory | Inhibitory | ||
|
| ||||||||
| 1 | 8 | 25 ± 3 | 24.1 ± 2.2 | 2588 ± 235 | 6.7 ± 0.6 | 6.8 ± 0.5 | 41.5 ± 15.0 | 10.0 ± 6.3 |
| 2 | 8 | 18 ± 4 | 61.9 ± 2.8 | 4755 ± 409 | 8.0 ± 0.5 | 7.5 ± 1.0 | 22.9 ± 5.1 | 11.1 ± 5.6 |
| 3 | 13 | 64 ± 3 | 46.7 ± 4.6 | 4754 ± 283 | 6.4 ± 0.4 | 6.3 ± 0.4 | 38.3 ± 17.6 | 119.7 ± 31.2 |
| 4 | 9 | 72 ± 4 | 33.8 ± 3.3 | 3422 ± 234 | 6.7 ± 0.3 | 6.8 ± 0.4 | 4.4 ± 1.0 | 24.0 ± 10.5 |
| 5 | 7 | 70 ± 7 | 21.3 ± 2.0 | 3415 ± 242 | 7.1 ± 0.4 | 6.1 ± 0.8 | 20.3 ± 6.2 | 193.1 ± 84.2 |
|
|
||||||||
| Total: | 45 | |||||||
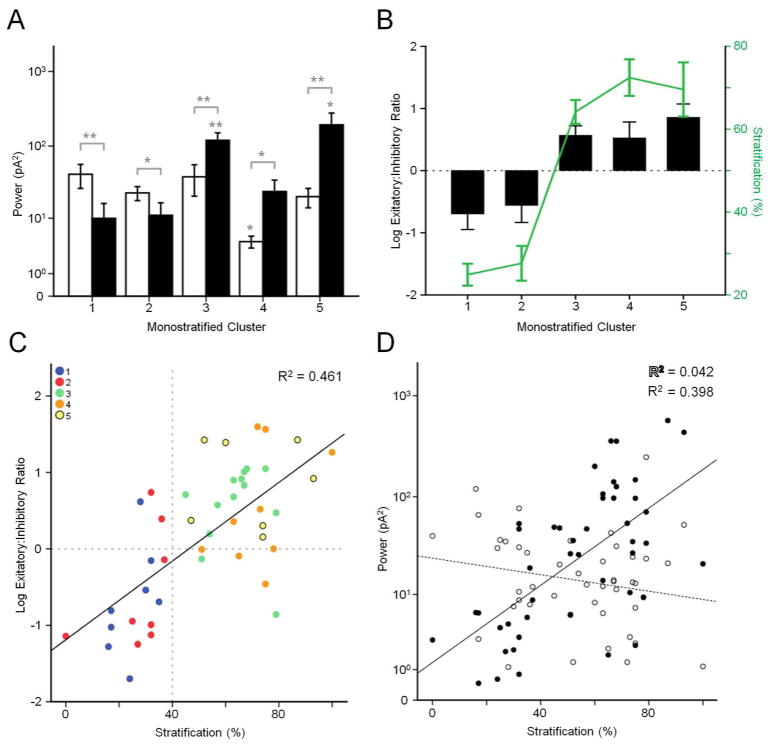
When comparing physiological cluster features, proximal and distal clusters again differed. In proximal clusters, sEPSC power is greater than sIPSC power (cluster 1, p = 0.014; cluster 2, p = 0.021), while in distal clusters, sIPSC power is greater than sEPSC power (cluster 3, p = 0.002, cluster 4, p = 0.037, cluster 5, p = 0.004, respectively, Fig. 4A). This difference is illustrated by calculating the ratio of sEPSC to sIPSC power (E:I ratio). The E:I ratio of the proximal clusters is significantly different from distal clusters (p < 0.0001), but within the clusters, they are not different (proximal, p = 0.714; distal, p = 0.541) (Fig. 4B). As a population, there is a strong correlation between stratification and E:I ratio (R2 = 0.46) (Fig. 4C), similar to previous observations (Margolis et al., 2008; Yee et al., 2012). The respective contributions of excitatory and inhibitory currents differ, however. There is a strong correlation between stratification and sIPSC power (R2 = 0.398), while there is little to no correlation between stratification and sEPSC power (R2 = 0.042) (Fig. 4D).
Figure 4.
Trends of monostratified clusters. A: Mean excitatory (white) and inhibitory (black) oscillatory power of each cluster. * p > 0.05, ** p > 0.01. B: Ratio of excitatory:inhibitory power plotted with arbor stratification for each cluster. C: Scatterplot of arbor stratification vs. excitatory:inhibitory ratio. D: Scatterplot of arbor stratification vs. excitatory and inhibitory power.
Bistratified clusters
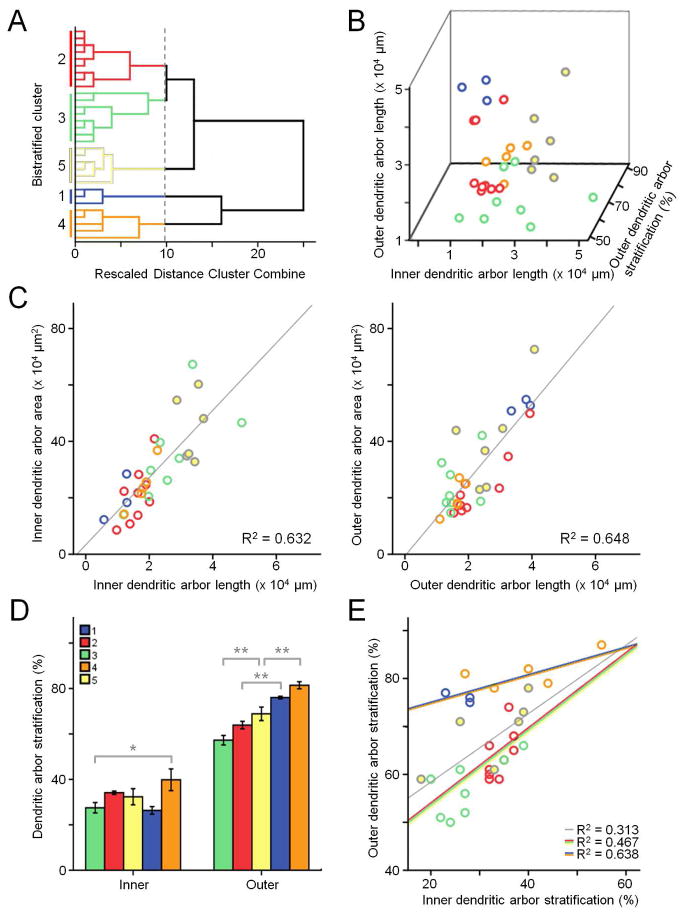
Bistratified cells were analyzed based on 8 parameters: dendritic area, total length, and stratification of both inner and outer dendritic arbors, as well as sEPSC and sIPSC oscillatory power. Hierarchical analysis again revealed 5 clusters (Fig. 5A). Clusters separate according to inner and outer arbor length, and outer arbor stratification (Fig. 5B). There is little to no correlation between the length of inner and outer arbors (R2 = 0.028). As in the sample population of monostratified RGCs, dendritic arbor length strongly correlates with area, for both inner (R2 = 0.632) and outer (R2 = 0.648) arbors (Fig. 5C). Clusters do not differ in density of either arbor (ANOVA, inner, p = 0.292; outer, p = 0.101). Overall, clusters differ in both outer arbor stratification (ANOVA, p < 0.0001) and inner arbor stratification (ANOVA, p = 0.026); however, only one pair of clusters differ in inner stratification (3 vs. 4, Tukey’s HSD, p = 0.027), while several differ in outer stratification (Fig. 5D).
Figure 5.
Bistratified retinal ganglion cells. A: Dendrogram of clustering based on morphometric and physiological parameters using Ward’s joining method, color coded for individual clusters. B: 3-dimensional scatterplot of inner vs. outer dendritic arbor length vs. outer dendritic arbor stratification. C: Scatterplots of inner and outer dendritic arbor length vs. area. D: Mean inner and outer stratification for each cluster. E: Scatterplot of inner vs. outer dendritic arbor stratification. Gray trendline is for all data points. Red/green/yellow trendline is for clusters 2,3, and 5. Blue/orange trendline is for clusters 1 and 4.
Plotting inner stratification against outer stratification reveals that clusters 1 and 4 do not overlap with clusters 2, 3, and 5 (Fig. 5E). These two groups of clusters are separated by the first bifurcation of the dendrogram (Fig. 5A). The average outer stratification of the cells in clusters 1 and 4 is greater than that of the remaining population (p < 0.0001) but the average inner stratification is no different (p = 0.291). Additionally, the regression lines for these two groups are significantly different from one another (Analysis of Covariance [ANCOVA], p < 0.0001; blue-orange vs. red-green-yellow lines, Fig. 5E). The regression line for clusters 1 and 4 also differs from the regression line for all clusters (ANCOVA, p = 0.001; blue-orange vs. grey lines, Fig. 5E), while the regression line for clusters 2, 3, and 5 does not (ANCOVA, p = 0.120; red-green-yellow vs. grey lines, Fig. 5E).
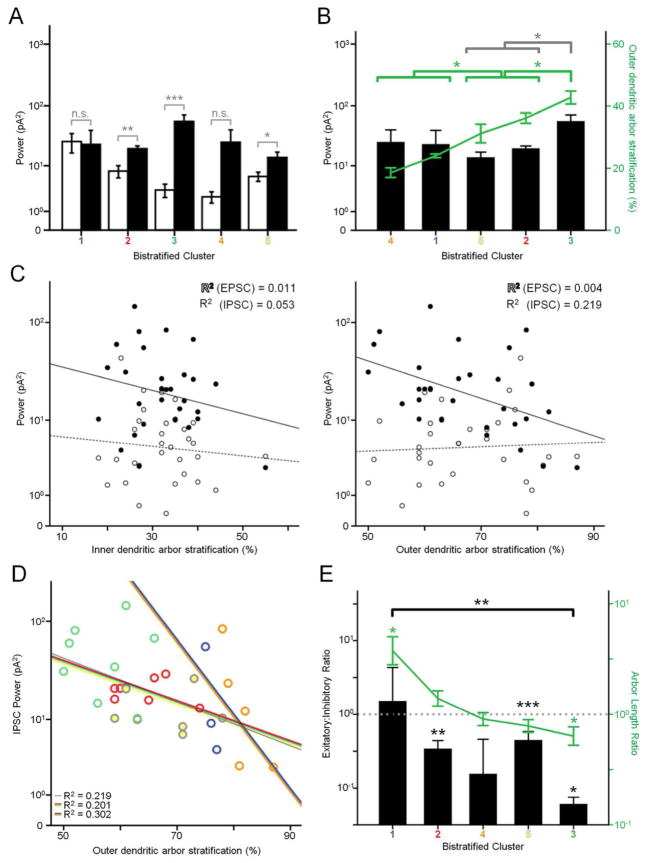
The physiological properties of bistratified clusters differ from monostratified clusters. Unlike monostratified clusters, sEPSC power does not exceed sIPSC power in any bistratified cluster, and in most cases, sIPSC power is greater (cluster 1, p = 0.276; cluster 2, p = 0.0004; cluster 3, p < 0.0001; cluster 4, p = 0.024; cluster 5, p = 0.022, Table 2). However, when using a paired samples test to compare excitatory and inhibitory power within each cluster, there was no significant different in clusters 1 and 4 (Fig. 8A). The relationship between stratification and oscillatory power was examined for both inner and outer dendritic arbors (Fig. 8C). Inner stratification has little to no correlation to either sEPSC (R2 = 0.011) or sIPSC power (R2 = 0.053). Outer stratification has a moderate correlation to sIPSC power (R2 = 0.219), but little to no correlation to sEPSC power (R2 = 0.004). This trend is only partly reflected when comparing by clusters (Fig. 8B); clusters 2 and 5 are less than cluster 3 in both stratification (ANOVA, p = 0.018, 0.001) and inhibitory power (p = 0.013, 0.010), while clusters 1 and 4 are less in stratification (p < 0.0001 for both) but not power (p = 0.097, 0.066). When plotting sIPSC power against outer stratification, two clusters – cluster 1 and 4 – again show a separate trend from the others, in that the regression line is significantly different from that of the remaining groups (ANCOVA, clusters 1 and 4 vs others p < 0.0001) and from the group as a whole (ANCOVA, clusters 1 and 4 vs all clusters, p = 0.003) while the regression line for clusters 2, 3, and 5 is no different from that of the group (ANCOVA, p = 0.113) (Fig. 8D).
Table 2.
Bistratified Clusters
| N | Dendrites | Oscillation Frequency (Hz) | Oscillation Power (pA2) | |||||
|---|---|---|---|---|---|---|---|---|
|
| ||||||||
| Stratification (%) | Area (x 103 μm) | Length (μm) | Excitatory | Inhibitory | Excitatory | Inhibitory | ||
|
| ||||||||
| 1 | 3 | 26 ± 2 76 ± 1 |
19.7 ± 4.7 52.8 ± 1.2 |
1053 ± 240 3704 ± 181 |
6.0 ± 0.2 | 6.1 ± 0.1 | 25.9 ± 9.3 | 23.2 ± 16.5 |
| 2 | 9 | 34 ± 1 64 ± 2 |
21.1 ± 3.3 24.2 ± 3.8 |
1622 ± 127 2314 ± 283 |
5.3 ± 1.0 | 5.4 ± 1.0 | 8.0 ± 2.0 | 19.6 ± 2.1 |
| 3 | 8 | 28 ± 2 57 ± 2 |
34.7 ± 5.9 24.2 ± 3.3 |
2669 ± 396 1627 ± 174 |
8.5 ± 1.7 | 5.4 ± 0.6 | 3.4 ± 1.1 | 55.7 ± 15.4 |
| 4 | 5 | 40 ± 5 81 ± 2 |
24.3 ± 3.7 20.1 ± 2.7 |
1786 ± 169 1608 ± 137 |
7.8 ± 2.5 | 6.5 ± 2.9 | 2.4 ± 0.7 | 25.2 ± 15.2 |
| 5 | 6 | 32 ± 4 69 ± 3 |
44.4 ± 4.7 40.7 ± 7.4 |
3331 ± 121 2702 ± 337 |
6.1 ± 0.6 | 6.2 ± 0.6 | 6.3 ± 1.3 | 13.9 ± 3.3 |
|
|
||||||||
| Total: | 31 | |||||||
Figure 8.
Trends of bistratified clusters. A: Mean EPSC (white) and IPSC (black) oscillatory power of each cluster. Results of paired comparisons are shown, and differ from unpaired comparisons, described in the text. n.s. not significant, * p > 0.05, ** p > 0.01. B: Mean ISPC power plotted with outer dendritic arbor stratification of each cluster. C: Scatterplots of inner and outer dendritic arbor stratification vs. EPSC and IPSC power. D: Scatterplot of inner vs. outer dendritic arbor stratification. Gray trendline is for all data points. Red/green/yellow trendline is for clusters 2,3, and 5. Blue/orange trendline is for clusters 1 and 4. E: Mean excitatory:inhibitory ratio plotted with outer:inner dendritic length ratio of each cluster. Values are on a logarithmic scale. Dotted line marks where ratios are equal to 1 (10^0). Clusters 1 and 3 length ratios are different from the 0 line. Clusters 1 and 3 are different in E:I ratio.
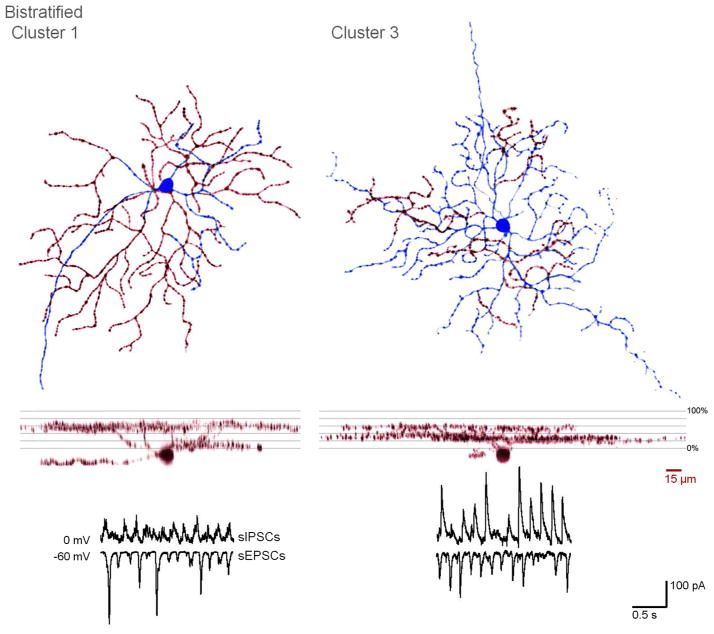
Last, we examined the relationship between arbor length ratio (outer:inner dendritic arbor length) and E:I ratio (Fig. 8E). The E:I ratio of clusters 1 and 4 did not significantly differ from 1 (p = 0.731, 0.161), while clusters 2, 3, and 5 are all weighted towards inhibition, and are significantly less than 1 (p = 0.002, p < 0.0001, p = 0.0156). Only clusters 1 and 3 significantly differ in E:I ratio (p = 0.006), and these are also the only two clusters with an arbor length ratio that is significantly different from 1 (p <0.0001, see also Fig. 6).
Figure 6.
3D-projections and spontaneous activity of representative cells from bistratified clusters 1 and 3. In flat views, the soma and inner dendritic arbors are in blue, while the outer arbors are in red.
Discussion
Monostratified and bistratified RGCs in wholemount rd1 mouse retina were sorted in a cluster analysis that included both anatomical and physiological parameters. 5 clusters were found for each population. The oscillatory power of inhibitory currents varies with stratification in both monostratified and bistratified sample populations, though with opposite trends. The two clusters of bistratified cells with distal dendrites that stratified at the outermost area of the IPL were separate from the remaining clusters along several comparisons. It should be noted that this analysis does not aim to create a new classification scheme for RGCs, as numerous studies have addressed this from both an anatomical (Badea and Nathans, 2004; Coombs et al., 2006; Kong et al., 2005; Sun et al., 2002; Volgyi et al., 2009) and physiological (Farrow and Masland, 2011; Zeck and Masland, 2007) perspective. The purpose was, rather, to determine where physiological and anatomical properties intersect in RD.
Diversity of aberrant inputs to RGCs
The oscillatory activity exhibited by RD RGCs is a result of synaptic input, not intrinsic activity (Margolis et al., 2008). The source of this activity remains unclear. It is thought to originate from oscillatory input from intrinsically oscillating AII amacrine and cone bipolar cells (Borowska et al., 2011; Choi et al., 2014; Menzler and Zeck, 2011; Yee et al., 2012). This activity is present in wildtype retina when photoreceptor input is pharmacologically blocked, suggesting that photoreceptor degeneration unmasks the same intrinsic activity (Trenholm et al., 2012). The mechanism of this activity is not fully understood; gap junctions have been shown to be necessary for its generation, but it is unclear whether this is primarily due to network interactions centered around AII cells (Margolis et al., 2014; Toychiev et al., 2013a), or due to direct gap junction mediation of AII cell hyperpolarization (Choi et al., 2014).
In a previous morphological survey of RGCs, we found that cells that stratified closer to the inner nuclear layer were more likely to burst (Yee et al., 2012). This may be related to the trends in oscillatory activity observed here. Oscillatory input to RGCs can be driven independently by either excitatory or inhibitory synaptic input (Yee et al., 2012). In monostratified cells, inhibitory oscillatory power is strongest at the distal area of the IPL, and dissipates with proximity to the GCL. In contrast, excitatory power is more evenly distributed throughout the IPL. This suggests that cells that stratify closer to the INL have an increased likelihood of having multiple sources of aberrant activity, and are thus more likely to burst. This also suggests that bipolar cells that stratify throughout the IPL contribute to oscillatory activity, while oscillatory amacrine cells stratify primarily in the distal IPL. This is further evidence that the AII amacrine cell, the predominant source of inhibitory input to OFF alpha and delta RGCs in WT retina (Ke et al., 2014), plays a central role in the generation and propagation of oscillatory activity in RD retina (Borowska et al., 2011; Margolis et al., 2014; Trenholm et al., 2012).
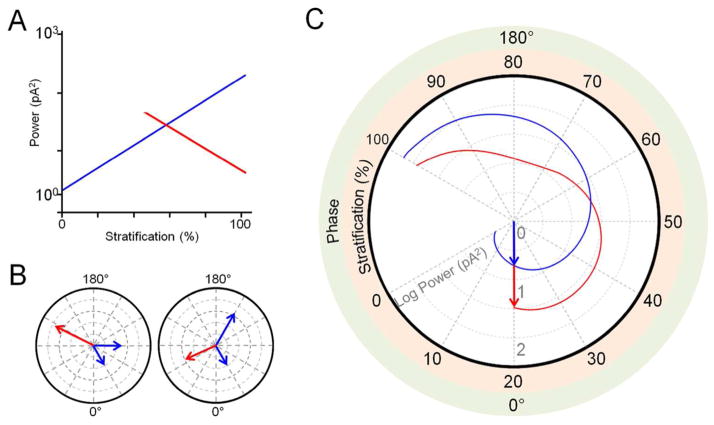
While inhibitory aberrant activity increased with proximity to the INL, the opposite trend was observed in bistratified RGC oscillations, although only in the outer dendrites (Fig. 8C, 9A). Why does this differ from the trend observed in monostratified cells? Recently, it has been shown that the oscillations of ON and OFF RGCs in RD retina are out of phase (Margolis et al., 2014). Thus, it is possible that inputs to the inner and outer dendrites of bistratified RGCs are similarly out of phase. If, similar to the magnitude of inhibitory input, the phase shift of the oscillations increases with proximity to the INL, out-of-phase signals may be combined in a destructive way due to phase cancellation. In other words, oscillatory input from the ON and OFF sublaminae, respectively, may cancel each other out. This effect would be more likely to occur as the distance of outer dendrites from the inner dendrites increases, and thus oscillatory power would decrease with proximity of the outer dendrites to the INL. The effect of phase cancellation can be illustrated with vector addition (Fig. 9B). In this example, the resultant vector (Fig. 9B, left, red arrow) from the addition of two vectors with 60° of separation (Fig. 9B, left, blue arrows), has a greater magnitude than the resultant vector from the addition a second pair of vectors with 120° of separation (Fig. 9B, right). This is despite the sum of the individual magnitudes of the second pair being greater than that of the first; the difference in phase modifies the additive effect. In this way, combining two inputs which are out of phase can result in a negative trend, as the phase shift increases. This can be illustrated in a polar plot (Fig. 9C); the trend for inhibitory input (Fig. 9C, blue trace) is described by the magnitude r = (θ + 120) * 0.0367 where the angle θ = (stratification−20)/3. A sample trend (Fig. 9C, red trace) shows the magnitude of the resultant vector from adding input at 0 degrees (representing hypothetical inner dendrites at 20% stratification) to inputs ranging from 0 to 240 degrees (representing hypothetical outer dendrites at 20–100% stratification). (It should be noted that outer dendrites are generally not expected to stratify below 50%, and none of the cells in the sample population had outer dendrites which stratified below 50%.) When the second set of dendrites stratifies from 20–50% the resultant input (red) is greater than the monostratified input (blue) at the same level. From 60–100%, the resultant input is less than the monostratified input. This is similar to the linear trends (Fig. 9A), swith the caveat that the bistratified linear trend does not increase between 80–100% (as it is linear). Thus, the opposite trends observed in the inhibitory oscillations of monostratified and bistratified cells may be partly due to phase differences that exist between inputs proximal and distal to the RGC soma.
Figure 9.
Model for differential inhibitory oscillatory input to monostratified and bistratified retinal ganglion cells. A: Trends of inhibitory power derived from sample data of monostratified RGC dendrites (blue) and bistratified RGC outer dendrites (red) as a function of stratification. B: Illustration of phase cancellation. Adding vectors (blue) with 60 degrees of separation (left) results in a vector (red) with a greater magnitude than when adding vectors with 120 degrees of separation (right). C: Polar plot illustrating a model for inhibitory oscillatory input (blue) which varies in both power (concentric dotted circles) and phase as stratification approaches 100%. Vector magnitude increases with angle. The second trend shows the resultant power from the addition of vectors representing dual input to bistratified RGCs from two hypothetical sets of dendrites (red). In this example, the first set of dendrites stratifies at 20%. When the second set of dendrites stratifies from 20–50% (it should be noted that outer dendrites of bistratified RGCs are rarely present within this range), the resultant input (red) is greater than the monostratified input (blue) at the same level. From 60–100%, the resultant input is less than the monostratified input.
Together, this data supports the model proposed by Margolis et al. (2014), in which oscillatory AII amacrine cells modulate ON and OFF cone bipolar cells via gap junctions and glycinergic input, respectively, which in turn provide phase-shifted glutamatergic input to ON and OFF RGCs. Inhibitory oscillatory input to both ON and OFF RGCs is provided by secondary amacrine cells modulated by ON and OFF cone bipolar cells, and OFF RGCs are additionally modulated by direct oscillatory inhibition from AII cells, which, crucially, is phase-shifted relative to OFF bipolar cell-driven amacrine cell input, which putatively generates a stratification-dependent phase cancellation effect as described above. The greater variation observed in bistratified cells may be due to mixed ON and OFF input towards the INL, which may introduce differences between cells which have dendrites which stratify at distinct substrata within this multiplexed region of input (Marc et al., 2013).
Future Directions
The sample population of RGCs analyzed in this study are representative of cells during an early stage of degeneration within an early-onset, fast model of RD (Farber et al., 1994). Remodeling of the IPL continues into much later ages (Jones et al., 2012; Marc et al., 2003), and thus, the relationships between anatomy and physiology observed here may change as RD progresses. Additionally, since the anatomical changes observed in rd1 RGCs are possibly due to the abortive development of RGC dendrites following early photoreceptor degeneration (Damiani et al., 2012), it would be of interest to test whether similar trends between anatomy and physiology are present in a model of RD with an onset that does not overlap with retinal development, such as the rd10 mouse (Chang et al., 2002; Gargini et al., 2007). It has already been shown that RGC morphology is not affected in rd10 retina (Mazzoni et al., 2008), in contrast to rd1, which is affected even in early stages (Damiani et al., 2012; O’Brien et al., 2014). Aberrant physiology also has a different time course of development between rd1 and rd10 (Stasheff et al., 2011). Regardless, it has been shown that synaptic inputs to rd1 RGCs are largely preserved despite the presence of aberrant activity (Margolis et al., 2008).
Anatomical, neurochemical, and physiological remodeling have been particularly well-studied in bipolar cells. At early stages of degeneration, bipolar cell dendrites retract and lose metabotropic glutamate receptor expression (Strettoi and Pignatelli, 2000), and even earlier in the course of the disease, ON cone bipolar cells begin to express aberrant functional ionotropic glutamate receptors (Chua et al., 2009). Remarkably, this leads to a redistribution of bipolar cell types, shifting from ON to OFF types (Jones et al., 2011; Marc et al., 2007). These changes to bipolar cells may in turn affect RGC properties, as the proportion of OFF-center to ON-center RGCs is increased in the RCS rat relative to wildtype (Pu et al., 2006).
Just as the loss of photoreceptor input leads to remodeling in bipolar cells, the aberrant activity of bipolar cells and amacrine cells may lead to remodeling in RGCs. Although it has been shown that the morphological classes and physiology of wildtype RGCs are largely retained in RD (Damiani et al., 2012; Margolis et al., 2008; Mazzoni et al., 2008; O’Brien et al., 2014), whether neurochemical remodeling occurs remains unclear. Aberrant activity in RGCs has been linked to the visual photopsias experienced by patients affected with retinitis pigmentosa (Menzler and Zeck, 2011), generated by bipolar cell output and propagated via gap junctions, comprising an intrinsic mechanism that is present but inactive in wildtype retina, which is activated in RD retina following the perturbation of inhibitory cells (Toychiev et al., 2013b; Yee et al., 2012). The dramatically elevated glutamatergic input to RGCs may lead to chronic spillover activation of perisynaptic glutamate receptors (Sagdullaev et al., 2006), which have distinct subunit compositions compared to synaptic receptors (Zhang and Diamond, 2009). This chronic glutamatergic activity is linked to excitotoxicity in other retinal neurons, but RGCs are resilient (Ullian et al., 2004). The ratio of glutamate receptor subtypes has been linked to cell survival in various neurodegenerative diseases (Bordji et al., 2010; Gardoni et al., 2006; Okamoto et al., 2009). Therefore, changes in glutamate receptor expression may occur in RD, and could be linked to RGC survival into late stages of the disease, as well as the persistence of photopsias in humans with RD.
Figure 7.
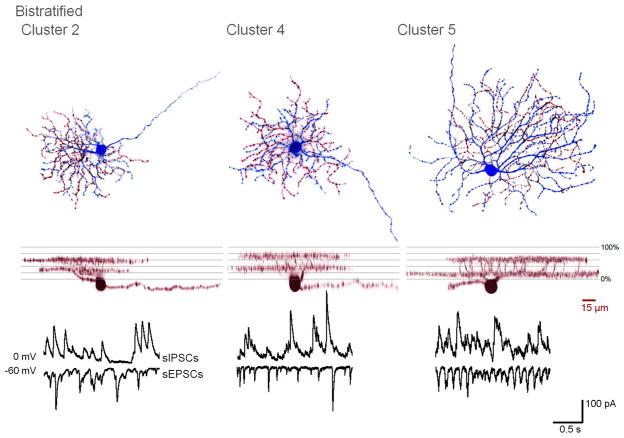
3D-projections and spontaneous activity of representative cells from bistratified clusters 2, 4, and 5. In flat views, the soma and inner dendritic arbors are in blue, while the outer arbors are in red.
Acknowledgments
This work was supported by the NIH grant R01-EY020535 (B.T.S)
Footnotes
Conflict of interest statement
The authors have no conflicts of interest to disclose.
Role of authors
All authors had full access to all the data in the study and take responsibility for the integrity of the data and the accuracy of the data analysis. Study concept and design: CWY, BTS. Acquisition of data: AHT, BTS. Analysis and interpretation of data: CWY, EI, BTS. Drafting of the manuscript: CWY. Obtained funding: BTS. Study supervision: BTS.
Literature Cited
- Badea TC, Nathans J. Quantitative analysis of neuronal morphologies in the mouse retina visualized by using a genetically directed reporter. J Comp Neurol. 2004;480(4):331–351. doi: 10.1002/cne.20304. [DOI] [PubMed] [Google Scholar]
- Bordji K, Becerril-Ortega J, Nicole O, Buisson A. Activation of extrasynaptic, but not synaptic, NMDA receptors modifies amyloid precursor protein expression pattern and increases amyloid-ss production. J Neurosci. 2010;30(47):15927–15942. doi: 10.1523/JNEUROSCI.3021-10.2010. [DOI] [PMC free article] [PubMed] [Google Scholar]
- Borowska J, Trenholm S, Awatramani GB. An intrinsic neural oscillator in the degenerating mouse retina. J Neurosci. 2011;31(13):5000–5012. doi: 10.1523/JNEUROSCI.5800-10.2011. [DOI] [PMC free article] [PubMed] [Google Scholar]
- Chang B, Hawes NL, Hurd RE, Davisson MT, Nusinowitz S, Heckenlively JR. Retinal degeneration mutants in the mouse. Vision Res. 2002;42(4):517–525. doi: 10.1016/s0042-6989(01)00146-8. [DOI] [PubMed] [Google Scholar]
- Choi H, Zhang L, Cembrowski MS, Sabottke CF, Markowitz AL, Butts DA, Kath WL, Singer JH, Riecke H. Intrinsic Bursting of AII Amacrine Cells Underlies Oscillations in the rd1 Mouse Retina. J Neurophysiol. 2014 doi: 10.1152/jn.00437.2014. [DOI] [PMC free article] [PubMed] [Google Scholar]
- Chua J, Fletcher EL, Kalloniatis M. Functional remodeling of glutamate receptors by inner retinal neurons occurs from an early stage of retinal degeneration. J Comp Neurol. 2009;514(5):473–491. doi: 10.1002/cne.22029. [DOI] [PubMed] [Google Scholar]
- Coombs J, van der List D, Wang GY, Chalupa LM. Morphological properties of mouse retinal ganglion cells. Neuroscience. 2006;140(1):123–136. doi: 10.1016/j.neuroscience.2006.02.079. [DOI] [PubMed] [Google Scholar]
- Damiani D, Novelli E, Mazzoni F, Strettoi E. Undersized dendritic arborizations in retinal ganglion cells of the rd1 mutant mouse: a paradigm of early onset photoreceptor degeneration. J Comp Neurol. 2012;520(7):1406–1423. doi: 10.1002/cne.22802. [DOI] [PMC free article] [PubMed] [Google Scholar]
- Farber DB, Flannery JG, Bowesrickman C. The Rd Mouse Story - 70 Years of Research on an Animal-Model of Inherited Retinal Degeneration. Progress in Retinal and Eye Research. 1994;13(1):31–64. [Google Scholar]
- Farrow K, Masland RH. Physiological clustering of visual channels in the mouse retina. J Neurophysiol. 2011;105(4):1516–1530. doi: 10.1152/jn.00331.2010. [DOI] [PMC free article] [PubMed] [Google Scholar]
- Gardoni F, Picconi B, Ghiglieri V, Polli F, Bagetta V, Bernardi G, Cattabeni F, Di Luca M, Calabresi P. A critical interaction between NR2B and MAGUK in L-DOPA induced dyskinesia. J Neurosci. 2006;26(11):2914–2922. doi: 10.1523/JNEUROSCI.5326-05.2006. [DOI] [PMC free article] [PubMed] [Google Scholar]
- Gargini C, Terzibasi E, Mazzoni F, Strettoi E. Retinal organization in the retinal degeneration 10 (rd10) mutant mouse: a morphological and ERG study. J Comp Neurol. 2007;500(2):222–238. doi: 10.1002/cne.21144. [DOI] [PMC free article] [PubMed] [Google Scholar]
- Ghosh KK, Bujan S, Haverkamp S, Feigenspan A, Wassle H. Types of bipolar cells in the mouse retina. J Comp Neurol. 2004;469(1):70–82. doi: 10.1002/cne.10985. [DOI] [PubMed] [Google Scholar]
- Jones BW, Kondo M, Terasaki H, Lin Y, McCall M, Marc RE. Retinal remodeling. Jpn J Ophthalmol. 2012;56(4):289–306. doi: 10.1007/s10384-012-0147-2. [DOI] [PMC free article] [PubMed] [Google Scholar]
- Jones BW, Kondo M, Terasaki H, Watt CB, Rapp K, Anderson J, Lin Y, Shaw MV, Yang JH, Marc RE. Retinal remodeling in the Tg P347L rabbit, a large-eye model of retinal degeneration. J Comp Neurol. 2011;519(14):2713–2733. doi: 10.1002/cne.22703. [DOI] [PMC free article] [PubMed] [Google Scholar]
- Ke JB, Wang YBV, Borghuis BG, Cembrowski MS, Riecke H, Kath WL, Demb JB, Singer JH. Adaptation to Background Light Enables Contrast Coding at Rod Bipolar Cell Synapses. Neuron. 2014;81(2):388–401. doi: 10.1016/j.neuron.2013.10.054. [DOI] [PMC free article] [PubMed] [Google Scholar]
- Kong JH, Fish DR, Rockhill RL, Masland RH. Diversity of ganglion cells in the mouse retina: unsupervised morphological classification and its limits. J Comp Neurol. 2005;489(3):293–310. doi: 10.1002/cne.20631. [DOI] [PubMed] [Google Scholar]
- Marc RE, Jones BW, Anderson JR, Kinard K, Marshak DW, Wilson JH, Wensel T, Lucas RJ. Neural reprogramming in retinal degeneration. Invest Ophthalmol Vis Sci. 2007;48(7):3364–3371. doi: 10.1167/iovs.07-0032. [DOI] [PMC free article] [PubMed] [Google Scholar]
- Marc RE, Jones BW, Watt CB, Anderson JR, Sigulinsky C, Lauritzen S. Retinal connectomics: Towards complete, accurate networks. Prog Retin Eye Res. 2013 doi: 10.1016/j.preteyeres.2013.08.002. [DOI] [PMC free article] [PubMed] [Google Scholar]
- Marc RE, Jones BW, Watt CB, Strettoi E. Neural remodeling in retinal degeneration. Prog Retin Eye Res. 2003;22(5):607–655. doi: 10.1016/s1350-9462(03)00039-9. [DOI] [PubMed] [Google Scholar]
- Margolis DJ, Gartland AJ, Singer JH, Detwiler PB. Network oscillations drive correlated spiking of ON and OFF ganglion cells in the rd1 mouse model of retinal degeneration. PLoS One. 2014;9(1):e86253. doi: 10.1371/journal.pone.0086253. [DOI] [PMC free article] [PubMed] [Google Scholar]
- Margolis DJ, Newkirk G, Euler T, Detwiler PB. Functional stability of retinal ganglion cells after degeneration-induced changes in synaptic input. J Neurosci. 2008;28(25):6526–6536. doi: 10.1523/JNEUROSCI.1533-08.2008. [DOI] [PMC free article] [PubMed] [Google Scholar]
- Mazzoni F, Novelli E, Strettoi E. Retinal ganglion cells survive and maintain normal dendritic morphology in a mouse model of inherited photoreceptor degeneration. J Neurosci. 2008;28(52):14282–14292. doi: 10.1523/JNEUROSCI.4968-08.2008. [DOI] [PMC free article] [PubMed] [Google Scholar]
- Menzler J, Zeck G. Network oscillations in rod-degenerated mouse retinas. J Neurosci. 2011;31(6):2280–2291. doi: 10.1523/JNEUROSCI.4238-10.2011. [DOI] [PMC free article] [PubMed] [Google Scholar]
- O’Brien EE, Greferath U, Fletcher EL. The effect of photoreceptor degeneration on ganglion cell morphology. J Comp Neurol. 2014;522(5):1155–1170. doi: 10.1002/cne.23487. [DOI] [PubMed] [Google Scholar]
- Okamoto S, Pouladi MA, Talantova M, Yao D, Xia P, Ehrnhoefer DE, Zaidi R, Clemente A, Kaul M, Graham RK, Zhang D, Vincent Chen HS, Tong G, Hayden MR, Lipton SA. Balance between synaptic versus extrasynaptic NMDA receptor activity influences inclusions and neurotoxicity of mutant huntingtin. Nat Med. 2009;15(12):1407–1413. doi: 10.1038/nm.2056. [DOI] [PMC free article] [PubMed] [Google Scholar]
- Pu M, Xu L, Zhang H. Visual response properties of retinal ganglion cells in the royal college of surgeons dystrophic rat. Invest Ophthalmol Vis Sci. 2006;47(8):3579–3585. doi: 10.1167/iovs.05-1450. [DOI] [PubMed] [Google Scholar]
- Puthussery T, Gayet-Primo J, Pandey S, Duvoisin RM, Taylor WR. Differential loss and preservation of glutamate receptor function in bipolar cells in the rd10 mouse model of retinitis pigmentosa. Eur J Neurosci. 2009;29(8):1533–1542. doi: 10.1111/j.1460-9568.2009.06728.x. [DOI] [PMC free article] [PubMed] [Google Scholar]
- Sagdullaev BT, McCall MA, Lukasiewicz PD. Presynaptic inhibition modulates spillover, creating distinct dynamic response ranges of sensory output. Neuron. 2006;50(6):923–935. doi: 10.1016/j.neuron.2006.05.015. [DOI] [PubMed] [Google Scholar]
- Stasheff SF. Emergence of sustained spontaneous hyperactivity and temporary preservation of OFF responses in ganglion cells of the retinal degeneration (rd1) mouse. J Neurophysiol. 2008;99(3):1408–1421. doi: 10.1152/jn.00144.2007. [DOI] [PubMed] [Google Scholar]
- Stasheff SF, Shankar M, Andrews MP. Developmental time course distinguishes changes in spontaneous and light-evoked retinal ganglion cell activity in rd1 and rd10 mice. J Neurophysiol. 2011;105(6):3002–3009. doi: 10.1152/jn.00704.2010. [DOI] [PubMed] [Google Scholar]
- Strettoi E, Pignatelli V. Modifications of retinal neurons in a mouse model of retinitis pigmentosa. Proc Natl Acad Sci U S A. 2000;97(20):11020–11025. doi: 10.1073/pnas.190291097. [DOI] [PMC free article] [PubMed] [Google Scholar]
- Sun W, Li N, He S. Large-scale morphological survey of mouse retinal ganglion cells. J Comp Neurol. 2002;451(2):115–126. doi: 10.1002/cne.10323. [DOI] [PubMed] [Google Scholar]
- Toychiev AH, Ivanova E, Yee CW, Sagdullaev BT. Block of gap junctions eliminates aberrant activity and restores light responses during retinal degeneration. J Neurosci. 2013a;33(35):13972–13977. doi: 10.1523/JNEUROSCI.2399-13.2013. [DOI] [PMC free article] [PubMed] [Google Scholar]
- Toychiev AH, Yee CW, Sagdullaev BT. Correlated spontaneous activity persists in adult retina and is suppressed by inhibitory inputs. PLoS One. 2013b;8(10):e77658. doi: 10.1371/journal.pone.0077658. [DOI] [PMC free article] [PubMed] [Google Scholar]
- Trenholm S, Borowska J, Zhang J, Hoggarth A, Johnson K, Barnes S, Lewis TJ, Awatramani GB. Intrinsic oscillatory activity arising within the electrically coupled AII amacrine-ON cone bipolar cell network is driven by voltage-gated Na+ channels. J Physiol. 2012;590(Pt 10):2501–2517. doi: 10.1113/jphysiol.2011.225060. [DOI] [PMC free article] [PubMed] [Google Scholar]
- Ullian EM, Barkis WB, Chen S, Diamond JS, Barres BA. Invulnerability of retinal ganglion cells to NMDA excitotoxicity. Mol Cell Neurosci. 2004;26(4):544–557. doi: 10.1016/j.mcn.2004.05.002. [DOI] [PubMed] [Google Scholar]
- Volgyi B, Chheda S, Bloomfield SA. Tracer coupling patterns of the ganglion cell subtypes in the mouse retina. J Comp Neurol. 2009;512(5):664–687. doi: 10.1002/cne.21912. [DOI] [PMC free article] [PubMed] [Google Scholar]
- Yee CW, Toychiev AH, Sagdullaev BT. Network deficiency exacerbates impairment in a mouse model of retinal degeneration. Front Syst Neurosci. 2012;6:8. doi: 10.3389/fnsys.2012.00008. [DOI] [PMC free article] [PubMed] [Google Scholar]
- Zeck GM, Masland RH. Spike train signatures of retinal ganglion cell types. Eur J Neurosci. 2007;26(2):367–380. doi: 10.1111/j.1460-9568.2007.05670.x. [DOI] [PubMed] [Google Scholar]
- Zhang J, Diamond JS. Subunit- and pathway-specific localization of NMDA receptors and scaffolding proteins at ganglion cell synapses in rat retina. J Neurosci. 2009;29(13):4274–4286. doi: 10.1523/JNEUROSCI.5602-08.2009. [DOI] [PMC free article] [PubMed] [Google Scholar]


