Abstract
Introduction
Methods allowing one to locate the position of a cutaneous perforator do not allow one to determine the boundaries of the vascularized skin. In clinical practice this causes complications in the form of marginal necrosis of the flap.
Aim
To examine the usefulness of thermography to assess the extent of vascularization of the skin and subcutaneous tissue by a single perforator.
Material and methods
Thirty-one male rats were used. Using dynamic thermography the perforators on the abdominal skin were located. Afterwards the flap was prepared on a randomly chosen perforator. After 24 h the extent of vascularization of the skin by a single perforator was examined.
Results
In 22.5% of cases the number of perforators marked in the thermography was equal to the number of perforators marked intraoperatively, in 64.5% it was lower and in 13% higher. The use of thermography has shown that basing the flap vascularization on the perforator with low efficiency resulted in statistically more frequent occurrence of ischemia and partial necrosis of the flap (p = 0.024). Partial necrosis of the flap occurred in 12 of 31 cases, always in the area in which during the preoperative thermography no perforators were found. The areas of necrosis occurred irrespectively of the distance from the supplying vessel.
Conclusions
When designing the shape of the flap, the distribution of all perforators must be considered. The perforators need to be included in the area of prepared tissues because their location indicates the area with a more efficient network of vessels.
Keywords: thermography, perforator, flap
Introduction
The literature describes many methods used for imaging the axial vessels or perforators, including angiography, ultrasonography, computed tomography angiography (CTA), magnetic resonance angiography (MRA), stereotaxy, near-infrared fluorescence, and laser Doppler [1, 2]. In recent years the interest in thermography has increased. It is a new method, still in the phase of research, so no developed algorithm of measurements exists [3, 4].
All of the mentioned methods allow for precise location of the perforator, whereas no method allowing one to preoperatively determine the size of the skin area vascularized by a single vessel or perforator has been described in a satisfactory way.
Aim
To examine the usefulness of thermography to assess the extent of vascularization of the skin and subcutaneous tissue by a single perforator.
Material and methods
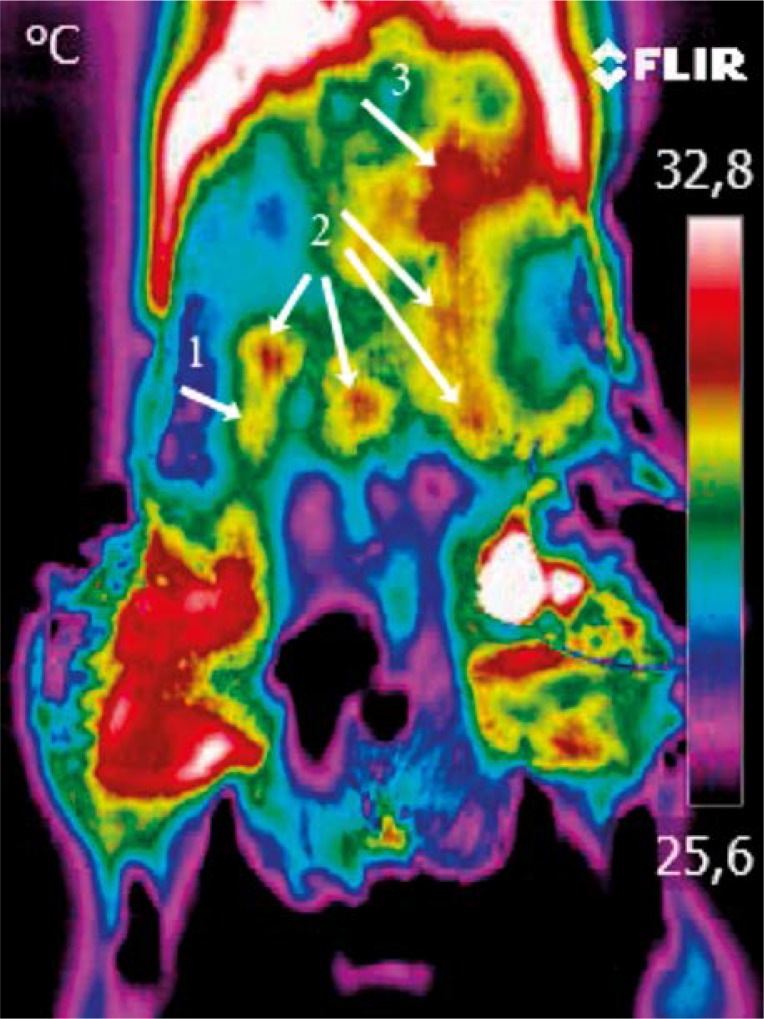
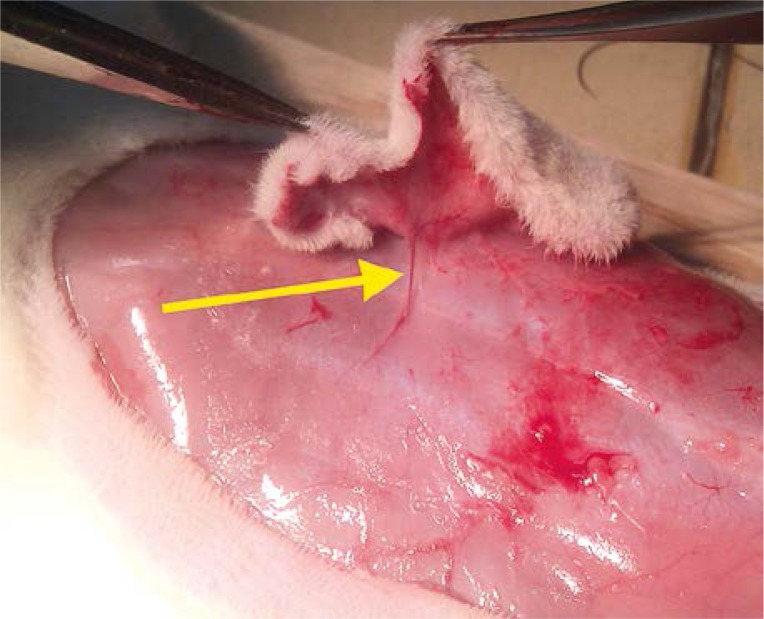
Thirty-one male rats were used. Animals were anesthetized with intramuscular injection of ketamine 100 mg/kg body weight. Using dynamic thermography, performed with the FLIR T335 camera, the perforators on the abdominal skin were localized. The “hot spot” appearing first was recognized as the strongest perforator (dominating), while the “hot spot” appearing last was recognized as the weakest perforator. “Hot spots” appearing in between were recognized as perforators with an average efficiency (Photo 1). Afterwards the flap was prepared on a randomly chosen perforator (Photo 2) and sewn in the integuments, separated from the base with a foil. The foil prevented the collateral circulation to form. This ensured an objective evaluation of blood supply by a given perforator. After 24 h the blood supply of the flap was studied in the search for necrotic foci. Animals were put to death by intramuscular injection of sodium pentobarbital 200 mg/kg body weight. The Local Ethical Committee approved the research.
Photo 1.
Strength of the perforator evaluated using thermography: weak perforator – 1; average perforator – 2; dominant perforator – 3
Photo 2.
Prepared flap on a randomly chosen perforator (yellow arrow)
Results
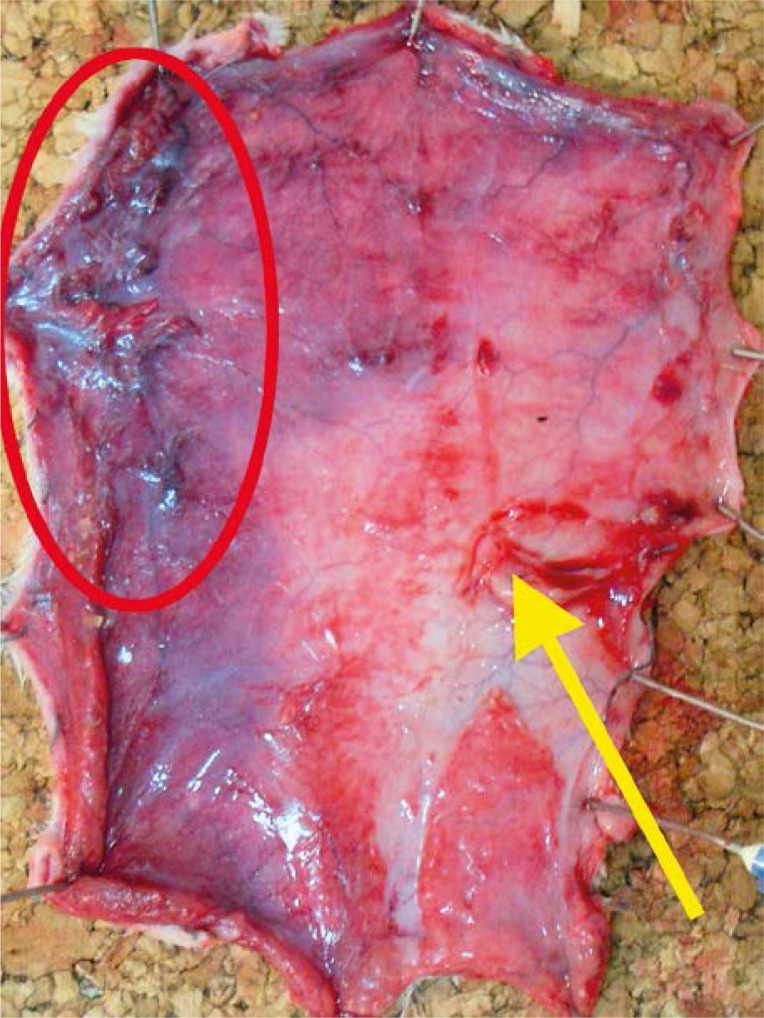
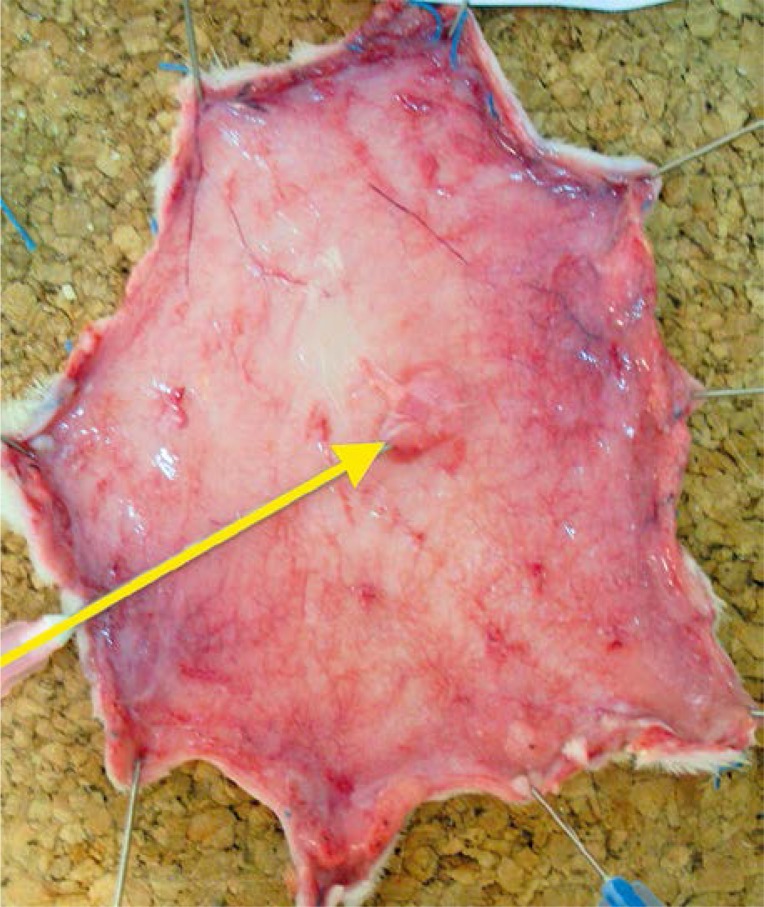
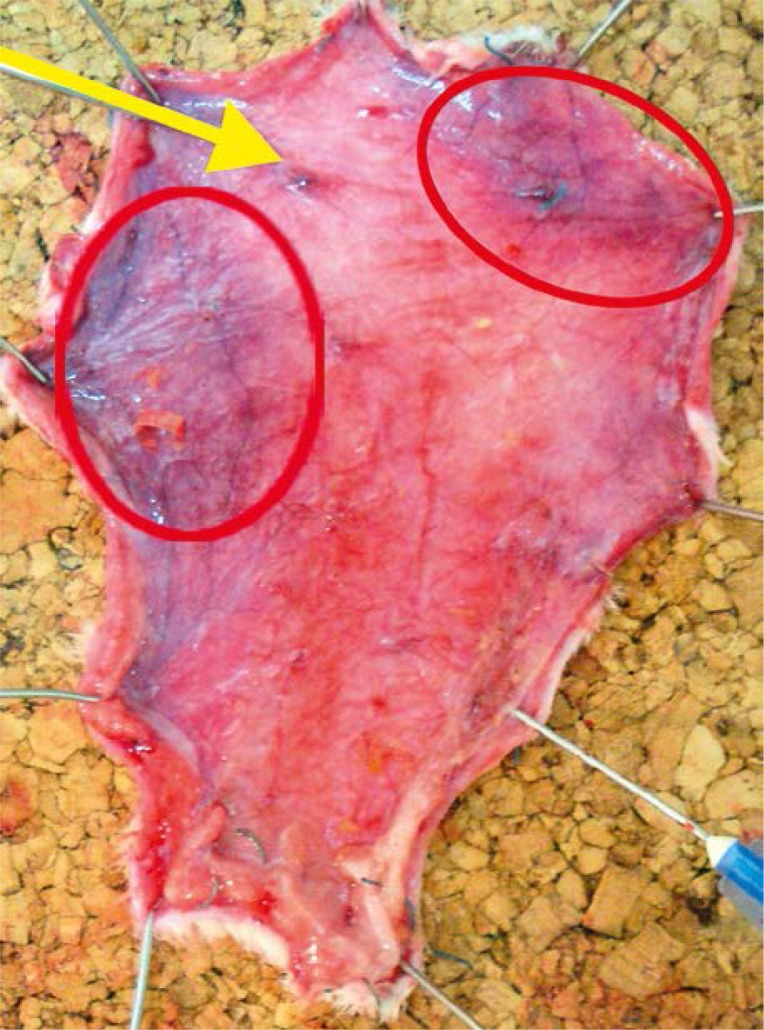
All rats survived the surgery period. In the preoperative period animals assimilated food and water well and showed normal activity. After 24 h of observations the clinical evaluation of skin was uncertain and it was difficult to clearly define the borders of ischemia and necrosis. Those changes were clearly visible on the inner surface of the flap where the layer of fatty tissue showed higher sensitivity to ischemia (Photos 3–5).
Photo 3.
Quality of blood supply after 24 h: flap with necrotic areas (red ellipse); blood supplied perforator (yellow arrow)
Photo 5.
Quality of blood supply after 24 h: flap properly supplied with blood; blood supplied perforator (yellow arrow)
Photo 4.
Quality of blood supply after 24 h: flap with ischemic area (red ellipse); blood supplied perforator (yellow arrow)
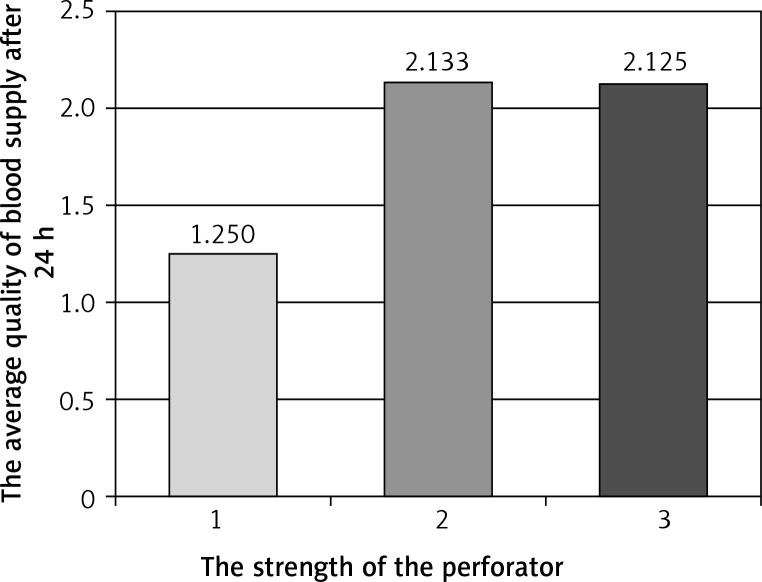
The efficiency of perforators was evaluated by use of thermography. Basing the blood supply of the flap on the perforator with low efficiency resulted in statistically more frequent occurrence of necrosis and ischemia of the flap (p = 0.024) (Table I, Figures 1–3).
Table I.
Pearson correlation coefficient involving the strength of the perforator evaluated using thermography and the quality of the blood supply of the flap after 24 h
| Rat number | Strength of perforator | Quality of blood supply of the flap after 24 h |
|---|---|---|
| 1 | 2 | 3 |
| 2 | 2 | 3 |
| 3 | 3 | 3 |
| 4 | 2 | 3 |
| 5 | 3 | 3 |
| 6 | 2 | 1 |
| 7 | 1 | 1 |
| 8 | 1 | 1 |
| 9 | 2 | 2 |
| 10 | 2 | 3 |
| 11 | 2 | 2 |
| 12 | 2 | 1 |
| 13 | 2 | 2 |
| 14 | 3 | 2 |
| 15 | 2 | 2 |
| 16 | 1 | 2 |
| 17 | 2 | 1 |
| 18 | 2 | 1 |
| 19 | 3 | 2 |
| 20 | 3 | 2 |
| 21 | 1 | 1 |
| 22 | 3 | 2 |
| 23 | 1 | 1 |
| 24 | 3 | 1 |
| 25 | 1 | 1 |
| 26 | 2 | 3 |
| 27 | 1 | 2 |
| 28 | 1 | 1 |
| 29 | 3 | 2 |
| 30 | 2 | 2 |
| 31 | 2 | 3 |
Strength of the perforator: weak perforator – 1; average perforator – 2; dominant perforator – 3. Quality of blood supply after 24 h: flap with necrotic areas – 1; flap with ischemic area – 2; flap properly supplied with blood – 3.
Correlation coefficient = 0.4046, p = 0.024
Figure 1.
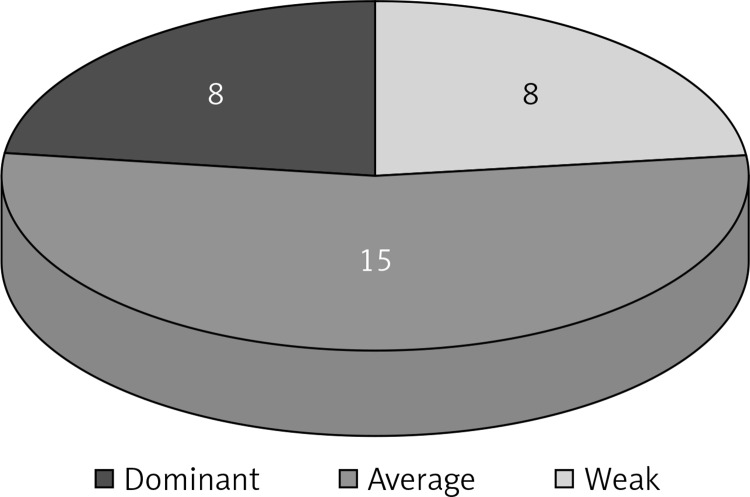
Strength of the perforator evaluated with thermography: weak perforator – 8 cases; average perforator – 15 cases; dominant perforator – 8 cases
Figure 3.
Average quality of blood supply after 24 h relative to strength of the perforator
Figure 2.
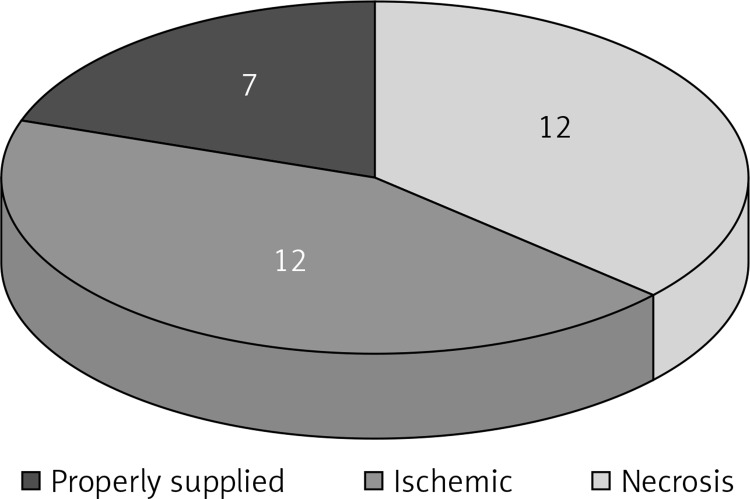
Quality of blood supply after 24 h: flap with necrotic areas – 12 cases; flap with ischemic area – 12 cases; flap properly supplied with blood – 7 cases
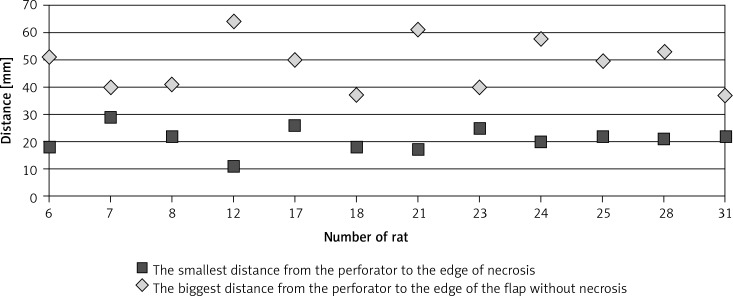
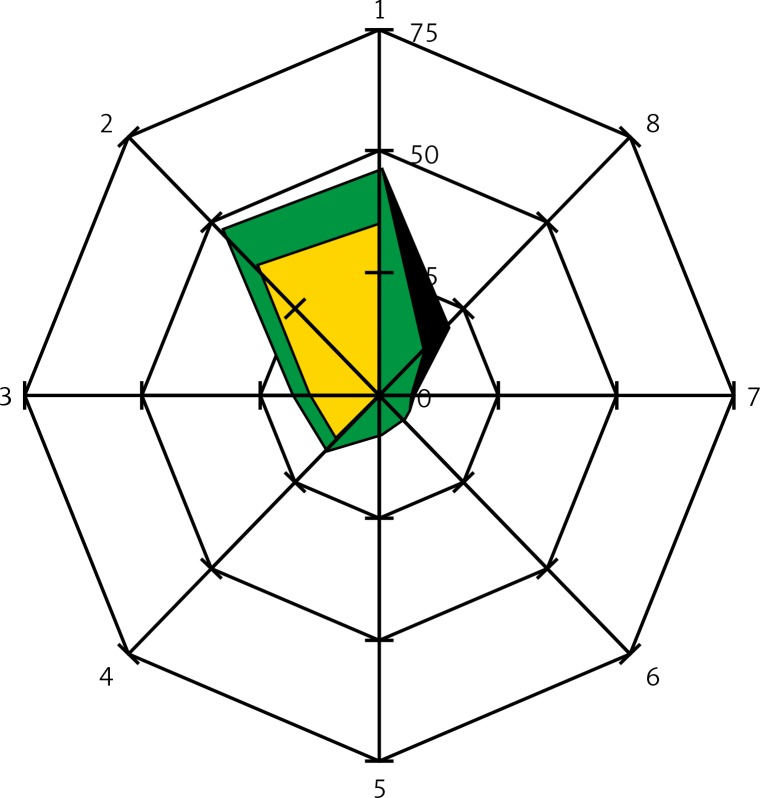
In the conducted research partial necrosis of the flap occurred in 12 out of 31 cases. Necrosis in all cases occurred in the area in which no perforators were visible in thermography (Table II). Areas of necrosis were not related to the distance from the single supplying vessel (Figures 4, 5).
Table II.
Presence of remaining perforators (except for the perforator nourishing the flap) marked using thermography (before dissection of the flap) in the area of necrosis observed intraoperatively after 24 h
| Rat number | Ischemia of the flap | |
|---|---|---|
| In the area without perforators | In the area with perforators | |
| 6 | + | – |
| 7 | + | – |
| 8 | + | – |
| 12 | + | – |
| 17 | + | – |
| 18 | + | – |
| 21 | + | – |
| 23 | + | – |
| 24 | + | – |
| 25 | + | – |
| 28 | + | – |
| 31 | + | – |
| Total | 12 | 0 |
Figure 4.
Distance of the perforator from the edge of the necrosis and the edge of the flap without necrosis
Figure 5.
Shows the abdominal skin flap schemes (radar charts) in which the necrosis occurred. The center of the chart represents a perforator on which the blood supply of the flap was based. On the axes were marked: the distance [mm] and the direction from the perforator to: borders of the necrotic areas: black color  , borders of the healthy tissue areas: green color
  , borders of the areas containing other perforators: yellow color
  . The directions on the chart are indicated by the numbers 1–8, direction 1 refers to the cephalad part of the flap, direction 5 refers to the caudad part of the flap
No correlation between the strength of the perforator evaluated using thermography and the area of flap well supplied with blood was observed. This suggests that the strength of the perforator has no direct influence on the size of the flap (Table III).
Table III.
Pearson correlation coefficient involving the strength of the perforator measured using thermography and the area of flap well supplied with blood
| Rat number | Area of the flap well supplied with blood [cm2] | Strength of perforator |
|---|---|---|
| 1 | 34.5 | 3 |
| 2 | 36 | 3 |
| 3 | 37 | 3 |
| 4 | 34.5 | 3 |
| 5 | 46.5 | 3 |
| 6 | 11.5 | 1 |
| 7 | 9.5 | 1 |
| 8 | 19.5 | 1 |
| 9 | 29 | 2 |
| 10 | 26 | 3 |
| 11 | 17 | 2 |
| 12 | 0 | 1 |
| 13 | 23 | 2 |
| 14 | 18 | 2 |
| 15 | 27.5 | 2 |
| 16 | 30 | 2 |
| 17 | 23 | 1 |
| 18 | 0 | 1 |
| 19 | 16 | 2 |
| 20 | 34.5 | 2 |
| 21 | 0 | 1 |
| 22 | 18 | 2 |
| 23 | 20.5 | 1 |
| 24 | 20 | 1 |
| 25 | 20 | 1 |
| 26 | 21 | 3 |
| 27 | 28 | 2 |
| 28 | 26.5 | 1 |
| 29 | 17 | 2 |
| 30 | 22 | 2 |
| 31 | 16.5 | 3 |
Correlation coefficient = 0.22, p = 0.23
Discussion
Vessels providing blood supply in rat abdominal skin have a diameter not exceeding a few tenths of a millimeter and by using a thermovisual camera with adequate sensitivity the identification of the place in which they penetrate the skin is possible. Currently, most of the measurements in medical examinations are done using the technique of active dynamic thermography, based on initial tissue temperature change and registration of its return. In the examination of vessels most authors use the method of pre-cooling, both with a cold compress as well as the airflow from the fan. Thanks to such methods the perforators reaching the skin can easily be exposed [4–9]. In our research the technique of initial cooling was used.
Vessels supplying the skin are defined on the basis of “hot spots” appearing in the thermographic image. Arterial perforators penetrating the skin provide blood which is warmer than the surrounding tissues and causes a point temperature rise [6–10].
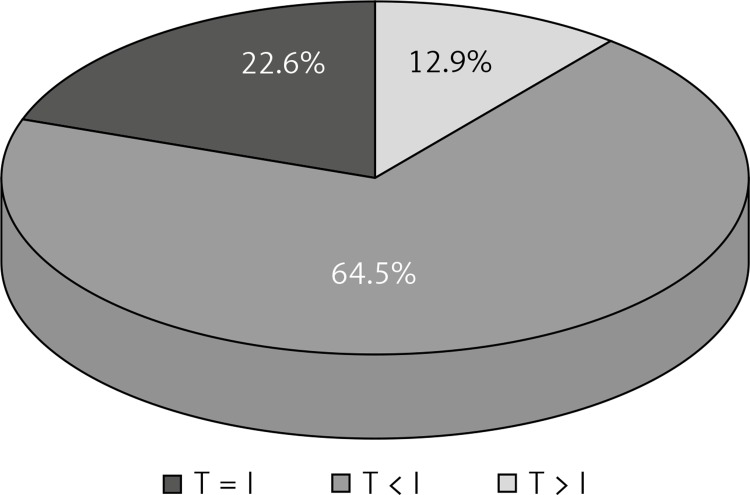
In the literature, the influence of experimental conditions and measurement techniques to obtain reliable results are underlined [3, 5, 6, 8, 11, 12]. In 20 animals (64.5%) the presence of perforators was determined intraoperatively with the lack of “hot spots” in the thermovisual image. It seems that too little blood flow and too small differences in the temperatures caused by its inflow could have been the reason. In 7 animals (22.6%) the number of perforators marked in thermography coincided with the number of perforators marked intraoperatively. In 4 animals (12.9%) the number of perforators in thermography was greater than the number of perforators found intraoperatively. While analyzing the course of the experiment, I noticed that minor damage to the epidermis during the shearing was visible in the thermovisual image as spot areas of higher temperature. This may be the result of fallible interpretations in which the thermovisual image indicated the presence of a perforator whereas I did not notice it intraoperatively (Figure 6). The literature describes cases in which “hot spots” were found in thermography but not in the intraoperative examination. The cause of such observations may be the local increase of skin and subcutaneous tissue metabolism in the spots of stigmas on the skin or after earlier injections of insulin and heparin. Tenorio describes the displacement of some of the “hot spots” against the perforators found during the operation. He explains that perforators are sought at the level of deep fascia whereas thermography provides an image of the surface of the skin. Some of the perforators run aslant in the subcutaneous tissue. This can be the cause of displacement of “hot spot” against the perforator [10]. In the literature it is stated that the number of perforators found in thermography shows 67% to 100% correspondence to the number of perforators found in ultrasonography and CT. Perforators appearing in thermography as first were easily exposed in ultrasonography. However, not all perforators found in ultrasonography were visible in thermography. This was confirmed by intraoperative observations in which the found vessels corresponded to those marked in thermography only if their diameter was greater than 1 mm. If the diameter was smaller than 1 mm “hot spots” did not always appear in thermography – the authors, however, do not give statistical elaborations [6, 8, 10, 13].
Figure 6.
Compatibility of thermography (T) and intraoperative evaluation (I) in defining the number of perforators
It has been observed that the size of the “hot spot” was proportional to the diameter of the perforator [9, 10, 14]. The diameter of perforators penetrating the skin, identified in the conducted research, ranged from 0.1 mm to 0.4 mm. In the clinical environment to prepare a flap, perforators with the greatest diameter are sought. For example, in breast reconstruction with the use of a hypogastric flap, perforators with the diameter of 1 mm and higher are crucial. The conducted study shows that the camera used in the experiment is sensitive enough to identify perforators penetrating human skin [8, 15–19].
In the rat the perforators were marked in 1.5–3 mm thick flaps. In humans the thickness of a flap reaches up to 10 cm, sometimes more. I did not find elaborations concerning the influence of subcutaneous tissue thickness in thermovisual identification of perforators in the literature. From a physical point of view it seems that the thickness of the fatty tissue can influence the clarity of the measurement. According to El-Mrakba and Milner the perforators can be divided into bigger (> 0.5 mm), reaching the skin directly, and smaller (< 0.5 mm), reaching the subcutaneous tissue plexus [20, 21]. During the preparation of the flaps the perforators with greater diameter are chosen. In thermography the perforators reaching the surface of the skin are more visible, whereas perforators branching in the subcutaneous tissue can be invisible. This may be the reason for the greater number of perforators found intraoperatively in a rat, which were not convincingly visible in thermography. Bigger perforators with a large diameter provide a larger volume of warm blood per time unit, closer to the surface of skin. This causes the appearance of “hot spots” in the thermographic image interpreted as strong perforators.
The amount of blood flow can be quantifiably evaluated with Doppler ultrasonography. By comparing the rate of blood flow determined by Doppler ultrasonography and the dynamics of expansion of “hot spots” in thermovisual examination in the unit of time, the strength of the perforator can be evaluated with some approximation. The literature describes strengthening of the audio signal in Hand Held Doppler during the examination of “hot spots” corresponding to the strong perforator, but it has not been clearly confirmed statistically [8, 14]. Accordingly, the thermovisual camera is a promising tool in preoperative diagnosis of perforator efficiency.
The course of vessels can be exposed using many commonly used methods, including arteriography and Doppler ultrasonography. Thermography does not provide much information on the course of vessels, especially those lying deep in the tissues. Shallow lying vessels such as the superficial venous system are an exception [22].
The increase of skin warmth is connected with the blood flow in the capillary vessels which is hardly visible in the conventional imaging examinations. Other methods such as Doppler laser and near-infrared fluorescence allow one to evaluate the capillary blood flow, but the procedures are complicated and require expensive equipment. The blood flow in the capillary circulation can be indirectly evaluated by use of thermography. The interpretation of the thermovisual image is simple – areas of different colors correspond to different temperatures. Areas with a higher temperature correspond to the range of blood supply of a given vessel. It is known that the diameter of the vessel has an effect on the mass of the blood supplied tissue. The smaller the diameter the smaller the range of blood supply. That is why when interpreting thermographic images “hot spots” having a higher temperature and appearing first were marked as dominating perforators, whereas “hot spots” which appeared last on the image were qualified as the weakest perforators. “Hot spots” appearing in between the first and last were qualified as intermediately efficient perforators. Such division was reflected in the areas of blood supplied flaps. If the blood supply of the flap was based on the perforator that appeared last in the thermography (the weakest one), necrosis occurred statistically more frequently. In the case of blood supply of the flap based on the dominating perforator, necrosis was observed only in 1 case. The research results of other authors suggest that choosing the dominant perforator provides better blood supply for the flap and reduces the risk of necrosis, in comparison to another single perforator. de Weerd described 23 flaps based on the perforator marked in thermography as dominant. He noted small partial flap necrosis in 3/23 (< 5%) [8, 10, 15, 23, 24]. If the flap was supplied by several smaller vessels, it was better supplied with blood than in the case of a single dominating perforator [25]. The results of the conducted research show that the blood supply of the flap should not be based on a randomly chosen vessel.
Before conducting the research I assumed that the likelihood of necrosis increases with the distance from the supplying vessel. This is the impression we get in clinical practice observing randomly supplied flaps, based mainly on the capillary blood flow. In humans the ratio of the length of the flap to its base is 1 : 1. The cut in the longer flap causes marginal necrosis because of the poorly efficient circulation. However, within the face, where the blood supply is much better, flaps can be cut without risk of necrosis, preserving the ratio of base to length 1 : 5 or even 1 : 7. Elongation of the flap above some border causes marginal necrosis. In the conducted research the occurrence of necrosis was not related to the distance from the perforator. The distribution of perforators in the integuments is variable between individuals and asymmetrical. In our research the areas with necrosis occurred in places bereft of perforators in the thermographic image. It is known from the skin anatomy that between the perforators and their branches many anastomoses occur. While describing the “delay phenomenon” it was noticed that blood flow in anastomosis connecting the perforators increases when the inflow through individual vessels stops [26–28]. The presence of anastomosis can provide proper blood supply of the distal parts of the flap, whereas their lack can be the cause of necrosis. It seems that a large number of perforators in a given area of skin provides a thick and more efficient network of intradermal vessels providing better blood supply, whereas a lack of perforators in a given area can predispose it to ischemia and necrosis. Observations suggest that when designing the shape of a flap, after choosing the main supplying vessel, the distribution of remaining perforators must be taken into account. The distance from the border of the flap to the supplying perforator seems to be of secondary importance. Similar dependence was described by de Weerd. Necrosis in zone IV of the DIEP flap occurred in the area in which no perforators were seen in thermography, whereas areas in which perforators appeared maintained the proper blood supply [4]. Occurrence of necrosis in the non-perforated areas can be explained with the phenomenon called “stealing”, which can be observed in cases of impaired patency of large arteries. Opening anastomosis between perforators in the tissue of the flap takes the main volume of blood flowing from the perforator. This causes an uneven distribution of blood in the tissues of the flap and worse blood supply of non-perforated areas where capillary circulation dominates. This can explain the necrotic foci in the direct vicinity of the vessel supplying the flap. An interesting observation resulting from the conducted research was the lack of dependence between the area of the well-supplied flap and the strength of the perforator. The explanation of this phenomenon is difficult. It seems that the differences between the diameter of dominating and weak perforators in rats were too small. Consequently the amount of blood provided by individual perforators and the area of supplied flaps did not show big differences. Perhaps a significant increase in the size of the studied group would allow us to obtain statistical differences. These results also show that the high sensitivity of measuring devices and the differences in those measurements will not always mean differences of clinical importance. The interpretation of thermovisual images must be done considering the biology of the tissues.
The importance of the deployment of the perforators is shown in the clinical research of the underbelly flaps based on the lower epigastric artery. The literature describes at least two divisions of the hypogastric flap: older according to Hartrampf and newer according to Holm. Both Hartrampf and Holm divide the flap into four zones of blood supply, in both cases the best blood supply being zone I, then it decreases gradually, reaching the lowest value in zone IV. In both cases the best blood supply area occurs in the medial one fourth of the flap, above the lower epigastric vessels (pedicle). Zone IV is found contralaterally, laterally from the median line of the body. Researchers do not agree on the location of zones II and III [29–31].
Defining the range of blood supply of skin through vessels being the pedicle of the flap can potentially decrease the risk of complications. Ischemic complications occur when the supplying vessel is not able to nourish a flap with too great volume. Despite the continuous improvement of surgical techniques, the risk of ischemia remains at 5–10%.
A chance to lower the risk is to define the area of flap vascularization through the vessels or perforators before its collection.
Conclusions
Conducted research suggests that thermography can be a useful tool in preoperative diagnosis of tissue vascularization. Before the preparation of a flap, weak perforators need to be excluded so that the blood supply is not based on them. That would increase the risk of ischemic complications. The results of the conducted experiment also suggest that when projecting the shape of the flap the distribution of all perforators needs to be considered. The perforators should be included in the area of prepared tissues because their position indicates the area with the most efficient network of above-fascial vessels.
References
- 1.Smit JM, Klein S, Werker PM. An overview of methods for vascular mapping in the planning of free flaps. J Plast Reconstr Aesthet Surg. 2010;63:674–82. doi: 10.1016/j.bjps.2010.06.013. [DOI] [PubMed] [Google Scholar]
- 2.Mathes DW, Neligan PC. Current techniques in preoperative imaging for abdomen-based perforator flap microsurgical breast reconstruction. J Reconstr Microsurg. 2010;26:3–10. doi: 10.1055/s-0029-1244806. [DOI] [PubMed] [Google Scholar]
- 3.de Weerd L, Mercer JB, Setså LB. Intraoperative dynamic infrared thermography and free-flap surgery. Ann Plast Surg. 2006;57:279–284. doi: 10.1097/01.sap.0000218579.17185.c9. [DOI] [PubMed] [Google Scholar]
- 4.de Weerd L, Miland AO, Mercer JB. Perfusion dynamics of free DIEP and SIEA flaps during the first postoperative week monitored with dynamic infrared thermography. Ann Plast Surg. 2009;62:42–7. doi: 10.1097/SAP.0b013e3181776374. [DOI] [PubMed] [Google Scholar]
- 5.Zetterman E, Salmi AM, Suominen S, et al. Effect of cooling and warming on thermographic imaging of the perforating vessels of the abdomen. Eur J Plast Surg. 1999;22:58–61. [Google Scholar]
- 6.Chubb D, Rozen WM, Whitaker IS, Ashton MW. Images in plastic surgery: digital thermographic photography (“thermal imaging”) for preoperative perforator mapping. Ann Plast Surg. 2011;66:324–5. doi: 10.1097/SAP.0b013e31820bcc5e. [DOI] [PubMed] [Google Scholar]
- 7.de Weerd L, Weum S, Mercer JB. Dynamic Infrared Thermography (DIRT) in the preoperative, intraoperative and postoperative phase of DIEP flap surgery. J Plast Reconstr Aesthet Surg. 2012;65:694–5. doi: 10.1016/j.bjps.2011.11.013. [DOI] [PubMed] [Google Scholar]
- 8.de Weerd L, Weum S, Mercer JB. The value of dynamic infrared thermography (DIRT) in perforatorselection and planning of free DIEP flaps. Ann Plast Surg. 2009;63:274–9. doi: 10.1097/SAP.0b013e3181b597d8. [DOI] [PubMed] [Google Scholar]
- 9.de Weerd L, Mercer JB, Weum S. Dynamic infrared thermography. Clin Plast Surg. 2011;38:277–92. doi: 10.1016/j.cps.2011.03.013. [DOI] [PubMed] [Google Scholar]
- 10.Tenorio X, Mahajan AL, Elias B, et al. Locating perforator vessels by dynamic infrared imaging and flow Doppler with no thermal cold challenge. Ann Plast Surg. 2011;67:143–6. doi: 10.1097/SAP.0b013e3181ef6da3. [DOI] [PubMed] [Google Scholar]
- 11.Nowakowski A. Postępy termografii – aplikacje medyczne [Polish]; Gdansk: 2001. [Google Scholar]
- 12.Renkierska A. The usefulness of infrared imaging in assessing burn wound depth – an experimental study [Polish]; Gdansk: Akademia Medyczna; 2006. [Google Scholar]
- 13.Whitaker IS, Lie KH, Rozen WM, et al. Dynamic infrared thermography for the preoperative planning of microsurgical breast reconstruction: a comparison with CTA. J Plast Reconstr Aesthet Surg. 2012;65:130–2. doi: 10.1016/j.bjps.2011.07.016. [DOI] [PubMed] [Google Scholar]
- 14.de Weerd L, Weum S, Mercer JB. Locating perforator vessels by dynamic infrared imaging and flow Doppler with no thermal cold challenge. Ann Plast Surg. 2014;72:261. doi: 10.1097/SAP.0b013e31823f3e24. [DOI] [PubMed] [Google Scholar]
- 15.Bailey SH, Saint-Cyr M, Wong C, et al. The single dominant medial row perforator DIEP flap in breast reconstruction: three-dimensional perforasome and clinical results. Plast Reconstr Surg. 2010;126:739–51. doi: 10.1097/PRS.0b013e3181e5f844. [DOI] [PubMed] [Google Scholar]
- 16.Maciejewski A. Podstawy mikrochirurgii rekonstrukcyjnej w onkologii [Polish]; Fundacja Polski Przeglad Chirurgiczny; Warszawa: 2011. [Google Scholar]
- 17.Saint-Cyr M, Wong C, Schaverien The perforasome theory: vascular anatomy and clinical implications. Plast Reconstr Surg. 2009;124:1529–44. doi: 10.1097/PRS.0b013e3181b98a6c. [DOI] [PubMed] [Google Scholar]
- 18.Taylor GI, Corlett RJ, Dhar SC, et al. The anatomical (angiosome) and clinical territories of cutaneous perforating arteries: development of the concept and designing safe flaps. Plast Reconstr Surg. 2011;127:1447–59. doi: 10.1097/PRS.0b013e318208d21b. [DOI] [PubMed] [Google Scholar]
- 19.Taylor GI. The angiosomes of the body and their supply to perforator flaps. Clin Plast Surg. 2003;30:331–42. doi: 10.1016/s0094-1298(03)00034-8. [DOI] [PubMed] [Google Scholar]
- 20.El-Mrakby HH, Milner RH. The vascular anatomy of the lower anterior abdominal wall: a microdissection study on the deep inferior epigastric vessels and the perforator branches. Plast Reconstr Surg. 2002;109:539–47. doi: 10.1097/00006534-200202000-00020. [DOI] [PubMed] [Google Scholar]
- 21.El-Mrakby HH, Milner RH. Bimodal distribution of the blood supply to lower abdominal fat: histological study of the microcirculation of the lower abdominal wall. Ann Plast Surg. 2003;50:165–70. doi: 10.1097/01.SAP.0000032305.93832.9B. [DOI] [PubMed] [Google Scholar]
- 22.Ward GH, Nolan PE, Jr, Chawla M, et al. Studies in phlebitis: detection and quantitation using a thermographic camera. Pharm Res. 1991;8:76–9. doi: 10.1023/a:1015834407748. [DOI] [PubMed] [Google Scholar]
- 23.Kalra S, Dancey A, Waters R. Intraoperative selection of dominant perforator vessel in DIEP free flaps based on perfusion strength using digital infrared thermography – a pilot study. J Plast Reconstr Aesthet Surg. 2007;60:1365–8. doi: 10.1016/j.bjps.2007.02.032. [DOI] [PubMed] [Google Scholar]
- 24.Matsui A, Lee BT, Winer JH, et al. Predictive capability of near-infrared fluorescence angiography in submental perforator flap survival. Plast Reconstr Surg. 2010;126:1518–27. doi: 10.1097/PRS.0b013e3181ef8ce7. [DOI] [PMC free article] [PubMed] [Google Scholar]
- 25.Rozen WM, Stella DL, Bowden J, et al. Advances in the pre-operative planning of deep inferior epigastric artery perforator flaps: magnetic resonance angiography. Microsurgery. 2009;29:119–23. doi: 10.1002/micr.20590. [DOI] [PubMed] [Google Scholar]
- 26.Codner MA, Bostwick J, 3rd, Nahai F, et al. TRAM flap vascular delay for high-risk breast reconstruction. Plast Reconstr Surg. 1995;96:1615–22. doi: 10.1097/00006534-199512000-00015. [DOI] [PubMed] [Google Scholar]
- 27.Restifo RJ, Ahmed SS, Rosser J, et al. TRAM flap perforator ligation and the delay phenomenon: development of an endoscopic/laparoscopic delay procedure. Plast Reconstr Surg. 1998;101:1503–11. doi: 10.1097/00006534-199805000-00012. [DOI] [PubMed] [Google Scholar]
- 28.Ghali S, Butler PE, Tepper OM, et al. Vascular delay revisited. Plast Reconstr Surg. 2007;119:1735–44. doi: 10.1097/01.prs.0000246384.14593.6e. [DOI] [PubMed] [Google Scholar]
- 29.Holm C, Mayr M, Höfter E, et al. Perfusion zones of the DIEP flap revisited: a clinical study. Plast Reconstr Surg. 2006;117:37–43. doi: 10.1097/01.prs.0000185867.84172.c0. [DOI] [PubMed] [Google Scholar]
- 30.Wong C, Saint-Cyr M, Mojallal A, et al. Perforasomes of the DIEP flap: vascular anatomy of the lateral versus medial row perforators and clinical implications. Plast Reconstr Surg. 2010;125:772–82. doi: 10.1097/PRS.0b013e3181cb63e0. [DOI] [PubMed] [Google Scholar]
- 31.Wong C, Saint-Cyr M, Arbique G, et al. Three- and four-dimensional computed tomography angiographic studies of commonly used abdominal flaps in breast reconstruction. Plast Reconstr Surg. 2009;124:18–27. doi: 10.1097/PRS.0b013e3181aa0db8. [DOI] [PubMed] [Google Scholar]


