

Abstract
Two genes are called synthetic lethal (SL) if their simultaneous mutations lead to cell death, but each individual mutation does not. Targeting SL partners of mutated cancer genes can kill cancer cells specifically, but leave normal cells intact. We present an integrated approach to uncovering SL pairs in colorectal cancer (CRC). Screening verified SL pairs using microarray gene expression data of cancerous and normal tissues, we first identified potential functionally relevant (simultaneously differentially expressed) gene pairs. From the top-ranked pairs, ~ 20 genes were chosen for immunohistochemistry (IHC) staining in 171 CRC patients. To find novel SL pairs, all 169 combined pairs from the individual IHC were synergistically correlated to five clinicopathological features, e.g. overall survival. Of the 11 predicted SL pairs, MSH2-POLB and CSNK1E-MYC were consistent with literature, and we validated the top two pairs, CSNK1E-TP53 and CTNNB1-TP53 using RNAi knockdown and small molecule inhibitors of CSNK1E in isogenic HCT-116 and RKO cells. Furthermore, synthetic lethality of CSNK1E and TP53 was verified in mouse model. Importantly, multivariate analysis revealed that CSNK1E-P53, CTNNB1-P53, MSH2-RB1, and BRCA1-WNT5A were independent prognosis markers from stage, with CSNK1E-P53 applicable to early-stage and the remaining three throughout all stages. Our findings suggest that CSNK1E is a promising target for TP53-mutant CRC patients which constitute ~ 40% to 50% of patients, while to date safety regarding inhibition of TP53 is controversial. Thus the integrated approach is useful in finding novel SL pairs for cancer therapeutics, and it is readily accessible and applicable to other cancers.
Abbreviations: CRC, colorectal cancer; IHC, immunohistochemistry; FDR, false discovery rate; TD, tumor-dependent; SL, synthetic lethal
Introduction
Colorectal cancer (CRC) is the third most common cancer worldwide with nearly 1 million annual incidences and 400,000 yearly deaths [1]. Multiple genes are mutated during tumorigenesis, with those contributing to tumor formation and growth being called cancer genes [2], which can be categorized into oncogenes, tumor suppressor genes and stability genes. Mutant oncogene and tumor suppressor gene frequently implicated in colorectal cancer are CTNNB1 and TP53, respectively, and are involved in cancer cell proliferation, while stability genes such as MSH2 are responsible for the safeguarding of genomic integrity. Although to date some therapeutics directed against oncogenes have led to increases in patient survival, many fail due to intrinsic or adaptive resistance of cancer cells to the therapeutics. For example, when CRC patients are treated with cetuximab (EGFR inhibitor), resistance arise due to crosstalk between Src family kinases and EGFR [3].
Two genes are called synthetic lethal (a type of genetic interaction [4]) when their simultaneous mutations lead to cell death, while each single mutation does not. Genome-scale mappings of SLs in S. cerevisiae were obtained through high-throughput synthetic genetic array analyses [5], [6], [7]. Wong and colleagues successfully predicted synthetic sick or lethal (SSL) interactions in S. cerevisiae by integrating multiple types of data, e.g., gene expression, protein-protein interaction and properties of network topology of gene triples [8]. About 80% of SSL interactions therein were discovered successfully via validating < 20% of the predicted interactions. In C. elegans, Zhong and Steinberg [9] computationally integrated interactome, gene expression and phenotype data to predict genome-wide genetic interactions; they further experimentally verified the predictions for two human disease-associated genes.
The concept of synthetic lethality can be applied to exploit cancer-cell specific mutations for cancer therapeutics [10]. Targeting synthetic lethal (SL) partners of mutated cancer genes will specifically kill cancer cells bearing the mutations but spare normal cells. Therefore, synthetic lethality strategy offers an elegant alternative for non-druggable mutant tumor suppressor genes and difficult-to-target-directly oncogenes, such as TP53 and KRAS, respectively, by targeting their SL partners. Lately, pioneering studies of SL partners in BRCA1 and BRCA2-deficient cancer cells identified PARP1 as a promising drug target [11], [12]. The clinical relevance of synthetic lethality has been rapidly recognized. Multiple phase II and III clinical trials of PARP inhibitors were conducted for breast and ovarian cancer patients with BRCA1 or BRCA2 mutation [13], [14].Over the last few years, genes having SL interactions (SLs) in cancers have been actively studied using individual RNAi experiments, or by large scale RNAi screenings that uncover multiple SL gene pairs [15], [16], [17], which in general were centered on one gene. Astsaturov and colleagues identified SLs in human by combining both computational and experimental approaches [18].They first combined pathway maps, protein-protein interactions, gene expression data and human orthologs of Drosophila Egfr genetic interaction partners, to predict 2689 SL candidates of EGFR. They then selected 683 candidates for RNAi screening, by their appearance in at least two of these information sources or by prior biological knowledge, which resulted in 61 SLs. Wang and Simon [19] developed a promising computational approach to prefilering p53 SL genes before RNAi screening. They analyzed five gene expression datasets from NCI-60 panel, The Cancer Genome Atlas and Cancer Cell Line Encyclopedia. Kinase-encoding genes highly expressed in functional p53-mutant samples versus samples without functional p53 mutation were first identified, and were further prioritized by inferred significant networks, functional annotation and drug sensitivity analysis.
To augment these RNAi-based experimental methods, we have developed a cost-effective approach, which integrates computational and experimental methods to uncover SL gene pairs for colorectal cancer (CRC). Our approach incorporates SL pairs in literature, microarray gene expression data, protein expression (immunohistochemistry [IHC] of CRC tissues) and phenotypic (clinicopathological factors) data. Let A-B denote a gene (protein) pair of A and B henceforth. Screening across 600 + previously verified SL pairs using microarray gene expression data of cancerous and normal tissues (a pilot study), we found that some SL gene pairs, such as BRCA1-PARP1 and TP53-SGK2, were simultaneously differentially expressed in high percentages in several cancerous tissues including CRC. Studies in S. cerevisiae and C. elegans have also shown that co-expression of gene pairs may be a relevant feature for predicting genetic interactions genome-wide [6], [8], [9]. Therefore, these verified SL pairs with differential gene expression patterns were classified as initial candidate tumor-dependent (TD) gene pairs (Table 1), from which we selected 17 genes to conduct IHC staining at multiple cellular locations. Next, to find novel SL pairs, we combined all possible pairs from the ~ 20 individual IHCs giving a total of 169 protein pairs. Because protein pairs related to tumor cell viability and malignancy may be indicated by their correlation with clinicopathological features obtained from CRC patients, we then tested each of these protein pairs for synergistic correlation with clinical features of the same set of patients to identify TD pairs, which are our predicted SL pairs. The cancer phenotypes observed (e.g., overall survival) suggested that the tumor cells may depend on each protein pair for viability and, therefore, simultaneously mutating each TD pair may kill tumor cells. RNAi, small-molecule inhibitor and in vivo experiments were then performed to validate the top two predicted SL partners of TP53, which is involved in multiple pathways, leading to challenges in therapeutic development. A graphical illustration of our approach is presented in Supplementary Figure W1. Finally, we identified protein pairs whose abnormal IHCs were correlated with poor patient survival, and analyzed the IHCs of the 169 protein pairs and clinicopathological features to find independent prognostic markers of CRC patients.
Table 1.
Initial panel of candidate TD pairs for CRC, showing the percentages of the four gene expression patterns.
| TD pairs |
Percentages of gene pairs from 70 Asian CRC versus 12 non-cancerous tissues that were expressed 2-fold or more |
||||||
|---|---|---|---|---|---|---|---|
| Gene 1 | Gene 2 | (up, up) pattern | (up, down) pattern | (down, up) pattern | (down, down) pattern | Permutation P value* | FDR† |
| FEN1 | RAD54B | 0.67‡ | 0.00 | 0.00 | 0.00 | 0.0001 | 1×10- 5 |
| BRCA2 | PARP1 | 0.34 | 0.00 | 0.00 | 0.00 | 0.0001 | 1×10- 5 |
| MSH2 | POLB | 0.33 | 0.00 | 0.00 | 0.00 | 0.0001 | 1×10- 5 |
| BRCA1 | PARP1 | 0.26 | 0.00 | 0.00 | 0.00 | 0.0001 | 1×10- 5 |
| MYC | AURKB | 0.17 | 0.00 | 0.00 | 0.00 | 0.0001 | 1×10- 5 |
| RB1 | SKP2 | 0.06 | 0.00 | 0.00 | 0.00 | 0.0002 | 2×10- 5 |
| CSNK1E | CTNNB1 | 0.03 | 0.00 | 0.00 | 0.00 | 0.0001 | 1×10- 5 |
| BCR | WNT5A | 0.03 | 0.01 | 0.00 | 0.00 | 0.0001 | 1×10- 5 |
| KRAS | SLKRAS§ | 0.01 | 0.00 | 0.00 | 0.00 | 0.0001 ~ 0.7200 | 1×10- 5 ~ 0.0303 |
| TP53 | SGK2 | 0.00 | 0.33 | 0.00 | 0.20 | 0.0004 | 3×10- 5 |
| KRAS | SLKRAS¶ | 0.00 | 0.01 | 0.00 | 0.00 | 0.0001 ~ 0.8540 | 1×10- 5 ~ 0.0351 |
| PTEN | PARP1 | 0.00 | 0.00 | 0.01 | 0.00 | 0.0001 | 1×10- 5 |
| ABL1 | WNT5A | 0.00 | 0.00 | 0.01 | 0.00 | 0.0043 | 0.0003 |
This P value was for the highest percentage of the four patterns computed by permutation test with 10,000 repeats.
FDR was estimated by q-value.
The four fractions are computed from gene pairs that were 2-fold differentially expressed, thus they might not sum up to 100%.
57 verified KRAS SL pairs were identified in the (up, up) pattern.
19 verified KRAS SL pairs were identified in the (up, down) pattern.
Materials and Methods
Computation of Gene Expression Profiles of Colorectal Cancer Versus Non-Cancerous Tissues
We filtered gene expression data sets according to the following parameters: both cancer and non-cancerous tissues, no treatments, no metastasis and affymetrix chips (up to Nov. 2010). The CRC gene profiles satisfying the above criteria were downloaded from the Gene Expression Omnibus database [20]. Because mutated genes involved in the oncogenesis of a given cancer are known to vary between patients of different ethnic backgrounds [21], we collected gene expression data from patients of Han Chinese origin (GSE 9348 in [22]), the same ethnic background as the IHC and clinicopathological data used in later sections. Gene expression profiles from all 70 colorectal cancer and 12 non-cancerous tissues in the dataset were first quantile-normalized (expresso in R), then for a given gene the log ratio of its expression in each cancer tissue versus that of the averaged non-cancerous tissues was computed. The dataset used is shown in Supplementary Dataset S1.
Inferring the Initial Panel of TD Gene Pairs for Colorectal Cancer Using Microarray Gene Expression Data
We first collected 663 gene pairs whose SL interactions were either validated using various human cancer cell lines [11], [23] or genome-wide RNAi knockdown [15], [16] (Supplementary Table W1). For each SL pair collected, the percentages of tissues in which both genes were (up, up), (up, down), (down, up), or (down, down) were computed, respectively. Next, the top-ranking 11 gene pairs and several KRAS pairs were selected to make up the panel of initial candidate TD pairs for CRC.
Permutation Test and False-Positive Rates of the Percentages of Paired Gene Expression in Table 1
To assess the statistical significance (P value) of the percentages of the (up, up) or (up, down) patterns of each gene pair in Table 1, for each percentage we performed a permutation test to generate its nonparametric distribution. The total rearrangements of the labels of (70) cancer and (12) non-cancerous tissues was equal to , from which we randomly chose 10,000 rearrangements. For each rearrangement we computed the percentage of a pair’s pattern to form its distribution, from which we assessed the significance of an observed percentage. Next, we applied q-value (qvalue in R; [24]) to estimate false discovery rate (FDR) of the significance of the gene pairs and the predicted SL pairs in Table 1, Table 3, respectively.
Table 3.
The 11 predicted SL pairs which had synergistic effects when correlated with clinicopathological features.
| Protein 1 | Protein 2 |
P value |
FDR* | Log-rank (P value) | ||
|---|---|---|---|---|---|---|
| Protein 1 | Protein 2 | Protein pairs | ||||
| A. Overall survival | ||||||
| CSNK1E | P53 | 0.065 | 0.120 | 0.015 | 0.467 | 0.005 |
| CTNNB1 | P53 | 0.346 | 0.120 | 0.025 | 0.467 | 0.018 |
| CSNK1E | MYC | 0.065 | 0.369 | 0.027 | 0.467 | 0.064 |
| ABL1 | CSNK1E | 0.169 | 0.065 | 0.033 | 0.467 | 0.066 |
| AURKB | CSNK1E | 0.524 | 0.065 | 0.050 | 0.467 | 0.066 |
| B. Tumor size | ||||||
| MSH2(N) | POLB | 0.069 | 0.123 | 0.001 | 0.168 | N/A† |
| BRCA1 | POLB | 0.123 | 0.123 | 0.022 | 0.865 | N/A |
| CSNK1E | POLB | 0.115 | 0.123 | 0.045 | 0.865 | N/A |
| C. Metastasis | ||||||
| MSH2(C) | RB1 | 0.255 | 0.698 | 0.001 | 0.179 | N/A |
| BRCA2 | MSH2(C) | 0.400 | 0.255 | 0.048 | 0.989 | N/A |
| D. Lymph node metastasis | ||||||
| BRCA1 | CSNK1E | 0.127 | 0.268 | 0.049 | 1.000 | N/A |
FDR was estimated by q-value.
N/A denotes not applicable.
Preparation of Tissue Microarrays
One hundred seventy-one representative cancer specimens (Supplementary Table W2) were randomly chosen from hematoxylin and eosin–stained sections and confirmed by pathologists. Four tissue cores (2 mm in diameter) were obtained from each paraffin block from which three cores of cancerous and one core of noncancerous tissues were cut longitudinally. The tissue cores were set into new paraffin blocks using a fine steel needle to produce tissue microarrays. This study was approved by the institutional review board and ethics committee of Changhua Christian Hospital and the institutional review board of Academia Sinica.
Immunohistochemistry
The sections (4 μm) of tissue microarray were deparaffinized in xylene and hydrated in serial dilutions of alcohol. Endogenous peroxidase activity was quenched by 3% H2O2. The sections were performed by treatment with boiling citrate buffer (10 mmol/L) for 20 minutes for antigen retrieval. The tissues were then incubated with 17 primary antibodies (Supplementary Table W3). Incubation with the primary antibody was carried out for 30 minutes at room temperature, followed by rinsing three-times with phosphate-buffered saline. The slides were incubated with a horseradish peroxidase/Fab polymer conjugate (EnVision™ Detection systems Peroxidase/DAB, Rabbit/Mouse [K5007 HRP; DaKo]) for another 30 minutes. After rinsing, the chromogen was developed with 3,3′-diamino-benzidine tetrahydrochloride as the substrate and hematoxylin as the counterstain. The staining intensity in the cancerous tissue was examined by two pathologists (Kun-Tu Yeh and Tzu-Cheng Su). The scoring criteria were similar to those in [25]. Specifically, the stain intensity was graded as negative-0, indeterminate-±, weak positive-1 +, moderate positive-2 + or strong positive-3 +. For staining intensity negative-0, there is no expression of the detected protein; for indeterminate-±, the staining is weak and its percentage cannot be accurately counted; for weak positive-1 +, there is less than 5% expression of the detected protein in the cancer cells; for moderate positive-2 +, there is focal expression in 5% to 20% of the cancer cells; for moderate positive-3 +, there is diffuse expression over 20% of the cancer cells. The staining intensity in the cancerous tissue was categorized as overexpression or underexpression through comparison with noncancerous colonic mucosa.
Fisher’s Exact Test
Fisher’s exact test was conducted to determine independence between IHC expression levels of each predicted SL pair and clinic-pathological features. IHC expression levels of each protein were dichotomized into two classes, abnormal and normal, according to the criteria in Table 2. Further, clinical factors of 171 CRC patients were also dichotomized as follows; survival time < 3 years versus ≥ 3 years; tumor size > mean versus tumor size ≤ mean; tumor grade poorly-differentiated cells versus well and moderately differentiated cells; metastasis yes versus no; lymph node metastasis N1-2 versus N0; and stage III and IV versus I and II.
Table 2.
List of IHC-stained proteins and the percentages of 171 patients with abnormal IHC.
| No. | Protein name | Criterion of abnormality | % of patients |
|---|---|---|---|
| 1 | ABL1(C)* | ≥ 2 + | 56 |
| 2 | AURKB(C) | ≥ 1 + | 94 |
| 3 | BCR(C) | ≥ 2 + | 28 |
| 4 | BRCA1(C) | < 1 + | 28 |
| 5 | BRCA2(C) | < 2 + | 32 |
| 6 | BRCA2(N)* | < 1 + | 34 |
| 7 | CSNK1E(C) | < 2 + | 54 |
| 8 | CTNNB1(N) | ≥ 1 + | 44 |
| 9 | MSH2(C) | < 1 + | 8 |
| 10 | MSH2(N) | < 1 + | 28 |
| 11 | MYC(N) | ≥ 2 + | 83 |
| 12 | P53(N) | ≥ 1 + | 78 |
| 13 | PARP1(N) | ≥ 1 + | 87 |
| 14 | POLB(N) | ≥ 1 + | 66 |
| 15 | RAD54B(N) | ≥ 1 + | 82 |
| 16 | RB1(N) | < 1 + | 24 |
| 17 | SGK2(C) | < 2 + | 73 |
| 18 | SKP2(C) | ≥ 2 + | 23 |
| 19 | WNT5A(C) | ≥ 1 + | 60 |
The notation (C) and (N) represent cytoplasm and nucleus, respectively.
Cell Culture
HCT-116 cell was obtained from ATCC; RKO, and TP53−/− derivatives of HCT116 and RKO were obtained from GRCF Cell Center and Biorepository of John Hopkins University. HCT-116 cells were cultured in DMEM, and RKO cells were cultured in McCoy 5A, all supplemented with 10% FBS and antibiotics (Invitrogen). Cells were seeded at density of 105/ml one day prior to shRNA transfection, lentivirus infection and small-molecule inhibitor treatment.
RNAi Knockdown and Small-Molecule Inhibitor Experiment
Plasmids each harboring gene-specific or scrambled shRNA were ordered from the RNAi core, Genomics Research Center, Academia Sinica. shRNAs were transiently transfected into isogenic HCT-116 cells using Lipofectamine-2000 (Invitrogen) following the manufacturer’s protocol, harvested for MTT assay and RT-PCR 48 hours post-transfection. Isogenic RKO cells were infected with lentiviruses harboring the shRNAs and harvested 4 days after puromycin selection. Cells were treated with IC261 and D4476 (Sigma) (HCT116 and RKO), and 2,4-Diamino-Quinazoline (Sigma) (HCT-116) at indicated concentrations. Cells were harvested for MTT assay 48 hours after treatment. For The TRC IDs corresponding to the shRNA sequences used please see Supplementary Materials and Methods.
Real-Time PCR
Real Time PCR was performed using Roche UPL Real Time-PCR System (Roche) according to manufacturer’s protocol; mRNA levels were measured using the ΔΔCT method, with beta-actin as internal control for each sample. For primer sequences and corresponding UPL probes used please see Supplementary Materials and Methods.
MTT Assay
MTT assay was performed using manufacturer’s protocol (Invitrogen).
Mouse Model Experiment
Animal care in accordance with institutional guidelines and authority to perform in vivo work was granted by the Home Office (China Medical University). 2 x10⁶ HCT-116 cells (TP53WT and TP53-/-) were injected subcutaneously into both flanks of groups of five 6- to 7-week old NOD.CB17-Prkdcscid/JNarl male mice purchased from the National Laboratory Animal Center, Taiwan and treated for eight consecutive days with either IC261 (20.5 mg/kg, dissolved in 5% Kolliphor®EL (Sigma), 5% DMSO, and 90% PBS) or DMSO 10 days after cell inoculation. Tumor volumes were measured every day and calculated as tumor width × tumor length × tumor height. Significance of the difference in tumor volume was tested as described in Supplementary Text S1.
Mantel-Haenszel Log-Rank Test
For each predicted SL pair, we generated Kaplan-Meier survival curves of the high and low risk groups of patients using the software R, where the high and low risk groups comprise patients whose paired IHC expression levels were both abnormal and others, respectively. The log-rank test was used to calculate the significance of the differences between the survival curves of the two groups.
Cox Proportional Hazard Regression
For each predicted SL pair and clinicopathological feature, we computed a P value based on univariate Cox regression model using global permutation test, which permuted survival time and censor status simultaneously. We then included IHC of CSNK1E-P53, CTNNB1-P53, MSH2(C)-RB1 and BRCA1-WNT5A, which were significantly correlated with survival, four clinicopathological features, and statuses of chemotherapy treatment and radiation oncology treatment as covariates to conduct a multivariate Cox regression by stepwise variable selection (using the software R).
Results
Initial Panel of Candidate Tumor-Dependent Gene Pairs for Colorectal Cancer
To understand the role that SL pairs play in cancer cells, we first investigated the gene expression patterns of the known SL pairs collected. The more closely functionally related a SL pair is, more frequently the genes may be simultaneously differentially expressed in cancer cells. We gathered a list of 663 pairs of SL gene pairs verified in various cancer cell lines; most of the SLs were validated by genome-wide RNAi screenings [15], [16], while the remaining SLs were verified via individual RNAi knockdown experiments using cancer cell lines [11], [23], most of which were conducted based on hypothesis generated from pathway information and/or conservation of SLs from other species.
Validated SL pairs comprise oncogenes, tumor-suppressor genes, stability genes [2] and others. In general, tumor cells depend on the overexpression of oncogenes and/or under-expression of tumor suppressor genes for survival or/and proliferation. Therefore, for each SL pair we looked for the simultaneously up-regulated pattern (abbreviated as the [up, up]) one up-regulated and one down-regulated patterns ([up, down] and [down, up]) and the simultaneously down-regulated pattern ([down, down]), where the cutoff of up- and down-regulation were 1 and -1 in log2 ratio of gene expression of cancer versus non-cancerous tissues, respectively. Specifically we computed the percentages of the aforementioned four patterns of the collected SL gene pairs using the log ratios of gene expression (see Materials and Methods). To include as many potential TD pairs as possible, we first included the gene pairs whose percentages of any of the four patterns were at least one percent. Because RNAi knockdown is easier than overexpression of a particular gene, we sorted the gene pairs by the percentages of the (up, up), (up, down), (down, up), and then (down, down) patterns to result in Table 1, which included genes highly mutated in CRC such as TP53 [26] (see Materials and Methods).
Although the over-expression of tumor-suppressor and stability gene pairs, e.g., DNA repair and checkpoint classes, in Table 1 seems surprising at first glance, it is consistent with the drastic increase in genomic instability and DNA replication caused by mutant oncogenes such as KRAS and MYC.
Correlating IHC Stainings of TD Pairs With Clinicopathological Features Identifies SL Pairs
We first filtered out FEN1, KRAS and PTEN from the candidates in Table 1 resulting in 17 genes for IHC staining. FEN1 was not chosen because no isogenic FEN1 mutant CRC cell line is available. KRAS and PTEN were omitted because we aimed to uncover novel SL pairs, and multiple SL targets of KRAS and PTEN have been identified through genome-wide RNAi screening [15], [16] and small-molecule library screening, respectively [27]. IHCs of these remaining 17 proteins at multiple cellular locations were conducted (Table 2, Supplementary Figure W2) to confirm the trends of their mRNA expression using CRC tissues dissected from 171 patients from Changhua Christian Hospital, Changhua City, Taiwan (Supplementary Table W2, see Materials and Methods).
To extend the analysis beyond the protein pairs listed in Table 1, we then considered all possible pairs (169 pairs) of proteins, from the 19 candidates in Table 2 (excluding the pairs of the same protein stained in different cellular locations). Note that this procedure allows novel SL pairs to be included in this study, which is essential for uncovering novel SL pairs. To see how the TD pairs were related to the phenotypes of CRC, we correlated IHCs of each of these 169 protein pairs with five clinicopathological features of the patients: overall survival, tumor size, histological grade, lymph node metastasis, and metastasis. Please note for simplicity, henceforth we have omitted the location attached to the protein name, e.g., CSNK1E(C) is written as CSNK1E, unless ambiguity arises.
A pair of proteins is called to have a synergistic effect if their paired abnormal IHCs are significantly correlated (P < 0.05; Fisher’s exact test) with a clinicopathological feature (e.g., overall survival), but the abnormal IHC of each single protein is not. Any protein pair passing this synergy screening was predicted to be SLs, because this synergistic effect implies that abnormal IHCs of a protein pair is associated with a cancer phenotype (e.g., a poor overall survival), but the abnormal IHC of each individual protein is not. In other words, CRC cells seem to depend on each of these protein pairs, but not each individual protein, for maintenance of viability. Thus, simultaneous mutation of each TD pair may eliminate the tumor cells, which is synthetic lethality. Note that in model organisms [6], [8], [9], coexpression and phenotype have been shown to be useful in predicting SL interactions. However, the proposed synergistic effect is novel in (1) prioritizing the gene pairs co-expressed in cancer cells and (2) correlating their IHC expression to clinicopathological features (served as phenotypes) of CRC patients.
Correlating the paired and individual IHCs of 169 protein pairs to each of the five clinicopathological features resulted in 11 predicted SL pairs (Table 3); Fisher’s exact test (see Materials and Methods) was applied to test the significance of the correlation (P < 0.05), and the false discovery rate of a test was estimated by the q-value (qvalue in R), which measured the proportion of false positives incurred when the test was claimed significant (those with P < 0.05) [24]. The complete results are shown in Supplementary Table W4.
We first checked the 11 predicted SL pairs (Table 3) against the literature (searched up to February 2014). Out of these predicted SL pairs, two pairs MSH2-POLB and CSNK1E-MYC are known SL pairs, and have been validated in cell lines [28] and via large scale RNAi screening [17], respectively. The gene expression of CSNK1E was shown to be associated with that of MYC in colon cancer. Because CSNK1E was implicated in cancer only recently [17], these findings demonstrate that our method is able to uncover SL gene pairs without being limited by pathway information or without prior knowledge of whether a target gene is involved in cancer.
Table 3 shows that correlating IHCs of the protein pairs to overall survival resulted in the largest number of predicted SL pairs, and included P53. Note that TP53 has a very large sequence mutation score in CRC (Table 3 in [26]) and is mutant in about half of all cancers. Further, the fact that CSNK1E-MYC ranked third in Table 3A was a verified SL pair suggested that the top-two pairs in Table 3A, CSNK1E-P53 and CTNNB1-TP53 may be novel SL pairs; we validated these using RNAi, small-molecule inhibitor and mouse model as follows.
A rule of thumb for prioritizing predicted SL pairs for validation: first, incorporating prior knowledge, e.g., known SL pairs or/and pathway information. Second, using biological importance, e.g., those having frequently mutated cancer genes in the cancer of interest will be on top of the list.
CSNK1E and CTNNB1 are Validated as SL to TP53 by RNAi Knockdown (CTNNB1 with TP53), Small-Molecule Inhibition and In Vivo Model (CSN1KE with TP53)
We selected two pairs of isogenic CRC cell lines, HCT-116 and RKO, varying only in TP53 status (TP53WT and TP53-/-), as in vitro models to validate that TP53- CSNK1E and TP53-CTNNB1 are SL pairs. We transiently transfected HCT-116 cells and infected RKO cells with lentiviruses with shRNAs targeting CSNK1E (CSNK1E-1 and CSNK1E-2) and CTNNB1 (CTNNB1-1 and CTNNB1-2). Knockdown of each gene markedly reduced the viability of TP53−/− cells as compared to TP53WT cells (Figure 1A-D, for details please see Supplementary Text S2). This result further implies that the proposed approach is suitable for the effective prediction of SL gene pairs. The other predicted SL pairs shown in Table 3 are also promising and could be validated in the future.
Figure 1.
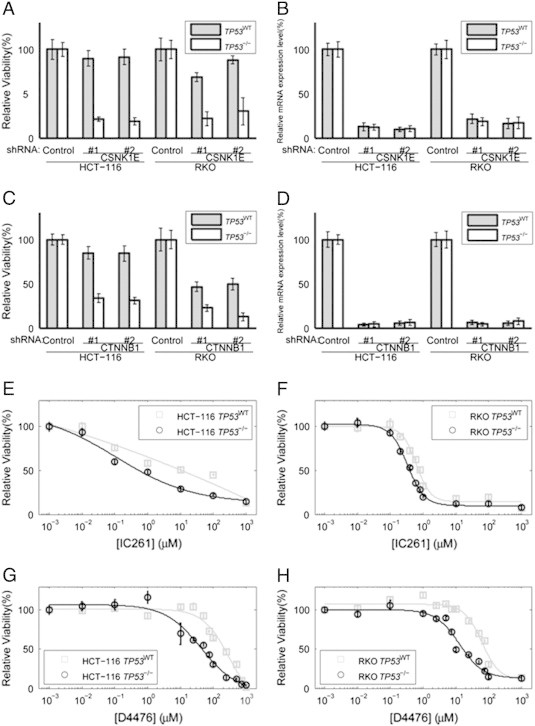
RNAi knockdown of CSNK1E (A and B) and CTNNB1 (C and D) selectively killed TP53−/− cells. Cell viability was measured by MTT assay. Relative mRNA expression level was measured using the comparative CT (ΔΔCT) method; beta-actin mRNA was used as an internal control. Relative viability of HCT-116 and RKO cells (TP53WT and TP53-/-) transfected with (A) CSNK1E-targeting shRNAs (#1 and #2) or (C) CTNNB1-targeting shRNAs (#1 and #2), and control shRNA. Relative mRNA level of (B) CSNK1E following transfection of CSNK1E-targeting shRNAs (#1 and #2) or (D) CTNNB1 following transfection of CTNNB1-targeting shRNAs (#1 and #2), and control shRNA. Relative viability of cells (TP53WT and TP53-/-) following treatment with IC261 in (E) HCT-116 and (F) RKO. Relative viability of cells (TP53WT and TP53-/-) following treatment with D4476 in (G) HCT-116 and (H) RKO.
To evaluate the specificity and efficacy of small-molecule inhibitors of CSNK1E and CTNNB1 in killing TP53−/− cells, we treated the aforementioned cell lines with inhibitors of CSNK1E, IC261 and D4476 (Figure 1E-H). Upon treatment with IC261, we observed a reduction in cell viability in TP53−/− HCT-116 cells (IC50 of 1.37 μmol/L as compared to 8.30 μmol/L, which was about 6-fold higher); in RKO cells, about 1.8-fold difference in IC50 was observed (0.62 μmol/L as compared to 0.34 μmol/L; Figure 1E and F). Treatment with D4476 yielded similar fold changes of IC50 of TP53WT cells and TP53−/− cells (about 4.7-fold) in both cell lines (250.72 μmol/L as compared to 53.22 μmol/L for HCT116 cells, 60.79 μmol/L as compared to 12.76 μmol/L for RKO cells; Figure 1G and H). However, treatment of 2,4-Diamino-Quinazoline (inhibitor of CTNNB1) in HCT-116 cells did not exhibit selective toxicity against TP53−/− cells (IC50 of 995 μmol/L and 821 μmol/L for TP53WT cells and TP53−/− cells, respectively). We wonder whether this is due to the non-specific targeting of 2.4-Diamino-Quinazoline, which targets the CTNNB1/TCF complex. Since IC261 and D4476 were shown to inhibit microtubule polymerization [29] and ALK5 (transforming growth factor beta1 type I receptor) [30], respectively, the use of these compounds to asses the physiological role of CSNK1E needs to be cautiously interpreted.
We further evaluated the efficacy of IC261 in an in vivo preclinical model. TP5WT (TP53-/-) HCT-116 cells were injected subcutaneously into the right (left) flank of groups of five NOD/SCID mice and allowed to grow for 10 days (tumor volumes ranged from 12.50 mm3 to 41.72 mm3 and 13.02 mm3 to 48.19 mm3 for TP53WT and TP53−/− tumor xenografts on the 10th day, respectively). Subjects were then treated for nine consecutive days with either IC261 or DMSO before sacrifice. Tumor volumes were recorded daily after the start of the treatment.
At the end of experiment, tumor volumes ranged from 165.60 mm3 to 487.20 mm3 and 195.86 mm3 to 725.91 mm3 for DMSO-treated TP53WT and TP53−/− tumor xenografts, respectively. For IC261-treated mice, tumor volumes ranging from 50.82 mm3 to 250.88 mm3 and 25.67 mm3 to 342.90 mm3 were observed for TP53WT and TP53−/− tumor xenografts, respectively.
For each day, the tumor volumes of five TP53WT xenografts were adjusted to their mean of the same day. Two sample t-test was conducted using TP53−/− xenograft tumor volumes under treatment IC261 versus DMSO, calibrated according to the volumes of their TP53WT counterparts, to test the hypothesis that tumor volumes of IC261-treated TP53−/− xenografts were less than their DMSO-treated counterpart based on the definition of synthetic lethality. Calibrated TP53−/− xenograft tumor volumes were 490.93 mm3 ± 323.35 mm3 and 138.03 mm3 ± 79.56mm3, for DMSO-treated and IC261-treated samples, respectively (for details, please see Supplementary Text S1).
Consistent with our in vitro data, IC261-treated HCT-116 TP53−/− tumor (n = 5) in NOD/SCID mice showed markedly reduced tumor formation (Figure 2) as compared to the corresponding treatment with DMSO (n = 5), with the last three tumor volume differences of about 2.0-, 2.4- and 3.6-fold, respectively (P value = 0.033, 0.045, 0.023, for the last three days, respectively; two-sample t-test). Additionally, our preventive model, by pre-treating TP53−/− cells with DMSO and IC261 before cell inoculation, also showed selective inhibition of TP53−/− tumor growth by IC261 (Supplementary Materials and Methods and Supplementary Figure W3).
Figure 2.
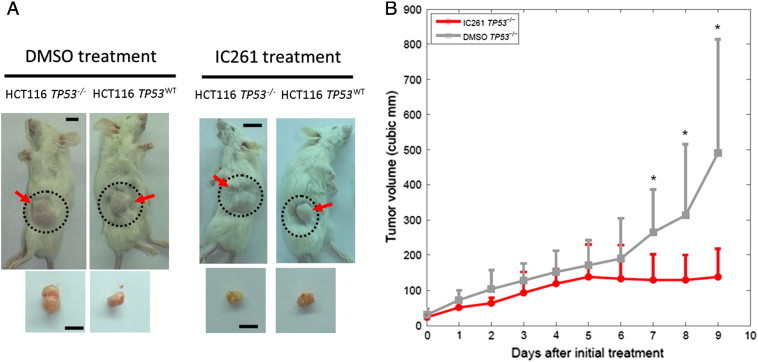
IC261 treatment inhibited TP53−/− tumor growth in vivo. (A) Representative images of xenografts obtained with HCT-116 cells (image for each treatment was the same mouse) in NOD/SCID mice after treatment with either DMSO or IC261. (B) Mean tumor size over the treatment regimen with IC261 and DMSO control (n = 5 for each group, error bars indicate standard error, the notation * indicates P < 0.05).
CSNK1E-P53, CTNNB1-P53, MSH2(C)-RB1 and BRCA1-WNT5A are Correlated with Poor Prognosis
Prognosis provides patients with information to make decisions about adopting further treatments, thus it is important in clinical medicine. The results of the log-rank test in Supplementary Table W4A suggested that of the 171 CRC patients, those with abnormal IHCs of CSNK1E-P53, CTNNB1-P53, MSH2-RB1 or BRCA1-WNT5A had a significantly different survival curve than that of patients in the remaining subgroup (P = 0.005, 0.018, 0.002 and 0.041, respectively; Mantel-Haenszel log-rank test; see Materials and Methods).
Kaplan-Meier survival analysis was performed, and the estimated survival curves of patients with abnormal IHCs for each of these four pairs was indeed separated from that of the remaining subgroup (Figure 3). Interestingly, none of individual IHC of CSNK1E, P53, CTNNB1, MSH2(C), RB1, BRCA1 or WNT5A could separate the estimated survival curves of patients into two subgroups (P = 0.067, 0.119, 0.536, 0.338, 0.374, 0.118 and 0.510, respectively; log-rank test; Supplementary Figure W4).
Figure 3.
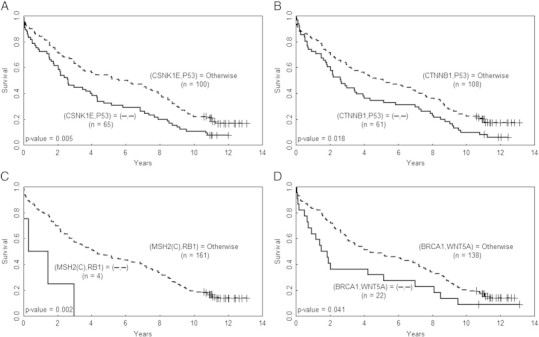
Abnormal IHCs of the four protein pairs are correlated with poor prognosis Kaplan-Meier survival curves of CRC patients divided by the paired IHCs of (A) CSNK1E and P53, (B) CTNNB1and P53, (C) MSH2(C) and RB1, and (D) BRCA1 and WNT5A. The curves for the patients with paired abnormal IHCs are plotted in solid line and the curves of the remaining patients are plotted in dashed line; the symbol “-” denotes abnormal IHC of the corresponding protein.
CSNK1E-P53, CTNNB1-P53, MSH2(C)-RB1, BRCA1-WNT5A are Independent Prognosis Markers from Stage for CRC Patient Survival
Potential prognostic markers can be identified from gene, microRNA or protein expression data [31], [32], [33], [34]. We further investigated which IHC of the 169 protein pairs were correlated with CRC patient survival, because no IHC of any individual protein was significantly correlated with overall survival. A univariate Cox proportional hazard regression analysis, applied to an independent cohort of 171 CRC patients, suggested that IHC of CSNK1E↓-P53↑, MSH2(C)↓-RB1↓, CTNNB↑1-P53↑ and BRCA1↓-WNT5A↑ (the symbols “↑”and “↓”denoting abnormal IHC [overexpression and underexpression, respectively] of the corresponding protein) were relevant prognosis factors with P values equal to 0.006, 0.015, 0.018 and 0.047, respectively [32], [33] (see Materials and Methods); see Supplementary Table W5 for the complete results. Moreover, survival analysis of four clinical factors indicated that stage was correlated with survival (P = 0.034), while age, sex and grade were not (P = 0.289, 0.351, 0.466, respectively).
Subsequently, a multivariate Cox proportional hazard regression analysis, with stepwise variable selection, was applied to IHCs of the aforementioned four protein pairs, the four clinicopathological factors and the statuses of chemotherapy treatment (CT) and radiation treatment (RT) [32], [33]; age, grade, CT and RT statuses were filtered out in the first four steps.
The four protein pairs and stage were found to be significantly associated with patient survival (P = 0.001, 0.007, 0.027, 0.010 and 0.010, respectively; with hazard ratio = 7.53, 1.65, 1.50, 1.93 and 1.58, respectively; Table 4). Another multivariate Cox regression model applied to the five significant factors excluding CTNNB1-P53 resulted in about the same hazard rates for these factors as shown in Table 4 (with minor changes in the first decimal places); the result was similar when CSNK1E-P53 was deleted. Thus, the correlation between these two P53 pairs did not seem to influence the hazard ratio result.
Table 4.
Overall survival of 171 CRC patients in relation to clinical factors and IHC of protein pairs.
| A. Univariate Cox regression | |||
|---|---|---|---|
| Variable | Subset | Hazard ratio (95% CI) | P value |
| Age | age > 65/age < = 65 | 1.19 (0.86-1.66) | 0.289 |
| Gender | male/female | 1.17 (0.84-1.63) | 0.351 |
| Grade | poor/well and moderate | 1.27 (0.67-2.42) | 0.466 |
| Stage | III-IV/I-II | 1.42 (1.03-1.97) | 0.033 |
| (MSH2(C), RB1(N)) | (↓,↓)*/otherwise | 4.34 (1.58-11.95) | 0.015 |
| (CSNK1E(C), P53(N)) | (↓,↑)/otherwise | 1.62 (1.15-2.26) | 0.006 |
| (CTNNB1(N), P53(N)) | (↑,↑)/otherwise | 1.50 (1.07-2.09) | 0.018 |
| (BRCA1(C), WNT5A(C)) | (↓,↑)/otherwise | 1.64 (1.02-2.63) | 0.047 |
| B. Multivariate Cox regression† | |||
| Variable | Subset | Hazard ratio (95% CI) | P value |
| Stage | III-IV/I-II | 1.58 (1.11-2.24) | 0.010 |
| (MSH2(C), RB1(N)) | (↓,↓)*/otherwise | 7.53 (2.25-25.24) | 0.001 |
| (CSNK1E(C), P53(N)) | (↓,↑)/otherwise | 1.65 (1.14-2.38) | 0.007 |
| (CTNNB1(N), P53(N)) | (↑,↑)/otherwise | 1.50 (1.05-2.14) | 0.027 |
| (BRCA1(C), WNT5A(C)) | (↓,↑)/otherwise | 1.93 (1.17-3.19) | 0.010 |
The symbols “↑”and “↓”denote abnormal IHC (overexpression and underexpression, respectively) of the corresponding protein.
Variables were selected by using stepwise selection method.
CSNK1E-P53 is an Early-Stage Prognosis Marker While the Remaining Three Protein Pairs are Markers Throughout the Stages
These four protein pairs and stage are independent prognostic factors, thus the former could serve as markers for CRC patient survival. We further studied whether these four paired markers depended on stage or not as follows. Each pair of IHC, stage and their interaction was fitted by a multivariate Cox regression model, which resulted in CSNK1E-P53 being dependent on stage. Note that this pair is an early-stage prognosis marker (both Stage I-II and Stage I-III) (P = 0.032 and 0.007, n = 86 and 141, respectively; log-rank test). For details, please refer to Supplementary Table W6 and Figure W5.
Discussion
We have developed a cost-effective approach to uncover SL gene pairs for therapeutics of CRC, which predicted SL pairs efficiently via finding synergistic correlation of IHC (protein) pairs with clinicopathological factors (phenotypes) of CRC patients. Of the 11 predicted SL pairs, MSH2-POLB and CSNK1E-MYC were known SL in human, and we further validated CSNK1E-TP53 and CTNNB1-TP53. Our method suggested that clinical factors may be used as phenotypes to predict synthetic lethality. In addition, MSH2-RB1 was previously implied as SL in a mouse study [35]. The study demonstrated that mouse with deficiency in both MSH2 and RB1 showed delayed development of lymphoma, associated with increased apoptosis of lymphoma cells, as compared to MSH2-deficient mice. With rich repertoire of public domain gene expression data (e.g. The Cancer Genome Atlas), commercially available tissue arrays with clinical data, it is conceivable that our approach can be applied to other cancers in the future.
While safety regarding inhibition of TP53 is controversial [36], our validation of CSNK1E as SL to TP53 in vitro (further supported by a previous study in mouse MEF cells [37]) and in vivo showed that this pair may be translated to preclinical study. Note that IC261, the inhibitor of CSNK1E used in both in vitro and in vivo studies also inhibited microtubule polymerization [29], which may lead to increased cancer cell death [38]. However, in our in vivo study the IC261-treated TP53−/− xenograft tumor volumes were calibrated to the volumes of their TP53WT counterparts, which adjusted the effect of microtubule polymerization, and the IC261-treated tumors still shrunk more significantly than the DMSO-treated ones. This suggests that synthetic lethality between TP53 and CSNK1E plays a significant role in killing cancer cells. CSNK1E and CTNNB1 are both known components of WNT signaling pathway. Both activated WNT signaling [39] and TP53 inactivation [40] are frequently implicated in cancer tumorigenesis. Previous study showed that loss of TP53 lead to activation of WNT signaling pathway, mediated through miR-34 [41], suggesting that our result is consistent with current literature regarding synthetic lethality, which arises primarily from compensatory pathways [4], thus implying a buffering relationship between p53 and WNT signaling pathway in CRC. Since TP53 is mutated in half of all cancers, CSNK1E may be a promising druggable target for a broad population of TP53-mutant patients.
CSNK1E↓-P53↑, MSH2(C)↓-RB1↓, CTNNB↑1-P53↑ and BRCA1↓-WNT5A↑ were revealed to be prognosis markers, with the first pair for early-stage and the remaining for all stages, independent from stage for CRC, but interestingly none of ~ 20 individual IHC was correlated with overall survival. Previous studies identified prognostic markers via cellular phenotypes (such as cell differentiation) [42] and protein pairs [43], separately, through insights from pathway information, while our approach identified markers without requiring prior knowledge of molecular mechanism.
Finally, our method can be extended as follows. First, we can pair a gene of interest, preferably a frequently mutated gene in cancers, with the remaining genes in human genome to constitute the initial panel and the remaining procedures follow similarly. Second, this approach can be applied to several cancers to predict their unique/common SL pairs and prognosis markers.
Supplementary Figures
Supplementary Tables
Supplementary Dataset S1
Supplementary Text S1
Supplementary Text S2
Supplementary Materials and Methods
Acknowledgment
This paper is dedicated to the memory of the late Dr. Konan Peck, who kindly let K.-L.T. conduct the biological experiments in his lab for over one year, and whose helpful discussions were greatly appreciated. We thank Tzu-Cheng Su for examining IHC images; Cheng-Wen Wu, Zee-Fen Chang and Bert Vogelstein for CRC cells; Mei-Jung Wang for her technical assistance; Hsuan-Yu Chen and Yi-Chung Chang for helpful discussions. This work was supported by National Science Council of R.O.C. [NSC100-2118-M-001-003-MY2 and NSC102-2314-B-001-005 to G.S.S., NSC102-2320-B-039-039 to J.-G.C.], Taiwan Ministry of Health and Welfare Cancer Research Center for Excellence [MOHW103-TD-B-111-03 to J.-G.C.] and China Medical University Hospital [DMR-103-017 to J.-G.C.].
Footnotes
The authors declare no conflict of interest.
Contributor Information
Jan-Gowth Chang, Email: d6781@mail.cmuh.org.tw.
Grace S. Shieh, Email: gshieh@stat.sinica.edu.tw.
References
- 1.Haggar FA, Boushey RP. Colorectal cancer epidemiology: incidence, mortality, survival, and risk factors. Clin Colon Rectal Surg. 2009;22:191–197. doi: 10.1055/s-0029-1242458. [DOI] [PMC free article] [PubMed] [Google Scholar]
- 2.Vogelstein B, Kinzler KW. Cancer genes and the pathways they control. Nat Med. 2004;10:789–799. doi: 10.1038/nm1087. [DOI] [PubMed] [Google Scholar]
- 3.Wheeler DL, Iida M, Kruser TJ, Nechrebecki MM, Dunn EF, Armstrong EA, Huang S, Harari PM. Epidermal growth factor receptor cooperates with Src family kinases in acquired resistance to cetuximab. Cancer Biol Ther. 2009;8:696–703. doi: 10.4161/cbt.8.8.7903. [DOI] [PMC free article] [PubMed] [Google Scholar]
- 4.Mani R, Onge RPS, Hartman JL, Giaever G, Roth FP. Defining genetic interaction. Proc Natl Acad Sci U S A. 2008;105:3461–3466. doi: 10.1073/pnas.0712255105. [DOI] [PMC free article] [PubMed] [Google Scholar]
- 5.Tong AH, Evangelista M, Parsons AB, Xu H, Bader GD, Page N, Robinson M, Raghibizadeh S, Hogue CW, Bussey H. Systematic genetic analysis with ordered arrays of yeast deletion mutants. Science. 2001;294:2364–2368. doi: 10.1126/science.1065810. [DOI] [PubMed] [Google Scholar]
- 6.Tong AH, Lesage G, Bader GD, Ding H, Xu H, Xin X, Young J, Berriz GF, Brost RL, Chang M. Global mapping of the yeast genetic interaction network. Science. 2004;303:808–813. doi: 10.1126/science.1091317. [DOI] [PubMed] [Google Scholar]
- 7.Costanzo M, Baryshnikova A, Bellay J, Kim Y, Spear ED, Sevier CS, Ding H, Koh JL, Toufighi K, Mostafavi S. The genetic landscape of a cell. Science. 2010;327:425–431. doi: 10.1126/science.1180823. [DOI] [PMC free article] [PubMed] [Google Scholar]
- 8.Wong SL, Zhang LV, Tong AH, Li Z, Goldberg DS, King OD, Lesage G, Vidal M, Andrews B, Bussey H. Combining biological networks to predict genetic interactions. Proc Natl Acad Sci U S A. 2004;101:15682–15687. doi: 10.1073/pnas.0406614101. [DOI] [PMC free article] [PubMed] [Google Scholar]
- 9.Zhong W, Sternberg PW. Genome-wide prediction of C. elegans genetic interactions. Science. 2006;311:1481–1484. doi: 10.1126/science.1123287. [DOI] [PubMed] [Google Scholar]
- 10.Hartwell LH, Szankasi P, Roberts CJ, Murray AW, Friend SH. Integrating genetic approaches into the discovery of anticancer drugs. Science. 1997;278:1064–1068. doi: 10.1126/science.278.5340.1064. [DOI] [PubMed] [Google Scholar]
- 11.Bryant HE, Schultz N, Thomas HD, Parker KM, Flower D, Lopez E, Kyle S, Meuth M, Curtin NJ, Helleday T. Specific killing of BRCA2-deficient tumours with inhibitors of poly(ADP-ribose) polymerase. Nature. 2005;434:913–917. doi: 10.1038/nature03443. [DOI] [PubMed] [Google Scholar]
- 12.Shen Y, Rehman FL, Feng Y, Boshuizen J, Bajrami I, Elliott R, Wang B, Lord CJ, Post LE, Ashworth A. BMN 673, a novel and highly potent PARP1/2 inhibitor for the treatment of human cancers with DNA repair deficiency. Clin Cancer Res. 2013;19:5003–5015. doi: 10.1158/1078-0432.CCR-13-1391. [DOI] [PMC free article] [PubMed] [Google Scholar]
- 13.Sessa C. Update on PARP1 inhibitors in ovarian cancer. Ann Oncol. 2011;22(Suppl. 8):viii72–viii76. doi: 10.1093/annonc/mdr528. [DOI] [PubMed] [Google Scholar]
- 14.Underhill C, Toulmonde M, Bonnefoi H. A review of PARP inhibitors: from bench to bedside. Ann Oncol. 2011;22:268–279. doi: 10.1093/annonc/mdq322. [DOI] [PubMed] [Google Scholar]
- 15.Barbie DA, Tamayo P, Boehm JS, Kim SY, Moody SE, Dunn IF, Schinzel AC, Sandy P, Meylan E, Scholl C. Systematic RNA interference reveals that oncogenic KRAS-driven cancers require TBK1. Nature. 2009;462:108–122. doi: 10.1038/nature08460. [DOI] [PMC free article] [PubMed] [Google Scholar]
- 16.Luo J, Emanuele MJ, Li DN, Creighton CJ, Schlabach MR, Westbrook TF, Wong KK, Elledge SJ. A Genome-wide RNAi Screen Identifies Multiple Synthetic Lethal Interactions with the Ras Oncogene. Cell. 2009;137:835–848. doi: 10.1016/j.cell.2009.05.006. [DOI] [PMC free article] [PubMed] [Google Scholar]
- 17.Toyoshima M, Howie HL, Imakura M, Walsh RM, Annis JE, Chang AN, Frazier J, Chau BN, Loboda A, Linsley PS. Functional genomics identifies therapeutic targets for MYC-driven cancer. Proc Natl Acad Sci U S A. 2012;109:9545–9550. doi: 10.1073/pnas.1121119109. [DOI] [PMC free article] [PubMed] [Google Scholar]
- 18.Astsaturov I, Ratushny V, Sukhanova A, Einarson MB, Bagnyukova T, Zhou Y, Devarajan K, Silverman JS, Tikhmyanova N, Skobeleva N. Synthetic Lethal Screen of an EGFR-Centered Network to Improve Targeted Therapies. Sci Signal. 2010;3:ra67. doi: 10.1126/scisignal.2001083. [DOI] [PMC free article] [PubMed] [Google Scholar]
- 19.Wang X, Simon R. Identification of potential synthetic lethal genes to p53 using a computational biology approach. BMC Med Genomics. 2013;6:30. doi: 10.1186/1755-8794-6-30. [DOI] [PMC free article] [PubMed] [Google Scholar]
- 20.Edgar R, Domrachev M, Lash AE. Gene Expression Omnibus: NCBI gene expression and hybridization array data repository. Nucleic Acids Res. 2002;30:207–210. doi: 10.1093/nar/30.1.207. [DOI] [PMC free article] [PubMed] [Google Scholar]
- 21.Ding L, Getz G, Wheeler DA, Mardis ER, McLellan MD, Cibulskis K, Sougnez C, Greulich H, Muzny DM, Morgan MB. Somatic mutations affect key pathways in lung adenocarcinoma. Nature. 2008;455:1069–1075. doi: 10.1038/nature07423. [DOI] [PMC free article] [PubMed] [Google Scholar]
- 22.Hong Y, Downey T, Eu KW, Koh PK, Cheah PY. A 'metastasis-prone' signature for early-stage mismatch-repair proficient sporadic colorectal cancer patients and its implications for possible therapeutics. Clin Exp Metastasis. 2010;27:83–90. doi: 10.1007/s10585-010-9305-4. [DOI] [PubMed] [Google Scholar]
- 23.Farmer H, McCabe N, Lord CJ, Tutt ANJ, Johnson DA, Richardson TB, Santarosa M, Dillion KJ, Hickson I, Knights C. Targeting the DNA repair defect in BRCA mutant cells as a therapeutic strategy. Nature. 2010;434:917–921. doi: 10.1038/nature03445. [DOI] [PubMed] [Google Scholar]
- 24.Storey JD, Tibshirani R. Statistical significance for genomewide studies. Proc Natl Acad Sci U S A. 2003;100:9440–9445. doi: 10.1073/pnas.1530509100. [DOI] [PMC free article] [PubMed] [Google Scholar]
- 25.Su JL, Shih JY, Yen ML, Jeng YM, Chang CC, Hsieh CY, Wei LH, Yang PC, Kuo ML. Cyclooxygenase-2 induces EP1- and HER-2/Neu-dependent vascular endothelial growth factor-C up-regulation: a novel mechanism of lymphangiogenesis in lung adenocarcinoma. Cancer Res. 2004;64:554–564. doi: 10.1158/0008-5472.can-03-1301. [DOI] [PubMed] [Google Scholar]
- 26.Wood LD, Parsons DW, Jones S, Lin J, Sjoblom T, Leary RJ, Shen D, Boca SM, Barber T, Ptak J. The genomic landscapes of human breast and colorectal cancers. Science. 2007;318:1108–1113. doi: 10.1126/science.1145720. [DOI] [PubMed] [Google Scholar]
- 27.Li HF, Keeton A, Vitolo M, Maddox C, Rasmussen L, Hobrath J, White EL, Park BH, Piazza GA, Kim JS. A high-throughput screen with isogenic PTEN +/+ and PTEN−/− cells identifies CID1340132 as a novel compound that induces apoptosis in PTEN and PIK3CA mutant human cancer cells. J Biomol Screen. 2011;16:383–393. doi: 10.1177/1087057110397357. [DOI] [PMC free article] [PubMed] [Google Scholar]
- 28.Martin SA, McCabe N, Mullarkey M, Cummins R, Burgess DJ, Nakabeppu Y, Oka S, Kay E, Lord CJ, Ashworth A. DNA Polymerases as Potential Therapeutic Targets for Cancers Deficient in the DNA Mismatch Repair Proteins MSH2 or MLH1. Cancer Cell. 2010;17:235–248. doi: 10.1016/j.ccr.2009.12.046. [DOI] [PMC free article] [PubMed] [Google Scholar]
- 29.Li G, Yin H, Kuret J. Casein kinase 1 delta phosphorylates tau and disrupts its binding to microtubules. J Biol Chem. 2004;279:15938–15945. doi: 10.1074/jbc.M314116200. [DOI] [PubMed] [Google Scholar]
- 30.Callahan JF, Burgess JL, Fornwald JA, Gaster LM, Harling JD, Harrington FP, Heer J, Kwon C, Lehr R, Mathur A. Identification of novel inhibitors of the transforming growth factor beta1 (TGF-beta1) type 1, receptor (ALK5) J Med Chem. 2002;45:999–1001. doi: 10.1021/jm010493y. [DOI] [PubMed] [Google Scholar]
- 31.Bonato V, Baladandayuthapani V, Broom BM, Sulman EP, Aldape KD, Do KA. Bayesian ensemble methods for survival prediction in gene expression data. Bioinformatics. 2011;27:359–367. doi: 10.1093/bioinformatics/btq660. [DOI] [PMC free article] [PubMed] [Google Scholar]
- 32.Yanaihara N, Caplen N, Bowman E, Seike M, Kumamoto K, Yi M, Stephens RM, Okamoto A, Yokota J, Tanaka T. Unique microRNA molecular profiles in lung cancer diagnosis and prognosis. Cancer Cell. 2006;9:189–198. doi: 10.1016/j.ccr.2006.01.025. [DOI] [PubMed] [Google Scholar]
- 33.Yu SL, Chen HY, Chang GC, Chen CY, Chen HW, Singh S, Cheng CL, Yu CJ, Lee YC, Chen HS. MicroRNA signature predicts survival and relapse in lung cancer. Cancer Cell. 2008;13:48–57. doi: 10.1016/j.ccr.2007.12.008. [DOI] [PubMed] [Google Scholar]
- 34.Presson AP, Yoon NK, Bagryanova L, Mah V, Alavi M, Maresh EL, Rajasekaran AK, Goodglick L, Chia D, Horvath S. Protein expression based multimarker analysis of breast cancer samples. BMC Cancer. 2011;11:230. doi: 10.1186/1471-2407-11-230. [DOI] [PMC free article] [PubMed] [Google Scholar]
- 35.Nikitin AY, Liu CY, Flesken-Nikitin A, Chen CF, Chen PL, Lee WH. Cell lineage-specific effects associated with multiple deficiencies of tumor susceptibility genes in Msh2-/-Rb +/- mice. Cancer Res. 2002;62:5134–5138. [PubMed] [Google Scholar]
- 36.Gudkov AV, Komarova EA. Pathologies associated with the p53 response. Cold Spring Harb Perspect Biol. 2010;2:a001180. doi: 10.1101/cshperspect.a001180. [DOI] [PMC free article] [PubMed] [Google Scholar]
- 37.Behrend L, Milne DM, Stoter M, Deppert W, Campbell LE, Meek DW, Knippschild U. IC261, a specific inhibitor of the protein kinases casein kinase 1-delta and -epsilon, triggers the mitotic checkpoint and induces p53-dependent postmitotic effects. Oncogene. 2000;19:5303–5313. doi: 10.1038/sj.onc.1203939. [DOI] [PubMed] [Google Scholar]
- 38.Cheong JK, Nguyen TH, Wang H, Tan P, Voorhoeve PM, Lee SH, Virshup DM. Oncogene. 2011;30:2558–2569. doi: 10.1038/onc.2010.627. [DOI] [PMC free article] [PubMed] [Google Scholar]
- 39.Grigoryan T, Wend P, Klaus A, Birchmeter W. Deciphering the function of canonical Wnt signals in development and disease: conditional loss- and gain-of-function mutations of beta-catenin in mice. Genes Dev. 2008;22:2308–2341. doi: 10.1101/gad.1686208. [DOI] [PMC free article] [PubMed] [Google Scholar]
- 40.Rivlin N, Brosh R, Oren M, Rotter V. Mutations in the p53 Tumor Suppressor Gene: Important Milestones at the Various Steps of Tumorigenesis. Genes Cancer. 2011;2:466–474. doi: 10.1177/1947601911408889. [DOI] [PMC free article] [PubMed] [Google Scholar]
- 41.Kim NH, Kim HS, Kim NG, Lee I, Choi HS, Li XY, Kang SE, Cha SY, Ryu JK, Na JM. p53 and microRNA-34 are suppressors of canonical Wnt signaling. Sci Signal. 2011;4:ra71. doi: 10.1126/scisignal.2001744. [DOI] [PMC free article] [PubMed] [Google Scholar]
- 42.Sadanandam A, Lyssiotis CA, Homicsko A, Collisson EA, Gibb WJ, Wullschleger S. A colorectal cancer classification system that associates cellular phenotype and responses to therapy. Nat Med. 2013;19:619–625. doi: 10.1038/nm.3175. [DOI] [PMC free article] [PubMed] [Google Scholar]
- 43.Kosari F., Ida C.M., Aubry M.C., Yang L., Kovtun I.V., Klein J.L., Li Y., Erdogan S., Tomaszek S.C., Murphy S.J. ASCL1 and RET expression defines a clinically relevant subgroup of lung adenocarcinoma characterized by neuroendocrine differentiation. Oncogene. 2013 doi: 10.1038/onc.2013.359. Prepublished on 2013/09/16 as http://dx.doi.org/10.1038/onc.2013.359. [DOI] [PMC free article] [PubMed] [Google Scholar]
Associated Data
This section collects any data citations, data availability statements, or supplementary materials included in this article.
Supplementary Materials
Supplementary Figures
Supplementary Tables
Supplementary Dataset S1
Supplementary Text S1
Supplementary Text S2
Supplementary Materials and Methods