

Abstract
PDLIM2 is a cytoskeletal and nuclear PDZ-LIM domain protein that regulates the stability of Nuclear Factor kappa-B (NFκB) and other transcription factors, and is required for polarized cell migration. PDLIM2 expression is suppressed by methylation in different cancers, but is strongly expressed in invasive breast cancer cells that have undergone an Epithelial Mesenchymal Transition (EMT). PDLIM2 is also expressed in non-transformed breast myoepithelial MCF10A cells and here we asked whether it is important for maintaining the polarized, epithelial phenotype of these cells. Suppression of PDLIM2 in MCF10A cells was sufficient to disrupt cell polarization and acini formation with increased proliferation and reduced apoptosis in the luminal space compared to control acini with hollow lumina. Spheroids with suppressed PDLIM2 exhibited increased expression of cell-cell and cell-matrix adhesion proteins including beta 1 (β1) integrin. Interestingly, levels of the Insulin-like growth factor 1 receptor (IGF-1 R) and Receptor of activated protein kinase C 1 (RACK1), which scaffolds IGF-1R to β1 integrin, were also increased, indicating a transformed phenotype. Focal Adhesion Kinase (FAK) and cofilin phosphorylation, and RhoA Guanosine Triphosphatase (GTPase) activity were all enhanced in these spheroids compared to control acini. Importantly, inhibition of either FAK or Rho Kinase (ROCK) was sufficient to rescue the polarity defect. We conclude that PDLIM2 expression is essential for feedback regulation of the β1-integrin-RhoA signalling axis and integration of cellular microenvironment signals with gene expression to control the polarity of breast epithelial acini structures. This is a mechanism by which PDLIM2 could mediate tumour suppression in breast epithelium.
Introduction
Much evidence supports the concept that malignant transformation and breast cancer progression are strongly linked not only with uncontrolled growth but also with loss of polarized tissue architecture due to changes in the cellular microenvironment. Many different studies have established that signaling from the extracellular matrix (ECM) has a profound effect on gene expression and cellular phenotype [1], [2], [3], [4]. However, it is still not understood how signals from the cellular microenvironment are integrated with regulation of gene expression in normal epithelium compared with transformed or invasive cancer cells. The transcription factor Nuclear Factor kappa-B (NFκB) has recently been proposed to play an important role in disrupting normal microenvironmental cues necessary for maintaining tissue organization, with increased expression of many NFκB target genes in breast cell cultures that exhibit a disorganized invasive phenotype [5], [6]. We also recently proposed a role for the PDLIM2 protein as a courier protein in integrating cytoskeletal signaling with gene expression in the nucleus to control reversible epithelial-to-mesenchymal transition (EMT) in breast and prostate cancer cells [7].
PDLIM2 (also known as Mystique or SLIM) is a cytoskeletal and nuclear PDZ-LIM domain protein that regulates the stability of several transcription factors including NFκB and signal transducer and activator of transcription proteins (STATs) in hemopoietic and epithelial cells [7], [8], [9]. It was first identified in corneal epithelial cells [10] and in several cell types including fibroblasts transformed by overexpression of the insulin-like growth factor 1 receptor (IGF-1R; Mystique), epithelial cancer cells, [11], [12], [13], [14], T lymphocytes (SLIM) [8], [9], and macrophages [9]. PDLIM2 is located on chromosome 8p21 [11], which is frequently disrupted in various cancers [15], and its expression has been associated with both tumorigenesis and tumor suppression. In breast cancer cells, overexpression of PDLIM2 decreases anchorage-independent growth and reduces tumor growth in vivo[11], [13], [14]. Moreover, PDLIM2 is repressed in both estrogen receptor–positive and estrogen receptor–negative breast cancer cells [13], and vitamin D can induce its re-expression and suppress motility and invasion in breast cancer cell lines [9], [16]. However, PDLIM2 is highly expressed in cell lines derived from metastatic cancer such as MDA-MB-231 breast cells and androgen-independent prostate cells [7], [11]. Suppression of PDLIM2 reverses the EMT phenotype of these cells and alters the activity of several transcription factor families and the activity of the Constituitive Photomorphogenic 9 Signalosome Complex (COP9 signalosome) in the protein degradation pathway [7].
PDLIM2 expression is lower in MCF-7 (luminal type) than in MDA-MB-231 (post EMT) breast cancer cells [7], [11], [17]. This is consistent with data from publicly available databases indicating that PDLIM2 expression is associated with poor outcome in basal breast cancers [18]. Interestingly, PDLIM2 is also highly expressed in MCF10A cells, which are polarized non-transformed breast myoepithelial cells [9], [11]. Because PDLIM2 expression may be repressed upon transformation and its expression may reflect the differentiation status of breast cancer cells [7], [11], [13], we hypothesised that in normal breast epithelium, PDLIM2 is required for maintaining the polarized epithelial phenotype. To test this, we used the classic model of three-dimensional (3D) acinar cultures of MCF10A cells in Matrigel, whereby acini formation that simulates in vivo formation of glandular epithelium requires distinct basolateral and apicolateral polarity of the epithelial cells, as well as a coordinated balance of decreased proliferation and increased apoptosis within the structures to permit hollow lumen formation [19], [20], [21], [22]. We found that PDLIM2 expression is required for acini formation and that cells with suppressed PDLIM2 form unpolarized spheroid structures. This was associated with dysregulation of cues from the ECM, which is indicated by increased cell-cell and cell-ECM signaling through β1-integrin, focal adhesion kinase (FAK), and RhoA. Polarity could be restored by inhibition of either FAK or Rho kinase (ROCK) activity. Our findings are consistent with an essential function for PDLIM2 in integrating cellular microenvironment signals with gene expression to control differentiation and polarity of breast epithelium.
Materials and Methods
Cell Culture and Generation of shPDLIM2-Expressing Cell Lines
MCF10A cells were cultured in a 50:50 mix of Dulbecco's modified Eagle's medium/Ham's F12 medium (Sigma, Dublin, Ireland) supplemented with 5% horse serum, 1 μg/ml insulin, 20 ng/ml epidermal growth factor (EGF), 100 ng/ml cholera toxin, 0.5 μg/ml hydrocortisone, and 2 mM l-glutamine. MCF10A cell lines stably expressing short hairpin RNA (shRNA) were generated by transfection with pSUPER vectors encoding shRNA targeting PDLIM2 (shPDLIM2: ACATAATCGTGGCCATCAA) or a control shRNA (shScramble: TGACATGATAATACTCTCT), as described previously [7], using Lipofectamine 2000, following the manufacturer's protocol. Cells were cultured in the presence of 1 mg/ml G418 (Calbiochem, La Jolla, CA) for 4 to 6 weeks, at which time individual clones were screened for expression of PDLIM2 by Western blot analysis and shScramble clones and shPDLIM2 clones with > 60% suppression were selectively expanded for experiments.
Reagents and Antibodies
Lipofectamine 2000 was from Invitrogen (Paisley, United Kingdom). Antibodies: anti-PDLIM2 antibody was generated by Fusion Antibodies (Belfast, Northern Ireland) using glutathione S-transferase (GST)–tagged PDLIM2 (amino acids 79-352) as an immunogen. Anti–cleaved caspase 3, phospho-cofilin (Ser3) and phospho-FAK (Tyr397) were from Cell Signaling Technology (Beverly, MA). Anti-Receptor of activated protein kinase C 1 (RACK1), Cyclin D1, E-cadherin, and β-catenin were from BD Biosciences (Oxford, United Kingdom). Anti–IGF-1R and FAK antibodies were from Santa Cruz Biotechnology (Santa Cruz, CA). Anti–activated β1-integrin (CD29) was from Millipore (Cork, Ireland). Anti-β1-integrin, (atypical) PKC zeta and RhoA antibodies were from Abcam (Cambridge, United Kingdom). Anti–α-tubulin and laminin were from Sigma-Aldrich (Dublin, Ireland). Cy2- and Cy3-conjugated secondary antibodies were purchased from Jackson ImmunoResearch Laboratories (Cambridgeshire, United Kingdom). IRDye 680– and IRDye 800CW–conjugated antibodies were from LI-COR Biosciences (Cambridge, United Kingdom). EGF was purchased from Peprotech (London, United Kingdom), Matrigel was from Unitech (Dublin, Ireland), Y27632 was from ChemDea (Ridgewood, NJ), and PF573228 was from Tocris Bioscience (R&D Systems, Abingdon, United Kingdom). All other reagents were from Sigma, unless otherwise noted.
Three-Dimensional Culture of MCF10A Cells
For MCF10A cell 3D acini formation, cells were grown in Matrigel according to the protocol described by Debnath et al. [19]. Briefly, shScramble and shPDLIM2-MCF10A cells were cultured as described above in growth medium containing 1 mg/ml G418. A single cell suspension (2000 cells per well) was plated in assay medium (growth medium with 2% horse serum, without EGF or G418) onto eight-well chamber slides coated with a layer of growth factor–reduced Matrigel, and cells were overlaid with a 1:1 volume of assay medium containing 40 ng/ml EGF and 2 mg/ml G418 and 4% Matrigel. Cells were cultured for 12 days, with growth medium replaced every 3 days. For inhibitor experiments, FAK inhibitor (PF573228 (PF228); 50 nM), ROCK inhibitor (Y27632; 10 μM), or 0.1% DMSO vehicle control was added on the day of plating, and the medium was changed every 3 days containing fresh inhibitor or DMSO as appropriate.
Immunofluorescence Analysis and Confocal Image Acquisition
Three-dimensional MCF10A acini were fixed and stained by immunofluorescence cytology as described by Debnath et al. [19], and all procedures were at room temperature. Cells were probed with primary antibodies for 1 to 2 hours, followed by Cy2- or Cy3-conjugated secondary antibodies and nuclei visualized with Hoechst dye as described previously [11]. Confocal sections were acquired with a Nikon eC1 plus, TE2000E confocal laser scanning microscope. Serial z-sections were obtained every 5 μM (usually 10-15 sections per field), and representative mid-section images were analyzed using the EZ-C1 Gold version 3.90 build 869 software (Aquilant Scientific, Dublin, Ireland) and processed for presentation using Adobe Photoshop CS2 version 9.0.2 (Adobe Systems Incorporated, San Jose, CA).
Cell Lysis and Western Blot Analysis
Total cellular protein extracts from 2D cell cultures were prepared as described previously [9]. All protein samples for Western blot analysis were separated by 10% sodium dodecyl sulfate–polyacrylamide gel electrophoresis and transferred to a nitrocellulose membrane. Following overnight incubation with primary antibody, membranes were probed with IRDye 700– or IRDye 800–conjugated secondary antibodies, and proteins were detected using the Odyssey Image Scanner System (LI-COR Biosciences). The approximate protein molecular weight in kilodaltons is indicated on the left of each Western blot panel.
RhoA Guanosine Triphosphatase (GTPase) Activation Pull-Down Assays
GST pull-down assays were performed as described elsewhere [23]. Briefly, cells were lysed in lysis buffer containing protease inhibitors. Lysates were incubated at 4 °C for 1 hour with GST-Rhotekin coupled to glutathione-sepharose beads (Amersham Biosciences, Buckinghamshire, United Kingdom). Samples were resolved by sodium dodecyl sulfate–polyacrylamide gel electrophoresis and Western blot analysis as described above to determine levels of active RhoA.
Statistical Analysis
Data were analyzed for statistical significance using Student's t test to compare samples where appropriate. A P value of < .05 was deemed significant and graded P values are denoted in the presented data as follows: *P < .05; **P < .005; ***P < .0005.
Results
PDLIM2 Suppression Disrupts MCF10A Acini Formation
To investigate whether PDLIM2 is required for polarized growth in 3D cultures, we stably suppressed PDLIM2 expression in MCF10A cells using shRNA (shPDLIM2) and compared these to control cells expressing scrambled shRNA (shScramble). PDLIM2 mRNA and protein expression were suppressed by approximately 60% in MCF10A cells stably expressing shPDLIM2 (Figure 1, A–C). Endogenous PDLIM2 is expressed in both the cytoplasm and nuclei of MCF10A cells (Figure W1, A and B), and shPDLIM2 cells showed a similar reduction in cytoplasmic and nuclear PDLIM2 levels (Figure W1, B and C). Cells were cultured in Matrigel for 12 days to allow spheroid formation. Immunofluorescence and confocal analysis of 3D spheroids demonstrated that shScramble MCF10A cells formed spheroids with hollow lumina, whereas cells with PDLIM2 suppressed formed irregular-shaped spheroids without distinct lumina (Figure 1D).
Figure 1.
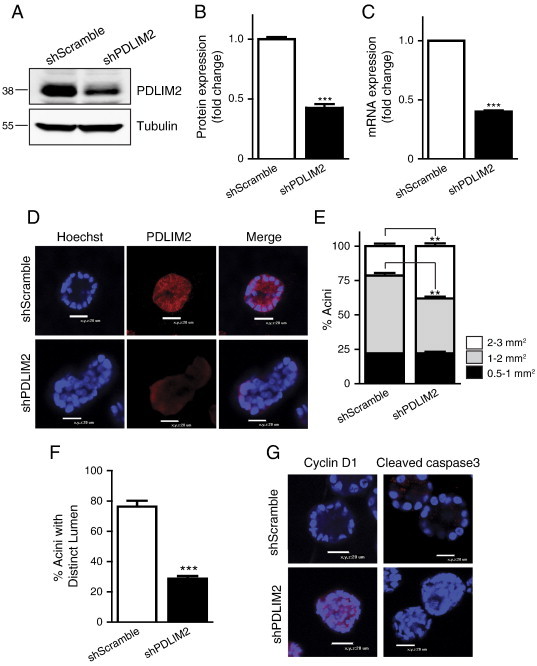
Loss of PDLIM2 expression disrupts acini formation in a 3D model. Clones of MCF10A cells stably expressing control shRNA (shScramble) or shRNA targeting PDLIM2 (shPDLIM2) were examined for PDLIM2 protein expression. (A) A representative Western blot is shown. (B) The graph represents densitometric quantification of PDLIM2 expression from four separate experiments (mean ± SEM). (C) PDLIM2 mRNA expression was examined by quantitative polymerase chain reaction. The data represent mean of three separate experiments ± SEM. (D) shScramble or shPDLIM2-MCF10A cells were cultured for 12 days in Matrigel, and 3D acini structures were fixed and processed for immunofluorescence cytology and confocal imaging as described in Materials and Methods section. Representative midplane images of confocal serial z-sections show PDLIM2 (red) and nuclear staining (Hoechst; blue) in MCF10A acini. (E) Quantification of acinar size measured using the Fluoview software or (F) acini with distinct lumen, quantified from confocal images. Data shown are the means ± SEM of at least 50 acini per cell type from each of three independent experiments in E and F (**P < .005; ***P < .0005). (G) Proliferation (cyclin D1) and apoptosis (cleaved caspase 3) were analyzed in MCF10A acini by confocal microscopy. Nuclei are stained blue. Images are representative of at least three separate experiments with similar results.
We next analyzed the size of spheroids formed by shPDLIM2 compared to shScramble cells and found significantly higher numbers of larger spheroids (2-3 mm2), with a concomitant decrease in spheroids of 1 to 2 mm2 size, although numbers of the smallest acini (0.5-1 mm2) were similar (Figure 1E). Importantly, the number of acini with distinct lumina was reduced by more than 50% in the shPDLIM2 structures compared with controls (Figure 1F). In addition, cyclin D1 expression was greatly increased in the shPDLIM2 acini and activated caspase 3 activity was reduced, indicating increased proliferation and reduced apoptosis within the structures, compared with the shScramble cells (Figure 1G). Overall, the data indicate that suppression of PDLIM2 disrupts the formation of MCF10A acini.
Disrupted Polarity and Increased Cell-Cell and Cell-Matrix Adhesion in MCF10A Acini with PDLIM2 Suppressed
We next investigated expression of markers of cell polarity and adhesion in acinar structures with PDLIM2 suppressed. Laminin and atypical protein kinase C both exhibited increased and diffuse expression throughout the shPDLIM2 acini compared with a more apico-basal staining pattern in control acini (Figure 2, A and B). This was accompanied by increased E-cadherin and β-catenin expression at cell-cell junctions of the shPDLIM2 acini compared with control cells (Figure 2C). Together, these results indicate disrupted cell polarity and increased cell-cell adherence in shPDLIM2 3D spheroids. Similarly, fibronectin and β1-integrin expression and activity were increased in the shPDLIM2 cells (Figure 2D), as were the IGF-1R and the scaffolding protein RACK1, which can integrate IGF-1R and integrin signaling [24], [25] (Figure 2E). All of these indicate increased interaction with and signaling from the ECM and increased cooperative signaling between the IGF-1R and β1-integrin signaling pathways in cells with suppressed PDLIM2. Further, because increased IGF-1R expression has previously been associated with MCF10A transformation [26], [27], and because cell polarity is severely disrupted, the phenotype of shPDLIM2 MCF10A 3D structures suggests that PDLIM2 can regulate breast epithelial cell differentiation.
Figure 2.
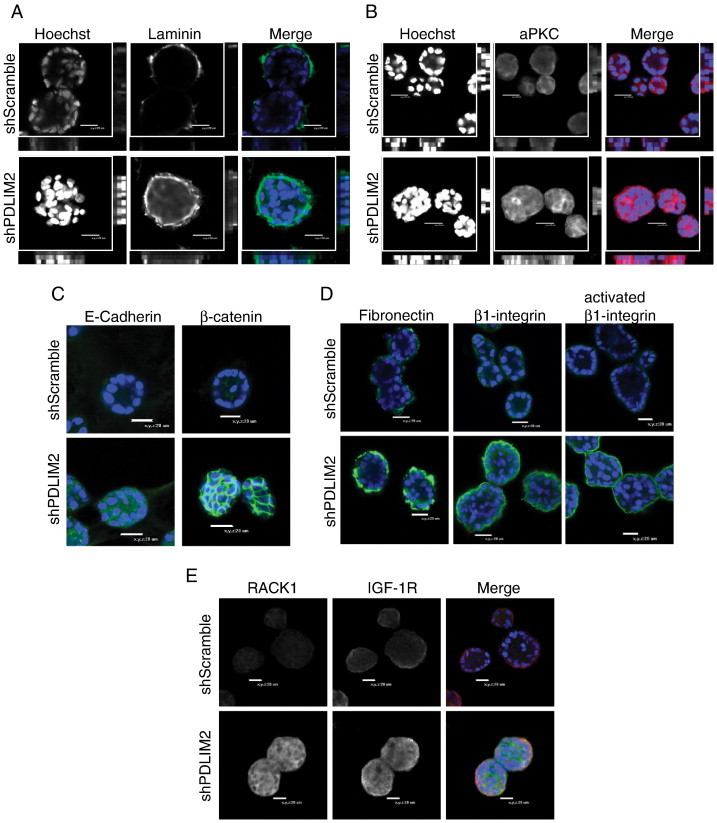
Suppression of PDLIM2 affects polarization and enhances cell-cell and cell-matrix adhesion in a 3D model of MCF10A acini formation. Twelve-day-old cultures of shScramble and shPDLIM2 MCF10A acinar structures were fixed and processed for confocal microscopy analysis. (A) Basal polarity was assessed by staining for laminin (green) and apical polarity by atypical protein kinase C (red) localization in shScramble and shPDLIM2 MCF10A structures. Midplane confocal Images are shown with x:y cross-sections on the bottom and right panels of each image. (C) E-cadherin and β-catenin expression was examined in MCF10A acini. (D) Fibronectin and β1-integrin expression was examined in shScramble and shPDLIM2 MCF10A acini by confocal microscopy. (E) ShScramble and shPDLIM2 MCF10A 3D structures were examined for IGF-1R (red) and RACK1 (green) expression. Representative confocal midplane sections of 5 μm serial z-sections are presented, nuclei are blue, and data are representative of at least three independent experiments with similar results (A-E).
FAK and RhoA Activity Are Increased in MCF10A Acini with Suppressed PDLIM2
To determine which signaling pathways downstream of β1-integrin might account for the disrupted acinar polarity, we examined FAK and RhoA GTPase activity. As expected from the increased β1-integrin activation (Figure 2D), the activity of FAK indicated by phosphorylation on Y397 was increased in shPDLIM2 cells (Figure 3A). Phosphorylation of cofilin, which inhibits its normal activity in actin turnover, was also increased throughout the shPDLIM2 structures (Figure 3A). This increase in phosphorylation was confirmed by Western blot analysis in shPDLIM2 MCF10A cells grown in 2D monolayer cultures (Figures 3, B–D, and 4A).
Figure 3.
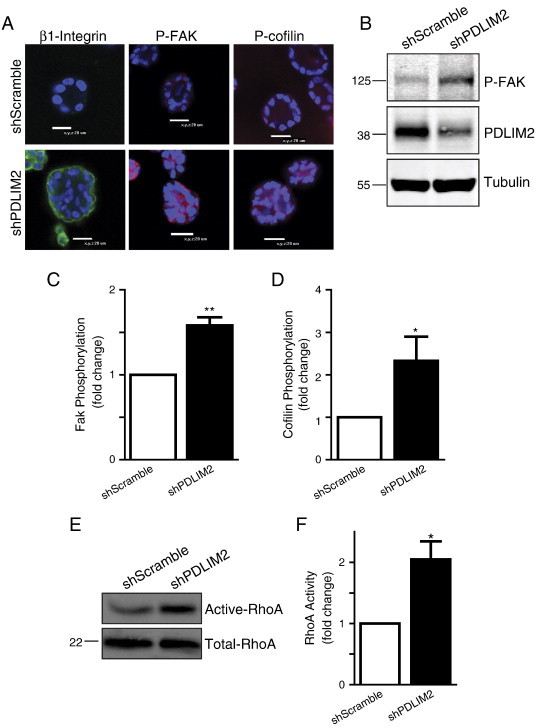
FAK and RhoA activity are increased in MCF10A cells with suppressed PDLIM2 expression. (A) ShScramble and shPDLIM2 MCF10A cells were grown in 3D culture for 12 days and fixed and stained for β1-integrin and phosphorylation of FAK and cofilin. Representative confocal midplane z-sections are presented. (B) Western blot analysis of P-FAK expression in shScramble and shPDLIM2 MCF10A cells. Densitometric quantification of phosphorylation of FAK (C) and cofilin (D) in shPDLIM2 compared with shScramble MCF10A cells using the Odyssey software. The graph represents mean ± SEM of three independent experiments. (E) RhoA activity was assessed using GST-Rhotekin pull-down assays from lysates of shScramble and shPDLIM2 MCF10A cells. Total lysates were probed for RhoA expression as loading control. (F) RhoA activity was quantified using the Odyssey software from three independent GST pull-down assays in shScramble and shPDLIM2 MCF10A cells. The graph represents mean ± SEM; **P < .005; ***P < .0005.
Figure 4.
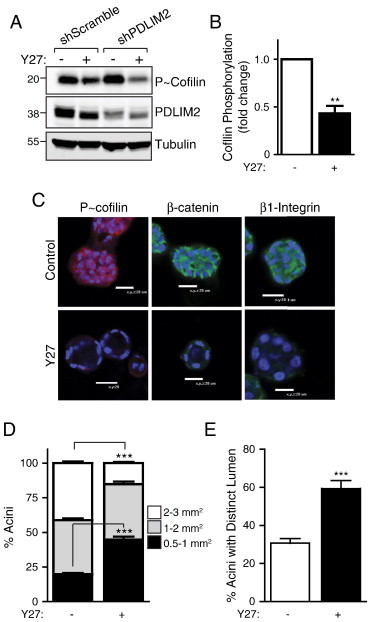
Inhibition of ROCK can rescue the morphologic and polarization defects of MCF10A acini due to loss of PDLIM2 expression. (A) Inhibition of ROCK activity following treatment with the ROCK inhibitor (Y27; 10 μM, 24 hours) was validated by assessment of cofilin phosphorylation by Western blot. Samples were also probed for PDLIM2 expression and tubulin as loading controls. (B) Graph showing fold change of P-cofilin expression following ROCK inhibition in shPDLIM2 MCF10A, quantified by densitometry; data are means ± SEM from three separate experiments. (C) ShPDLIM2 MCF10A cells were cultured in 3D Matrigel assay for 12 days in the presence of ROCK inhibitor (Y27; 10 μM) or DMSO vehicle (control). Cell structures were fixed and processed for confocal microscopy analysis. Representative confocal midplane sections are shown, and nuclei are blue. (D) Quantification of size of shPDLIM2 MCF10A acinar structures measured using the Fluoview software or (E) acini with distinct lumina, quantified from confocal images. Data are presented as means ± SEM of at least 50 acini per cell culture condition from three independent experiments in D and E; **P < .005; ***P < .0005.
Cofilin is phosphorylated downstream of ROCK, which is activated by the RhoA GTPase in response to integrin/FAK activation [4], and RhoA has a well-established function in regulating morphology, cell polarity, and architecture of cells in 3D culture models [28], so we were interested to test whether RhoA activity was altered by PDLIM2 suppression. RhoA activity was assessed using GST-Rhotekin pull-down assays in shScramble and shPDLIM2 cells grown in monolayer cultures. RhoA GTPase activity was increased two-fold when PDLIM2 was suppressed, demonstrating that the FAK/RhoA signaling pathway is hyperactivated in MCF10A cells with suppressed PDLIM2 expression (Figure 3, E and F). Thus, the overall activity of the β1-integrin–RhoA signaling pathway is enhanced upon suppression of PDLIM2.
ROCK or FAK Inhibition Rescues Cells from PDLIM2 Suppression in Acinar Formation
We next tested whether inhibition of ROCK, the downstream effector of RhoA activity that leads to phosphorylation of cofilin, could rescue MCF10A cells from PDLIM2 suppression and allow polarized acinar formation. We first demonstrated that low concentrations of the ROCK inhibitor, Y27632, effectively reduced the basal levels of cofilin phosphorylation observed in shScramble MCF10A cells and reversed the increase in cofilin phosphorylation observed in shPDLIM2 cells (Figures 4, A and B, and W2, A and B). Cells were then cultured in Matrigel with Y27632 or DMSO as vehicle control. After 12 days, both shScramble and shPDLIM2 3D structures had greatly reduced cofilin phosphorylation (Figures 4C and W2B), and it was clear that shPDLIM2 cells could now form hollow lumina with the outer cells exhibiting reduced β1-integrin and β-catenin expression compared to vehicle controls (Figure 4C). Quantification of the profiles of acinar size showed an approximately two-fold decrease in larger sized acini compared with vehicle control shPDLIM2 cells (Figure 4D). There was also a two-fold increase in numbers of acini exhibiting hollow lumina in shPDLIM2 cells treated with the ROCK inhibitor (Figure 4E). These data indicate that PDLIM2 is required to regulate RhoA-dependent polarization and lumen formation in breast epithelial cell acini.
Next, we investigated whether inhibition of FAK activity, upstream of ROCK, could also rescue the defect in acini formation in shPDLIM2 cells. As expected, the FAK inhibitor, PF573228, suppressed FAK phosphorylation in MCF10A cells (Figures 5, A and B, and W2, C and D). RhoA activity was also significantly decreased in shPDLIM2 cells exposed to the FAK inhibitor (Figure 5, C and D). ShPDLIM2 cells cultured in Matrigel in the presence of FAK inhibitor displayed decreased FAK and cofilin phosphorylation and levels of β1-integrin and β-catenin were also slightly reduced (Figure 5E). Similar to observations with the ROCK inhibitor, shPDLIM2 cells cultured with the FAK inhibitor formed smaller acini than cells cultured with control vehicle (Figure 5F), and the overall number of shPDLIM2 3D structures exhibiting distinct hollow lumina was greatly increased (Figure 5G).
Figure 5.
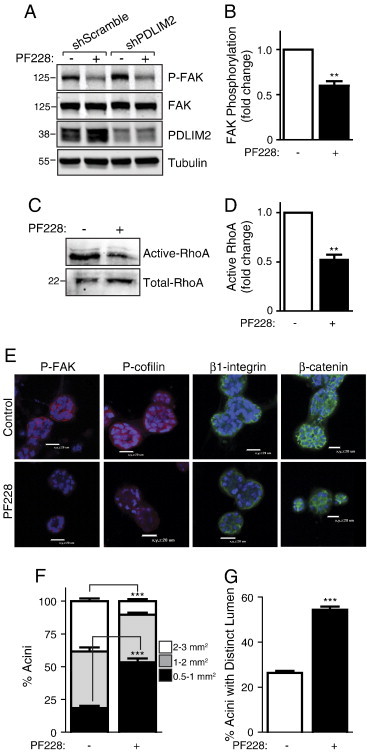
Disruption of acini formation and associated increased RhoA activation of MCF10A with suppressed PDLIM2 expression are dependent on β1-integrin regulation of FAK/RhoA pathway. (A) Inhibition of FAK activity following treatment with the FAK inhibitor (PF228; 50 nM, 24 hours) was validated by assessment of phosphorylation of FAK by Western blot analysis. Total FAK levels, PDLIM2 expression, and tubulin expression are also presented as controls. (B) Graph showing fold change of P-FAK in shPDLIM2 MCF10A, quantified by densitometry of P-FAK expression from three independent experiments, presented as mean ± SEM. (C) shPDLIM2 MCF10A cells were treated with the FAK inhibitor (PF228; 50 nM) and RhoA activity assessed using a GST-Rhotekin pull-down assay. Total lysates were probed for RhoA expression as loading control. (D) RhoA activity was quantified using the Odyssey software from three independent GST pull-down assays in shPDLIM2 MCF10A cells treated with the FAK inhibitor. The graph represents mean ± SEM. (E) shPDLIM2 MCF10A cells were cultured in 3D Matrigel assay for 12 days in the presence or absence of FAK inhibitor (PF228; 50 nM) or DMSO vehicle (control). Cell structures were fixed and processed for confocal analysis of P-FAK and P-cofilin expression. Representative confocal midplane sections; nuclei are blue. (F) Quantification of shPDLIM2 MCF10A acinar size measured using the Fluoview software or (G) shPDLIM2 MCF10A acini with distinct lumina, quantified from confocal images. Data shown are means ± SEM of at least 50 acini per cell culture condition from each of three independent experiments in F and G; **P < .005; ***P < .0005.
Taken together, these results demonstrate that inhibition of either RhoA or FAK is sufficient to rescue cells from the effects of suppression of PDLIM2 and re-enable luminal formation within 3D acini. This suggests that PDLIM2 suppression promotes β1-integrin–induced FAK-mediated activation of the RhoA-ROCK pathway and that PDLIM2 has an essential role in regulating this β1-integrin signaling pathway in breast epithelial cell polarization and 3D acinar formation. This pathway is summarized in Figure 6.
Figure 6.
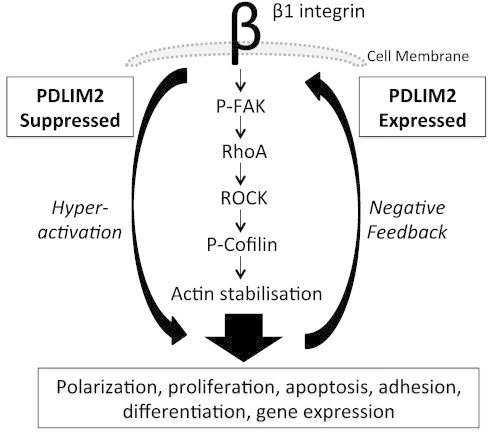
PDLIM2 has an essential function in maintaining breast epithelial cell polarity at the level of feedback signaling through the β1-integrin–FAK–RhoA axis. Suppression of PDLIM2 expression prevents negative feedback control of FAK-ROCK-RhoA signaling downstream of β1-integrin resulting in hyperactivation of the pathway causing dysregulation of polarization, proliferation/apoptosis, cell-cell and cell-matrix adhesion, and loss of normal phenotype of breast epithelial cells.
Discussion
Here, we show that PDLIM2 is required for generation of polarized MCF10A acini in 3D where it mediates feedback regulation of the β1-integrin signaling pathway. PDLIM2 expression is also required to maintain an EMT phenotype in metastatic cancer cells where it regulates transcription of a large set of genes associated with the EMT phenotype [7]. Moreover, PDLIM2 expression can be induced by vitamin D in breast cancer cells and this enhances adhesion signaling [9], [16]. Thus, PDLIM2 acts to integrate signals from the ECM with gene expression that is critical in determining breast epithelial cell phenotype. PDLIM2 expression levels and subcellular location may, in turn, be crucial in determining malignant transformation potential.
Although PDLIM2 has been characterized as a nuclear transcription factor regulator in lymphocytes and to mediate cytoskeletal and nuclear functions and potentially tumor suppression in epithelial cells, an essential function in normal epithelial cells [9], [10], [11], [12] has not been established. However, on the basis of the observations from macrophages and cancer cell lines, it was rational to propose an important role in reversible differentiation, whereby PDLIM2 expression could be suppressed to facilitate transformation or induced to facilitate EMT in epithelial cancer cells. The 3D culture model of MCF10A breast epithelial cell acini formation is an ideal system to test this concept because the process requires regulated remodeling of cells within the ECM, choreographed polarization of epithelial cells, and a balance between increased apoptosis and decreased proliferation [19], [20], [21], [22]. The results were dramatically clear. Cells with suppressed PDLIM2 were deficient in apico-basal polarization and formed proliferating spheroid structures with decreased apoptosis all indicating a transformed phenotype [27], [29]. Altered expression of proteins that mediate cell-cell and cell-ECM adhesions as previously described in breast epithelial transformation (reviewed in [2]) also supported the conclusion that MCF10A cells with suppressed PDLIM2 become transformed.
Increased β1-integrin expression and activation was associated with hyperactivation of the downstream FAK-RhoA-ROCK signaling pathway in MCF10A cells with suppressed PDLIM2. Rho/ROCK regulation by FAK is necessary for mammary branching morphogenesis [30], and β1-integrin–dependent cell adhesion to the ECM is known to activate RhoA that is required for cell contractility [30], [31], a major function of myoepithelial cells within the mammary duct [2]. The importance of β1-integrin signaling with RhoA in cell morphology and tissue architecture has been demonstrated in other cell types. For example, in endothelial cells, increased β1-integrin activation causes increased RhoA-dependent endothelial contractility resulting in irregular ECM remodeling [31]. β1-Integrin is important for cell proliferation in 3D cultures of prostate cancer cells [32] and controls morphology, adhesion, and invasion of breast cancer cells in both 2D and 3D models, through regulation of the FAK-RhoA pathway [4]. Inhibition of either β1-integrin or FAK signaling can reduce growth of chemoresistant breast cancer cells in 3D models [33]. Importantly, in this study, inhibition of the FAK-RhoA-ROCK pathway at either FAK or ROCK was sufficient to restore the defects in acinar formation of MCF10A cells with suppressed PDLIM2, including restoration of β1-integrin expression to levels similar to control cells. This indicates that control of this pathway by PDLIM2 is at the level of β1-integrin expression and activation and that PDLIM2 is required for a regulatory feedback loop from β1-integrin to FAK-RhoA-ROCK activation in breast epithelial cell acinar formation (summarized in Figure 6).
It is interesting that IGF-1R and RACK1 expression were increased in the shPDLIM2 3D structures. This is not entirely surprising as it was previously shown that β1-integrin expression regulates IGF-1R levels and activation in prostate cancer cells [32], [34]. We and others have also described how, upon ECM protein–β1-integrin ligation, RACK1 is recruited to the IGF-1R, forming a signaling complex with β1-integrin that provides a platform for recruitment and activation of several key signaling molecules including FAK [24], [25], [35], [36], [37], [38], [39]. Increased expression and activation of IGF-1R in MCF10A cells has also been shown to induce similar hyperproliferative disorganized 3D structures [26], [27], and conversely, suppression of IGF-1R causes growth inhibition and polarization of MCF-7 cells in a 3D model [40]. Thus, increased activated β1-integrin in cells with suppressed PDLIM2 would mediate the increased cell proliferation and FAK-RhoA-ROCK activation by recruiting IGF-1R and RACK1. This may also be a mechanism by which PDLIM2 suppression could facilitate acquisition of the invasive EMT phenotype associated with basal-like breast cancers.
How PDLIM2 regulates β1-integrin expression at the mRNA or protein level is not yet entirely clear. NFκB is an obvious candidate for transcriptional regulation and is already implicated as a PDLIM2 target. It is also involved in feedback from β1-integrin signaling in 3D breast cancer models, associated with disorganized invasive structures [5], [6]. PDLIM2 can regulate NFκB-p65 expression/stability in lymphocytes and macrophages [9], [41], but we found no evidence of altered p65 levels in MCF10A or other epithelial cells [7]. Moreover, we recently demonstrated that PDLIM2 regulates activity of the COP9 signalosome (CSN), resulting in differential expression of several transcription factor families, and altered expression of many EMT-associated proteins [7]. We therefore propose that the key to PDLIM2 actions is in maintaining cellular polarity by its ability to shuttle from the cytoskeleton to the nucleus to facilitate integration of cytoskeletal signaling with gene expression. It is likely that decreased PDLIM2 at both the cytoskeleton and the nucleus causes cumulative effects on cell matrix interactions, transcription factor activity, and gene expression. Loss of feedback signaling to regulate integrin expression levels in MCF10A cells is a major component of these effects.
Conclusion
In conclusion, we propose that PDLIM2 has an essential function in maintaining breast epithelial cell polarity at the level of feedback signaling through the β1-integrin–FAK–RhoA axis. Furthermore, by integrating signals from the actin cytoskeleton with gene expression to determine cell phenotype, PDLIM2 has potential to both suppress breast epithelial transformation and also to facilitate maintenance of an EMT phenotype. It will now be important to determine how PDLIM2 expression and subcellular location is regulated in breast cancer.
Abbreviations
- EMT
epithelial-to-mesenchymal transition
- ECM
extracellular matrix
- ROCK
Rho kinase
- FAK
focal adhesion kinase
Acknowledgments
We are grateful to our colleagues in the Cell Biology Laboratory for helpful discussions, to the Centre for Cardiovascular Research for assistance with confocal microscopy, to Karim Dib (Queens University Belfast) for assistance with GST assays, and to Kurt Tidmore for preparing illustrations. Author contributions: R.K.D. designed and performed the 3D culture experiments, statistical analysis, and signaling pathway assays. O.T.C. performed 3D cultures, signaling pathway assays, and statistical analysis and drafted the manuscript. R.O.C. designed and interpreted experiments and drafted the manuscript.
Footnotes
This work was funded by the Breast Cancer Campaign (2008NovPR24), Science Foundation Ireland (PI awards 07/INI/Β107 and 11/PI/1136), and the Health Research Board (HRA 2009/41). We also acknowledge the Irish Cancer Society Collaborative Cancer Research Centre BREAST-PREDICT. Competing interests: The authors declare that they have no competing interests.
This article refers to supplementary materials, which are designated by Figures W1 and W2 and are available online at www.neoplasia.com.
Supplementary data to this article can be found online at http://dx.doi.org/10.1016/j.neo.2014.04.006.
Appendix A. Supplementary Data
Supplementary materials
References
- 1.Bissell MJ, Kenny PA, Radisky DC. Microenvironmental regulators of tissue structure and function also regulate tumor induction and progression: the role of extracellular matrix and its degrading enzymes. Cold Spring Harb Symp Quant Biol. 2005;70:343–356. doi: 10.1101/sqb.2005.70.013. [DOI] [PMC free article] [PubMed] [Google Scholar]
- 2.Keely P. Mechanisms by which the extracellular matrix and integrin signaling act to regulate the switch between tumor suppression and tumor promotion. J Mammary Gland Biol Neoplasia. 2011;16(3):205–219. doi: 10.1007/s10911-011-9226-0. [DOI] [PMC free article] [PubMed] [Google Scholar]
- 3.Nguyen-Ngoc K-V, Cheung KJ, Brenot A, Shamir ER, Gray RS, Hines WC, Yaswen P, Werb Z, Ewald AJ. ECM microenvironment regulates collective migration and local dissemination in normal and malignant mammary epithelium. Proc Natl Acad Sci U S A. 2012;109(39):E2595–E2604. doi: 10.1073/pnas.1212834109. [DOI] [PMC free article] [PubMed] [Google Scholar]
- 4.Costa P, Scales TM, Ivaska J, Parsons M. Integrin-specific control of focal adhesion kinase and RhoA regulates membrane protrusion and invasion. PLoS One. 2013;8(9):e74659. doi: 10.1371/journal.pone.0074659. [DOI] [PMC free article] [PubMed] [Google Scholar]
- 5.Becker-Weimann S, Xiong G, Furuta S, Han J, Kuhn I, Akavia U-D, Pe'er D, Bissell MJ, Xu R. NFkB disrupts tissue polarity in 3D by preventing integration of microenvironmental signals. Oncotarget. 2013;4:2010–2020. doi: 10.18632/oncotarget.1451. [DOI] [PMC free article] [PubMed] [Google Scholar]
- 6.Nam JM, Ahmed KM, Costes S, Zhang H, Onodera Y, Olshen AB, Hatanaka KC, Kinoshita R, Ishikawa M, Sabe H. β1-integrin via NF-κB signaling is essential for acquisition of invasiveness in a model of radiation treated in situ breast cancer. Breast Cancer Res. 2013;15(4):R60. doi: 10.1186/bcr3454. [DOI] [PMC free article] [PubMed] [Google Scholar]
- 7.Bowe RA, Cox OT, Ayllón V, Tresse E, Healy NC, Edmunds SJ, Huigsloot M, O'Connor R. PDLIM2 regulates transcription factor activity in epithelial-to-mesenchymal transition via the COP9 signalosome. Mol Biol Cell. 2014;25(1):184–195. doi: 10.1091/mbc.E13-06-0306. [DOI] [PMC free article] [PubMed] [Google Scholar]
- 8.Tanaka T, Soriano MA, Grusby MJ. SLIM is a nuclear ubiquitin E3 ligase that negatively regulates STAT signaling. Immunity. 2005;22(6):729–736. doi: 10.1016/j.immuni.2005.04.008. [DOI] [PubMed] [Google Scholar]
- 9.Healy NC, O'Connor R. Sequestration of PDLIM2 in the cytoplasm of monocytic/macrophage cells is associated with adhesion and increased nuclear activity of NF-κB. J Leukoc Biol. 2009;85(3):481–490. doi: 10.1189/jlb.0408238. [DOI] [PubMed] [Google Scholar]
- 10.Torrado M, Senatorov VV, Trivedi R, Fariss RN, Tomarev SI. Pdlim2, a novel PDZ-LIM domain protein, interacts with α-actinins and filamin A. Invest Ophthalmol Vis Sci. 2004;45(11):3955–3963. doi: 10.1167/iovs.04-0721. [DOI] [PubMed] [Google Scholar]
- 11.Loughran G, Healy NC, Kiely PA, Huigsloot M, Kedersha NL, O'Connor R. Mystique is a new insulin-like growth factor-I-regulated PDZ-LIM domain protein that promotes cell attachment and migration and suppresses anchorage-independent growth. Mol Biol Cell. 2005;16(4):1811–1822. doi: 10.1091/mbc.E04-12-1052. [DOI] [PMC free article] [PubMed] [Google Scholar]
- 12.Loughran G, Huigsloot M, Kiely PA, Smith LM, Floyd S, Ayllon V, O'Connor R. Gene expression profiles in cells transformed by overexpression of the IGF-I receptor. Oncogene. 2005;24(40):6185–6193. doi: 10.1038/sj.onc.1208772. [DOI] [PubMed] [Google Scholar]
- 13.Qu Z, Fu J, Yan P, Hu J, Cheng S-Y, Xiao G. Epigenetic repression of PDZ-LIM domain-containing protein 2. J Biol Chem. 2010;285(16):11786–11792. doi: 10.1074/jbc.M109.086561. [DOI] [PMC free article] [PubMed] [Google Scholar]
- 14.Qu Z, Yan P, Fu J, Jiang J, Grusby MJ, Smithgall TE, Xiao G. DNA methylation-dependent repression of PDZ-LIM domain-containing protein 2 in colon cancer and its role as a potential therapeutic target. Cancer Res. 2010;70(5):1766–1772. doi: 10.1158/0008-5472.CAN-09-3263. [DOI] [PMC free article] [PubMed] [Google Scholar]
- 15.Macartney-Coxson D, Hood K, Shi H-J, Ward T, Wiles A, O'Connor R, Hall D, Lea R, Royds J, Stubbs R. Metastatic susceptibility locus, an 8p hot-spot for tumour progression disrupted in colorectal liver metastases: 13 candidate genes examined at the DNA, mRNA and protein level. BMC Cancer. 2008;8(1):187. doi: 10.1186/1471-2407-8-187. [DOI] [PMC free article] [PubMed] [Google Scholar]
- 16.Vanoirbeek E, Eelen G, Verlinden L, Carmeliet G, Mathieu C, Bouillon R, O'Connor R, Xiao G, Verstuyf A. PDLIM2 expression is driven by vitamin D and is involved in the pro-adhesion, and anti-migration and -invasion activity of vitamin D. Oncogene. 2013;33(15):1904–1911. doi: 10.1038/onc.2013.123. [DOI] [PubMed] [Google Scholar]
- 17.Kao J, Salari K, Bocanegra M, Choi YL, Girard L, Gandhi J, Kwei KA, Hernandez-Boussard T, Wang P, Gazdar AF. Molecular profiling of breast cancer cell lines defines relevant tumor models and provides a resource for cancer gene discovery. PLoS One. 2009;4(7):e6146. doi: 10.1371/journal.pone.0006146. [DOI] [PMC free article] [PubMed] [Google Scholar]
- 18.BreastMark: Breast Cancer Survival Analysis Tool. http://glados.ucd.ie/BreastMark/index.html
- 19.Debnath J, Muthuswamy SK, Brugge JS. Morphogenesis and oncogenesis of MCF-10A mammary epithelial acini grown in three-dimensional basement membrane cultures. Methods. 2003;30(3):256–268. doi: 10.1016/s1046-2023(03)00032-x. [DOI] [PubMed] [Google Scholar]
- 20.Liu H, Radisky DC, Wang F, Bissell MJ. Polarity and proliferation are controlled by distinct signaling pathways downstream of PI3-kinase in breast epithelial tumor cells. J Cell Biol. 2004;164(4):603–612. doi: 10.1083/jcb.200306090. [DOI] [PMC free article] [PubMed] [Google Scholar]
- 21.Mailleux AA, Overholtzer M, Brugge JS. Lumen formation during mammary epithelial morphogenesis: insights from in vitro and in vivo models. Cell Cycle. 2008;7(1):57–62. doi: 10.4161/cc.7.1.5150. [DOI] [PubMed] [Google Scholar]
- 22.Vidi P-A, Bissell M, Lelièvre S. Three-dimensional culture of human breast epithelial cells: the how and the why. In: Randell SH, Fulcher ML, editors. vol. 945. Humana Press; New York, USA: 2013. pp. 193–219. (Epithelial Cell Culture Protocols). [DOI] [PMC free article] [PubMed] [Google Scholar]
- 23.Jenei V, Deevi RK, Adams CA, Axelsson L, Hirst DG, Andersson T, Dib K. Nitric oxide produced in response to engagement of β2 integrins on human neutrophils activates the monomeric GTPases Rap1 and Rap2 and promotes adhesion. J Biol Chem. 2006;281(46):35008–35020. doi: 10.1074/jbc.M601335200. [DOI] [PubMed] [Google Scholar]
- 24.Kiely PA, Sant A, O'Connor R. RACK1 is an insulin-like growth factor 1 (IGF-1) receptor-interacting protein that can regulate IGF-1-mediated Akt activation and protection from cell death. J Biol Chem. 2002;277(25):22581–22589. doi: 10.1074/jbc.M201758200. [DOI] [PubMed] [Google Scholar]
- 25.Kiely PA, O'Gorman D, Luong K, Ron D, O'Connor R. Insulin-like growth factor I controls a mutually exclusive association of RACK1 with protein phosphatase 2A and β1 integrin to promote cell migration. Mol Cell Biol. 2006;26(11):4041–4051. doi: 10.1128/MCB.01868-05. [DOI] [PMC free article] [PubMed] [Google Scholar]
- 26.Irie HY, Pearline RV, Grueneberg D, Hsia M, Ravichandran P, Kothari N, Natesan S, Brugge JS. Distinct roles of Akt1 and Akt2 in regulating cell migration and epithelial-mesenchymal transition. J Cell Biol. 2005;171(6):1023–1034. doi: 10.1083/jcb.200505087. [DOI] [PMC free article] [PubMed] [Google Scholar]
- 27.Kim HJ, Litzenburger BC, Cui X, Delgado DA, Grabiner BC, Lin X, Lewis MT, Gottardis MM, Wong TW, Attar RM. Constitutively active type I insulin-like growth factor receptor causes transformation and xenograft growth of immortalized mammary epithelial cells and is accompanied by an epithelial-to-mesenchymal transition mediated by NF-κB and snail. Mol Cell Biol. 2007;27(8):3165–3175. doi: 10.1128/MCB.01315-06. [DOI] [PMC free article] [PubMed] [Google Scholar]
- 28.Lakshman N, Kim A, Bayless KJ, Davis GE, Petroll WM. Rho plays a central role in regulating local cell-matrix mechanical interactions in 3D culture. Cell Motil Cytoskeleton. 2007;64(6):434–445. doi: 10.1002/cm.20194. [DOI] [PubMed] [Google Scholar]
- 29.Debnath J, Walker SJ, Brugge JS. Akt activation disrupts mammary acinar architecture and enhances proliferation in an mTOR-dependent manner. J Cell Biol. 2003;163(2):315–326. doi: 10.1083/jcb.200304159. [DOI] [PMC free article] [PubMed] [Google Scholar]
- 30.van Miltenburg MHAM, Lalai R, de Bont H, van Waaij E, Beggs H, Danen EHJ, van de Water B. Complete focal adhesion kinase deficiency in the mammary gland causes ductal dilation and aberrant branching morphogenesis through defects in Rho kinase-dependent cell contractility. FASEB J. 2009;23(10):3482–3493. doi: 10.1096/fj.08-123398. [DOI] [PubMed] [Google Scholar]
- 31.Faurobert E, Rome C, Lisowska J, Manet-Dupé S, Boulday G, Malbouyres M, Balland M, Bouin A-P, Kéramidas M, Bouvard D. CCM1/ICAP-1 complex controls β1 integrin-dependent endothelial contractility and fibronectin remodelling. J Cell Biol. 2013;202(3):545–561. doi: 10.1083/jcb.201303044. [DOI] [PMC free article] [PubMed] [Google Scholar]
- 32.Goel HL, Underwood JM, Nickerson JA, Hsieh C-C, Languino LR. β1 integrins mediate cell proliferation in three-dimensional cultures by regulating expression of the sonic hedgehog effector protein, GLI1. J Cell Physiol. 2010;224(1):210–217. doi: 10.1002/jcp.22116. [DOI] [PMC free article] [PubMed] [Google Scholar]
- 33.Huang C, Park CC, Hilsenbeck SG, Ward R, Rimawi MF, Wang YC, Shou J, Bissell MJ, Osborne CK, Schiff R. β1 integrin mediates an alternative survival pathway in breast cancer cells resistant to lapatinib. Breast Cancer Res. 2011;13(4):R84. doi: 10.1186/bcr2936. [DOI] [PMC free article] [PubMed] [Google Scholar]
- 34.Sayeed A, Alam N, Trerotola M, Languino LR. Insulin-like growth factor 1 stimulation of androgen receptor activity requires β1A integrins. J Cell Physiol. 2012;227(2):751–758. doi: 10.1002/jcp.22784. [DOI] [PMC free article] [PubMed] [Google Scholar]
- 35.Hermanto U, Zong CS, Li W, Wang L-H. RACK1, an insulin-like growth factor I (IGF-I) receptor-interacting protein, modulates IGF-I-dependent integrin signaling and promotes cell spreading and contact with extracellular matrix. Mol Cell Biol. 2002;22(7):2345–2365. doi: 10.1128/MCB.22.7.2345-2365.2002. [DOI] [PMC free article] [PubMed] [Google Scholar]
- 36.Kiely PA, Leahy M, O'Gorman D, O'Connor R. RACK1-mediated integration of adhesion and insulin-like growth factor I (IGF-I) signaling and cell migration are defective in cells expressing an IGF-I receptor mutated at tyrosines 1250 and 1251. J Biol Chem. 2005;280(9):7624–7633. doi: 10.1074/jbc.M412889200. [DOI] [PubMed] [Google Scholar]
- 37.Zhang W, Zong CS, Hermanto U, Lopez-Bergami P, Ze Ronai, Wang L-H. RACK1 recruits STAT3 specifically to insulin and insulin-like growth factor 1 receptors for activation, which is important for regulating anchorage-independent growth. Mol Cell Biol. 2006;26(2):413–424. doi: 10.1128/MCB.26.2.413-424.2006. [DOI] [PMC free article] [PubMed] [Google Scholar]
- 38.Kiely PA, Baillie GS, Lynch MJ, Houslay MD, O'Connor R. Tyrosine 302 in RACK1 is essential for insulin-like growth factor-I-mediated competitive binding of PP2A and β1 integrin and for tumor cell proliferation and migration. J Biol Chem. 2008;283(34):22952–22961. doi: 10.1074/jbc.M800802200. [DOI] [PubMed] [Google Scholar]
- 39.Kiely PA, Baillie GS, Barrett R, Buckley DA, Adams DR, Houslay MD, O'Connor R. Phosphorylation of RACK1 on tyrosine 52 by c-Abl is required for insulin-like growth factor I-mediated regulation of focal adhesion kinase. J Biol Chem. 2009;284(30):20263–20274. doi: 10.1074/jbc.M109.017640. [DOI] [PMC free article] [PubMed] [Google Scholar]
- 40.Litzenburger BC, Kim HJ, Kuiatse I, Carboni JM, Attar RM, Gottardis MM, Fairchild CR, Lee AV. BMS-536924 reverses IGF-IR-induced transformation of mammary epithelial cells and causes growth inhibition and polarization of MCF7 cells. Clin Cancer Res. 2009;15(1):226–237. doi: 10.1158/1078-0432.CCR-08-0801. [DOI] [PMC free article] [PubMed] [Google Scholar]
- 41.Tanaka T, Grusby M, Kaisho T. PDLIM2-mediated termination of transcription factor NF-κB activation by intranuclear sequestration and degradation of the p65 subunit. Nat Immunol. 2007;8:584–591. doi: 10.1038/ni1464. [DOI] [PubMed] [Google Scholar]
Associated Data
This section collects any data citations, data availability statements, or supplementary materials included in this article.
Supplementary Materials
Supplementary materials