

Abstract
Hepatocellular carcinoma is the fifth most common solid cancer worldwide. Sorafenib, a small multikinase inhibitor, is the only approved therapy for advanced HCC. The clinical benefit of sorafenib is offset by the acquisition of sorafenib resistance. Understanding of the molecular mechanism of STAT3 overexpression in sorafenib resistance is critical if the clinical benefits of this drug are to be improved. In this study, we explored our hypothesis that loss of RFX-1/SHP-1 and further increase of p-STAT3 as a result of sorafenib treatment induces sorafenib resistance as a cytoprotective response effect, thereby, limiting sorafenib sensitivity and efficiency. We found that knockdown of RFX-1 protected HCC cells against sorafenib-induced cell apoptosis and SHP-1 activity was required for the process. SC-2001, a molecule with similar structure to obatoclax, synergistically suppressed tumor growth when used in combination with sorafenib in vitro and overcame sorafenib resistance through up-regulating RFX-1 and SHP-1 resulting in tumor suppression and mediation of dephosphorylation of STAT3. In addition, sustained sorafenib treatment in HCC led to increased p-STAT3 which was a key mediator of sorafenib sensitivity. The combination of SC-2001 and sorafenib strongly inhibited tumor growth in both wild-type and sorafenib-resistant HCC cell bearing xenograft models. These results demonstrate that inactivation of RFX/SHP-1 induced by sustained sorafenib treatment confers sorafenib resistance to HCC through p-STAT3 up-regulation. These effects can be overcome by SC-2001 through RFX-1/SHP-1 dependent p-STAT3 suppression. In conclusion, the use of SC-2001 in combination with sorafenib may constitute a new strategy for HCC therapy.
Introduction
Hepatocellular carcinoma (HCC) is a leading cause of death worldwide [1], [2]. Most HCC patents are diagnosed at the late stage of HCC, when existing therapies are ineffective. Traditional chemotherapy has a limited effect on HCC patient survival. Sorafenib, a multikinase inhibitor with a phenylurea structure, is the first and only targeted drug therapy approved by the FDA for the treatment of patients with HCC [3]. In HCC, sorafenib targets several kinases, such as Raf, VEGFR, PDGFR [4], [5], [6], [7]. Although sorafenib showed survival benefit in a phase III clinical study, it only prolonged survival from a median of 7.9 to 10.7 months. Apart from the complex heterogeneity of HCC that may hamper the effect of sorafenib, acquisition of resistance to sorafenib is an emerging clinical problem and potentially manageable [8], [9]. Therefore, it is important to elucidate the molecular mechanisms of sorafenib resistance, and develop new drugs that improve sorafenib response.
STAT3 is associated with chemotherapy failure [10], [11], [12], and a selection of angiogenic, invasive [13] and resistant clones. Because of unsatisfactory results with DNA alkylating or intercalating drugs, protein drugs have been widely studied in many cancers. However, their efficacy is often short-lived, and treatment is often accompanied by acquired resistance, which may be due to the activation of STAT3 which turns on survival pathways that reverse the therapeutic effect [14], [15]. Our previous studies have indicated that TRAIL induced an apoptotic effect in HCC cells depending on the level of p-STAT3 [16]. In addition, sorafenib resistant HCC cells (Huh7 SR-1 and SR-2) exhibited higher levels of expression of p-STAT3 than sensitive cells [17]. Here, we hypothesized that STAT3 induced by escalation of sorafenib in HCC cells over a long period of time may restrict the effect of sorafenib in HCC. If so, targeting STAT3 in sorafenib resistant cells with a “sensitizer” could conceivably constitute a strategy for the complete suppression of HCC growth through sorafenib therapy.
SC-2001, a small molecule with a structure similar to obatoclax, has been shown to block protein-protein interaction between members of the anti-apoptotic Bcl-2 family and the pro-apoptotic Bcl-2 family [18]. Our previous studies showed that SC-2001 is able to enhance SHP-1 expression and further repress STAT3 phosphorylation in HCC cells [19]. SHP-1, a members of the Src homology 2 (SH2)-domain containing tyrosine phosphatase family, is one of the protein tyrosine phosphatases that can deactivate STAT3 signaling through direct dephosphorylation of p-STAT3 (Tyr 705) [20], [21], [22]. In addition, SHP-1 is a negative regulator of several signaling pathways involved in cancers [23], [24], and it can be regulated by several transcription factors [25], [26]. RFX-1 is a transcription factor that has been reported to positively modulate SHP-1 expression in breast cancer [27]. However, the regulation of SHP-1 in HCC is far from clear. In this study we used HCC cells and xenograft models to explore whether up-regulation of STAT3 induced by sorafenib treatment over a long period of time could lead to sorafenib resistance, and tested whether SC-2001 could overcome such resistance by activation of RFX-1/SHP-1 and repression of STAT3.
Materials and Methods
Synthesis, Purification, and Characterization of SC-2001
SC-2001 ((Z)-2-((3-methoxy-2H-pyrrol-2-ylidene)methyl)-1H-pyrrole) compounds were synthesized and purified in the medicinal chemistry laboratory at the Institute of Biopharmaceutical Sciences, National Yang-Ming University, Taiwan. The detailed synthetic process has been described in our previous study. SC-2001 compounds were subjected to nuclear magnetic resonance and mass spectrometry for structure and molecular weight characterization. The molecular weight of SC-2001 calculated by high-resolution mass spectrometry for C18H14BrN3O (M+H+) was 368.0393.
Cell Culture and Antibodies
The Huh7 HCC cell line was obtained from the Health Science Research Resources Bank (HSRRB; Osaka, Japan; JCRB0403). The PLC/PRF/5 (PLC5) cell lines were obtained from American Type Culture Collection (ATCC). All cells obtained from HSRRB or ATCC were immediately expanded and frozen down such that all cell lines could be restarted every 3 months from a frozen vial of the same batch of cells. No further authentication was conducted in our laboratory. Cells were maintained in Dulbecco’s Modified Eagle’s Medium (DMEM) supplemented with 10% FBS, 100 units/mL penicillin G, 100 mg/mL streptomycin sulfate, and 25 mg/mL amphotericin B in a humidified incubator at 37 °C in an atmosphere of 5% CO2 in air. Results from all in vitro studies were confirmed in at least three independent experiments to verify results. Antibodies for immunoblotting such as p-STAT3(Tyr705), STAT3, survivin, caspase-3 and caspase-9 were from Cell Signaling (Danvers, MA). SHP-1, cyclin D1 and Mcl-1 antibodies were purchased form Abcam (Cambrige, MA). RFX-1 antibody was purchased from Novus Biologicals (Colorado, USA).
Development of Sorafenib Resistant Huh7 Cells
The human HCC cell line Huh7 was exposed to sorafenib from low dose (2.5 μM) and when cells stably grew then started to change to the higher dosage of sorafenib (5, 7.5, and then 10 μM). Medium containing sorafenib was replaced every two days for three months. In the ends, the cells could grow slowly in medium containing 10 μM sorafenib (a clinically relevant dose). The sorafenib resistant cells (Huh7 R1 and Huh7 R3) were routinely maintained under constant culture condition containing sorafenib.
Apoptosis Analysis
The following two methods were used to assess drug induced apoptotic cell death: measurement of apoptotic cells by cell death detection ELISA for cytoplasmic histone-associated DNA fragments (Roche), and Western blot analysis for caspase-3 and -9 cleavage. Release of oligonucleosomes into the cytoplasm was quantified by cell death ELISA.
Preparation of Nuclear Extracts and Cytosolic Extracts
Nuclear extracts were prepared using NE-PER nuclear and cytoplasmic extraction reagent according to the manufacturer’s instructions (Pierce Biotechnology). Briefly, 1 × 10⁶ cells were trypsinized, followed by lysing in 200 mL CERI buffer. After the lysates were vortexed for 15 s and incubated on ice for 10 min, 11 mL of CERII was added. The lysates were vortexed for 5 s, incubated on ice for 1 min, and vortexed again for 5 s. The nuclei were pelleted at 16,000 g at 4 °C for 5 min, and the cytoplasmic extracts were removed and collected. Nuclei were resuspended in 25 ml nuclei extraction buffer and vortexed 15 s. The nuclei were extracted on ice and vortexed for 15 s every 10 min, for a total of 40 min. The extracts were centrifuged at 16,000g at 4 °C for 5 min and the supernatant was collected as nuclear extract. Protein concentration was determined by BCA Protein Assay using BSA as a standard (Pierce Biotechnology).
Chromatin Immunoprecipitation (CHIP) Assay
CHIP assay was performed according to the protocol provided with the EZ ChIP chromatin immunoprecipitation and EZ-Zyme Chromatin prep kit (Upstate Biotechnology, Lake Placid, NY). Briefly, after cross-linking with 17.5% paraformaldehyde, PLC5 cells were washed with phosphate-buffered saline and lysed in lysis buffer. The DNA was fragmented to about 200–500 base pairs by the EZ-Zyme. Approximately 5 × 10⁶ cells were used per CHIP assay and the resulting DNA fragments were incubated with 2 μg RFX1 antibodies, which were generated from rabbit, or nonspecific rabbit IgG (Millipore). The immunoprecipitated products were washed sequentially with low-salt immune complex wash buffer, high-salt immune complex wash buffer, LiCl immune complex wash buffer, and twice with TE buffer. The chromatin was eluted from the agarose by incubating with elution buffer (1% SDS, 100mM NaHCO3); and the DNA–protein complexes were reversely cross-linked by high-salt solution containing 200 mM NaCl at 65 °C for at least 5 h. To eliminate contamination of proteins and RNAs, the mixture was treated with 10 mg RNase A at 37 °C for 30 min and then treated with protease K for 2 h at 45 °C. Finally, the precipitated DNA was recovered using the spin column provided in the ChIP kit, and eluted with 50 ml elution buffer. PCR reaction was conducted using Taq DNA polymerase (MyTaq). Two microliters of the precipitated DNA was used as template. The sequences of the primers used in the ChIP assay were as follows: 5′-CCTCTTGCAGGTGTCCTTAAG-3′,and 5′-TGGAAAGGCAGAGGGAATCAG-3′.
Dual Luciferase Assay
After transfection with firefly luciferase reporter construct and reference pCMV-renilla luciferase plasmid for 48 h, cells were collected and lysed with passive lysis buffer. The lysate was placed into glass tube and promoter activity was analyzed by dual luciferase assay according to the instruction manual.
Gene Knockdown using siRNA
Smart-pool small interfering RNAs (siRNAs), including the control (D-001810-10), SHP-1, and RFX-1, were purchased from Dharmacon (Chicago, IL). The knockdown procedure was as described previously [21]. Briefly, Huh7 R1 and R3 cells were transfected with siRNAs against the phosphatases given above or the control sequence for 48 hours and then treated with SC-2001 at the indicated concentrations. The cell extracts were analyzed by western blot.
Generation of PLC5 cells with Stable Knockdown of RFX-1
The RFX-1 silencing stable cell line, PLC5-shRFX-1, was obtained by transfection of HuSH-shRNA-GFP cloning vector (pGFP-V-RS) or HuSH-shRFX-1-GFP cloning vector (pGFP-V-RS-shRFX-1) into PLC5 cells using Dharmafect 4 transfection reagent (Thermo Scientific). Two days post-transfection, the PLC5-sh-control (sh-vector clone 1 and 2) and the PLC5-sh-RFX-1 (sh-RFX-1 clone 1: TGCGGCTGATGGAGGACCAGCAGCACATG and sh-RFX-1 clone 2: CCTCAAGTGGTCCTTCTACAGCTCCATGG) cells were selected and placed in medium containing 1.5 μg/ml puromycin for 2 weeks. Cells were routinely maintained under constant culture conditions. Control and shRNA plasmids were purchased from Origene.
STAT3 Reporter Assay
Huh7 R1 and R3 cells were seeded in a 96-well plate and co-transfected with reference pCMV-renilla luciferase plasmid with a plasmid driven by the promoter region containing STAT3-specific binding sites. After incubation for 48 h, the cells were treated with SC-2001 for 6 h and lysed with passive buffer. The lysates were transferred to a glass tube and promoter activity was determined by dual luciferase assay according to the manufacturer’s instructions. The STAT3 Reporter Kit was purchased from SABiosciences.
Determination of Synergism
Drug synergism was determined using the Chou and Talalay method[28] and the software package CompuSyn (Biosoft). A combination index (CI) value of less than 1 was defined as synergism [17].
SHP-1 Phosphatase Activity
A RediPlate 96 EnzChek Tyrosine Phosphatase Assay Kit (R-22067) was used for the SHP-1 activity assay (Molecular Probes, Carlsbad, CA). The method was as described previously [16].
Colony Formation Assay
Huh7 R1 and R3 cells were seeded in 6-well plates (~ 1000-5000 cells per well) and subjected to the indicated treatments, with the drug being removed to terminate the treatment. Two weeks later, plates were washed in PBS, fixed with 100% methanol and stained with a filtered solution of crystal violet (5% w/v). After washing with tap water, the colonies were counted both manually and digitally using a ColCount TM plate reader (Oxford Optronics, Oxford, England).
Immunofluorescence
Huh7 R1 and R3 cells were seeded at a density of 2 × 10⁵ cells/well on glass coverslips in 6-well plates two days prior to experimental manipulation. For immunofluorescence staining of RFX-1, cells grown on coverslips were washed twice with cold PBS, fixed with ice-cold methanol for 10 min at -20 °C, and permeabilized with 0.5% (v/v) Triton X-100 in PBS for 5 min at room temperature, followed by incubation with blocking solution for 1 h at room temperature. Coverslips were incubated with primary antibodies against human RFX-1 (Novus Biologicals) for 1 h at 37 °C, washed with PBST (0.2% Tween 20 in PBS), and subsequently incubated with rabbit secondary antibody conjugated with rhodamine for 30 min at room temperature. Afterwards, the coverslips were washed and mounted with fluorescent mounting medium (Dako). Fluorescence images will be taken with Zeiss LSM 510 confocal microscope scanning.
Real-time PCR (QPCR)
Total RNA was isolated from cell lines with TRIzol (Invitrogen) and cDNA was prepared from 2 mg of RNA using a First-Strand cDNA Synthesis Kit according to the manufacturer’s instructions (Amersham Biosciences, Amersham, UK). Oligonucleotide sequences were as follows: SHP-1, 5′-GCC CAG TTC ATT GAA ACC AC- 3′ (sense) and 5′-GAGGGAACCCTTGCTCTTCT-3′ (antisense); GAPDH, 5′-CGACCACTTTGTCAAGCTCA-3′(sense) and 5′-AGGGGTCTACATGGCAAC TG-3′ (antisense); RFX-1: 5′-CGGCAAGCACCAGCTACTAC-3′ (sense) and 5′-GGACACGTACATGGGCATGG-3′ (antisense). For QPCR, thermocycling was performed in a final volume of 20 μl containing 2.5 μl of cDNA sample, 200 nM of each of the primers, and 6.5 μl of SYBR Green I Master Mix (Roche) with Roche LightCycler 480 sequence detection system (RocheApplued Science, Foster, California). The following PCR conditions were used: denaturation at 95 °C for 10 min followed by 35 cycles of 94 °C for 1 min, annealing for 1 min at 57 °C, and elongation for 1 min at 72 °C, and a final elongation step at 72 °C for 10 min. Expression levels of genes of interest were normalized to that of GAPDH in the same sample.
Xenograft Tumor Growth
Male NCr athymic nude mice (5-7 weeks of age) were obtained from the National Laboratory Animal Center (Taipei, Taiwan). When Huh7 and Huh7-resistant tumors (Huh7 R3) reached 100 mm3, mice received sorafenib (10 mg/kg) and/or SC-2001 (10 mg/kg) orally (every other day). Controls received vehicle.
Clinical Specimens
The liver tissues from 11 HBV and HCV negative male HCC patients collected in the Taiwan Liver Cancer Network (TLCN) were included in this study. The HCC samples were used for examining the relationship between RFX-1 and SHP-1 mRNA expression clinically. The Institutional Review Board of National Yang-Ming University approved the use of these archived tissues.
Statistical Analysis
Data are expressed as mean ± SD or SE. Statistical comparisons were based on nonparametric tests and statistical significance was defined as P < 0.05. All statistical analyses were performed using SPSS for Windows version 12.0 software (SPSS, Chicago, IL).
Results
RFX-1 Contributes to the Growth Inhibition Effect of Sorafenib in HCC Cells
To figure out the importance between RFX-1 and sorafenib in HCC cells, we first tested its growth effect in PLC-5 cells. In agreement with previous reports [21], [29], sorafenib showed high levels of growth inhibition at 10 μM. Next, to test our hypothesis that RFX-1 plays a role in cell proliferation, we knocked down RFX-1 in PLC-5 cells and explored the drug effect of sorafenib at various doses. By the sh-RNA technique, we generated two RFX-1 knockdown-PLC5 clones by transfecting two different sh-RFX-1 plasmids. As shown in Figure 1A, left, treatment of RFX-1 knockdown-PLC-5 cells (both in sh-RFX-1 clone 1 and 2) with sorafenib at 10 μM significantly decreased growth inhibition in comparison with vector control PLC-5 (sh-vector clone 1 and 2), indicating that RFX-1 might be involved in the activity of sorafenib. The protein expressions of RFX-1, SHP-1, and p-STAT3 in two RFX-1 knockdown-PLC5 cells were confirmed by western blot. The protein expressions of RFX-1 and SHP-1 were decreased in two RFX-1-silencing PLC5 clones compared to the vector control cells. In addition, p-STAT3 expression was increased after RFX-1 was knockdown in PLC5 cells (Figure 1A, right). Furthermore, we established two sorafenib-resistant Huh7 cell lines (Huh7 R1 and R3) by treatment with sorafenib at 2.5 μM escalating to 10 μM over a long period of time. As shown in Figure 1B, left, both Huh7 R1 and R3 cells had lower expressions of RFX-1 and SHP-1 compare to wild-type cells, whereas p-STAT3 showed a reverse effect in these two cell lines. Here, we did not find obviously difference in STAT5 phosphorylation which is another STAT family protein (Supplementary Figure 1). This result suggested that RFX-1 and SHP-1 are two key factors regulating the contribution of STAT3 to sorafenib-resistance in HCC cells. In addition, to further determine the regulatory role of RFX-1 in SHP-1 modulation in sorafenib-resistance HCC cells, we next isolated the nuclear protein extracts of wild type Huh7, Huh7 R1, and Huh7 R3 cells. As shown in Figure 1B, middle, Huh7 R1 and Huh7 R3 cells displayed lower expressions of nuclear RFX-1 compared to wild type Huh7 cells, furthermore, based on our chromatin immunoprecipitation (CHIP) results, decreased RFX-1 binding to the SHP-1 promoter was observed in Huh7 R1 and Huh7 R3 cells (Figure 1B, right). These results implied that SHP-1 is transcriptionally mediated by RFX-1 in sorafenib-resistance HCC cells, and decreased RFX-1 expression is associated with increased resistance of HCC cells to sorafenib.
Figure 1.
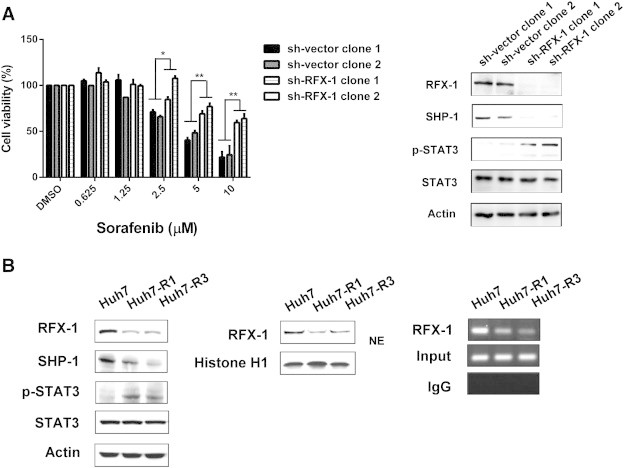
RFX-1 contributes to the growth inhibition effect of sorafenib in HCC cells. (A) Left, The cell proliferation of PLC5 sh-Vector (sh-vector clone 1 and 2) and sh-RFX-1 (sh-RFX-1 clone 1 and 2) cells were analyzed by MTT assay under sorafenib treatment. *P < 0.05, **P < 0.01. Right, The protein levels of RFX-1, SHP-1, and p-STAT3 in PLC5 sh-Vector (sh-vector clone 1 and 2) and sh-RFX-1 (sh-RFX-1 clone 1 and 2) cells were determined by western blot. Actin was used as a loading control. (B) Left, The protein levels of RFX-1, SHP-1, and p-STAT3 in Huh7 WT, R1, and R3 cells were determined by western blot. Actin was used as a loading control. Middle, The levels of nuclear extraction of RFX-1 in Huh7 WT, R1, and R3 cells were measured by western blot. Right, Chromatin immunoprecipitation assay was performed in Huh7 WT, R1, and R3 cells. The crude lysates from WT, R1, and R3 cells were immunoprecipitated, respectively, with RFX-1 antibody and rabbit IgG control and captured by protein A-agarose beads. The precipitated DNA fragments were amplified by PCR to detect fragments in SHP-1 promoter containing the RFX-1 binding site.
SC-2001 Overcomes Sorafenib Resistance in HCC Cells by Enhancing cell Viability, Inhibition and Apoptosis
To gain a better understanding of the effect of SC-2001 on sorafenib-resistant cells, we determined the cell viability and apoptotic effect of SC-2001 treatment in Huh7 R1 and R3 cells. As shown in Figure 2A, top, sorafenib did not induce DNA fragmentation in Huh7 R1 and R3 cells. As our previous result showed that SC-2001 inhibited p-STAT3 in HCC cells through activating SHP-1 expression, we next explored the effect of SC-2001 in sorafenib resistant cells. As shown in Figure 2A, bottom, SC-2001 obviously induced DNA fragmentation in both Huh7 R1 and Huh7 R3 cells. Furthermore, as shown in Figure 2B, SC-2001 attenuated cell growth in Huh7 R1 and Huh7 R3 cells in a dose dependent manner starting at dosages of 1.25 μM. In addition, SC-2001 showed significant inhibition in these two sorafenib-resistant cell lines as measured by colongenic assay (Figure 2C). Notably, by analyzing the protein expression of caspase-3 and caspase-9, we proved that SC-2001 can induce higher expressions of cleaved caspase-3 and caspase-9, indicating that SC-2001 obviously led to more apoptosis than sorafenib in resistant cells (Figure 2D). These results suggested that SC-2001 has potent effect on sorafenib-resistance HCC cells.
Figure 2.
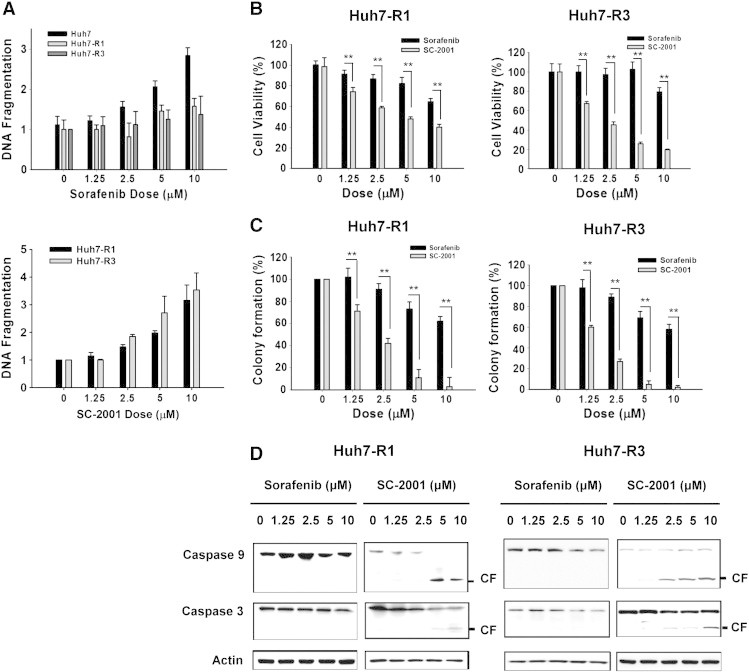
SC-2001 overcomes sorafenib resistance in HCC cells by enhancing cell viability, inhibition and apoptosis. (A) Top, DNA fragmentation assay was performed in Huh7 WT, R1, and R3 cells undergoing sorafenib treatment at different dosages. Bottom, DNA fragmentation assay was performed in Huh7 R1 and Huh7 R3 cells undergoing SC-2001 treatment at different dosages. (B) Huh7 R1 (left) and Huh7 R3 (right) cells were treated, respectively, with sorafenib and SC-2001 in dose dependent manner for 48 h. Cell viability was measured by MTT assay. **P < 0.01. (C) Huh7 R1 (left) and Huh7 R3 (right) cells were treated, respectively, with sorafenib and SC-2001 in dose dependent manner for 48 h. After treatment, the cells were seeded onto 6-well plates for colony formation assay. After 2 weeks, the cells were stained with crystal violet and the colonies were counted. **P < 0.01. (D) The protein levels of caspase-3 and caspase-9 were determined by western blot after Huh7 R1 and Huh7 R3 cells were exposed to sorafenib and SC-2001 for 48 h. Actin was used as a loading control.
Induction of RFX-1/SHP-1 by SC-2001 Pa role in Overcoming STAT3 Dependent Sorafenib Resistance in HCC Cells
Next, to investigate the effect of SC-2001 on the activity of p-STAT3 in sorafenib-resistant cells, we examined p-STAT3 and its downstream signaling molecules such as Mcl-1, survivin, and cyclin D1, upon SC-2001 treatment. As shown in Figure 3A, SC-2001 treatment resulted in down-regulation of p-STAT3 and its targets in a dose-escalation manner in sorafenib-resistant cells. Next, we applied an ELISA to confirm the effect of SC-2001 on p-STAT3. As shown in Figure 3B, left, SC-2001 suppressed STAT3 activity starting at doses of 1 μM. To examine whether SC-2001 could decrease the transcriptional activity of STAT3, a reporter assay was conducted. The result showed that SC-2001 inhibited the transcriptional activity of STAT3 in a dose dependent manner (Figure 3B, right). The level of SHP-1 was also investigated in order to elucidate the mechanism by which SC-2001 regulates STAT3. SC-2001 treatment caused a dose-dependent increase of SHP-1 both at the protein and mRNA levels (Figure 3C), indicating that SC-2001-regulated SHP-1 expression at the transcription level in sorafenib resistant cells. In addition, one of the transcription factors of SHP-1, RFX-1, was correlated with SHP-1 expression upon SC-2001 treatment. Therefore, we investigated whether SC-2001 enhanced RXF-1 translocation from the cytosol to the nuclei to activate SHP-1. The results showed that RFX-1 in the presence of SC-2001 was imported into the nuclei. In addition, based on the results of immunofluorescence, we also demonstrated that SC-2001 could enhance the nuclear translocation of RFX-1 (Figure 3D). Moreover, the CHIP assay results revealed that RFX-1 bound to SHP-1 promoter under SC-2001 in a dose dependent manner (Figure 3E). These results showed that SC-2001 treatment changed the nuclear localization of RFX-1 whose nuclear accumulation is involved in SHP-1 transcription activity leading to the reduction of STAT3 and restoring sensitivity in sorafenib-resistant cells.
Figure 3.
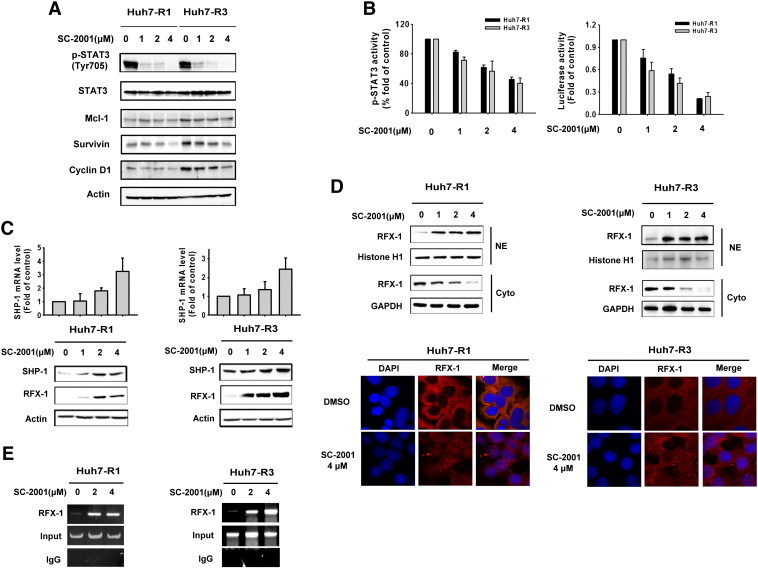
Induction of RFX-1/SHP-1 by SC-2001 plays a role in overcoming STAT3 dependent-sorafenib-resistance in HCC cells. (A) Huh7 R1 and R3 cells were exposed to SC-2001 in dose dependent manner for 24 h. The cell lysates were subjected to western blot analysis with p-STAT3, Mcl-1, survivin, and cyclin D1 antibodies to analyze protein levels. Actin was used as a loading control. (B) Left, STAT3 activity ELISA was performed in Huh7 R1 and R3 cells after treatment with SC-2001 in dose dependent manner for 24 h. Right, Huh7 R1 and R3 cells were transfected with either vector or luciferase reporter driven by a promoter region containing STAT3-specific binding sites for 48 h. After transfection, the cells were treated with SC-2001 in dose dependent manner for 6 h. Luciferase activity was measured after the treatment. (C) The mRNA levels of SHP-1 and the protein levels of SHP-1 and RFX-1 in Huh7 R1 and R3 cells were determined. The mRNA level was analyzed by QPCR and the protein level was analyzed by western blot. (D) Top, Huh7 R1 and R3 cells were treated with SC-2001 in dose dependent manner. After treatment, the nuclear and cytosol extraction of RFX-1 was measured by western blot. Histone H1 was included as a loading control NE. Bottom, immunofluorescence staining, Huh7 R1 and R3 cells cells were treated with 4 μM SC-2001 for 24 h. After the end of treatment, RFX-1 was determined by immunofluorescence staining (red). Nuclei were counterstained with DAPI (blue). Representative confocal micrographs are shown. (E) Chromatin immunoprecipitation assay (CHIP) was conducted in Huh7 R1 and R3 cells after exposure to SC-2001 for 12 h. CHIP assay was performed as described above.
SC-2001-induced Inhibition of Colony Formation in Sorafenib-Resistant HCC Cells is RFX-1/SHP-1 Dependent
To further investigate the mechanism through which SC-2001 increased RFX-1/SHP-1 and decreased p-STAT3 in sorafenib-resistant cells, we knocked down SHP-1 with siRNA to address whether SHP-1 is associated with sorfenib resistance. As shown in Figure 4A, SC-2001 treatment increased SHP-1 and repressed p-STAT3. However, SHP-1 silence abolished the effects of SC-2001 on p-STAT3 in sorafenib-resistant cells, indicating the critical role of SHP-1 in SC-2001-induced inhibition of cell growth. Importantly, silencing RFX-1 resulted in inhibition of SHP-1 activity and further restored cell growth upon SC-2001 treatment (Figure 4B). On the other hand, genetic overexpression of RFX-1 potentiated the effect of SC-2001 in activating SHP-1 which led to significant growth inhibition in sorafenib-resistant cells. These results proved that RFX-1 and SHP-1 silencing could prevent SC-2001-mediated STAT3 reduction (Figure 4C). We therefore concluded that SC-2001 overcome sorafenib resistance in HCC cells by activating RFX-1 expression.
Figure 4.
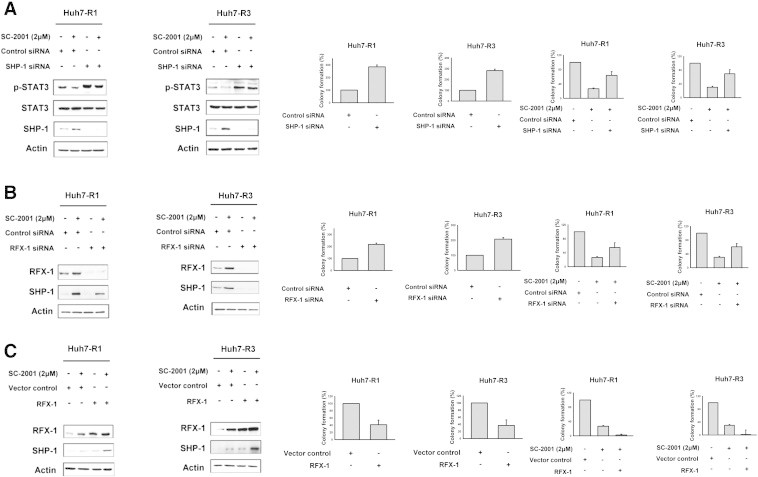
SC-2001-induced inhibition of colony formation in sorafenib-resistant HCC cells is RFX-1/SHP-1 dependent. (A) Huh7 R1 and R3 cells were transfected, respectively, with control siRNA or SHP-1 siRNA for 48 h. After transfection, the cells were treated with or without SC-2001 for 24 h and subjected to western blot assay to analyze the protein levels of p-STAT3 and SHP-1 or seeded on a 6-well plate for the colony forming assay. (B) Huh7 R1 and R3 cells were transfected, respectively, with control siRNA or RFX-1 siRNA for 48 h. After transfection, the cells were treated with or without SC-2001 for 24 h and subjected to western blot assay to analyze the protein levels of RFX-1 and SHP-1 or seeded on a 6-well plate for the colony forming assay. (C) Huh7 R1 and R3 cells were transfected, respectively, with control vector or RFX-1 overexpression plasmid for 48 h. After transfection, the cells were treated with or without SC-2001 for 24 h and the cells were subjected to western blot assay to analyze the protein levels of RFX-1 and SHP-1 or seeded on a 6-well plate for colony forming assay.
Use of SC-2001 in Combination with Sorafenib Synergizes the Antitumor Effect
Both Huh7 R1 and R3 cells had lower expression of RFX-1 and SHP-1 than Huh7 wild type. Also, these two cell lines were resistant to sorafenib at 10 μM due to the high expression level of STAT3. As SC-2001 activated RFX-1 in HCC cells as described above, we next investigated the effect of SC-2001 and sorafenib combination treatment in sorafenib resistant cells. As shown in Figure 5A, combination treatment resulted in significant down-regulation of p-STAT3 and its downstream signals in both sorafenib-resistant cell lines. In addition, the colony forming ability of sorafenib-resistant cells was markedly decreased by the combination treatment. Moreover, we examined the STAT3 activity in target gene regulation through ELISA and luciferase assays. The results indicated that the combination of sorafenib and SC-2001 synergistically suppressed STAT3 activity (Figure 5B). In addition, the combination also induced more significant caspase-3 and caspase-9 activation than a single agent treatment and led to high levels of DNA fragmentation (Figure 5C). We also conducted median effect analysis that showed that the combination index values were lower than one, indicating that these two agents worked in synergy to induce cell growth inhibition (Figure 5D).
Figure 5.
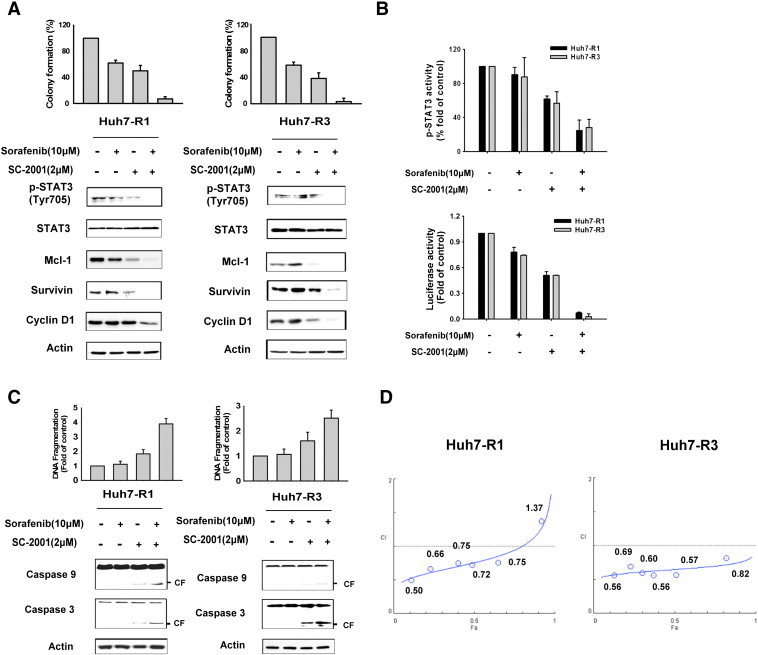
Use of SC-2001 in combination with sorafenib synergizes the anticancer effect. (A) Huh7 R1 and R3 cells were treated with a range of concentrations sorafenib and/or SC-2001 at a fixed ratio of 5:1 for 48 h. The colony formation (top) and western blot (bottom) were performed as described above after the treatment. (B) Top, Huh7 R1 and R3 cells were treated as described above and the STAT3 activity ELISA was performed after the treatment. Bottom, Huh7 R1 and R3 cells were transfected with either vector or luciferase reporter driven by a promoter region containing STAT3-specific binding sites for 48 h. After transfection, the cells were treated as described above and the luciferase activity was measured after the treatment. (C) The DNA fragmentation and protein levels of caspase-3 and caspase-9 were analyzed in Huh7 R1 and R3 cells after treatment with sorafenib and/or SC-2001 for 48 h as described above. (D) Huh7 R1 and R3 cells were treated with sorafenib and/or SC-2001 for 48 h administered over a range of concentrations at a fixed ratio of 5:1. After the cell viability was determined in each condition by MTT assay, the combination index (CI) was calculated by CompuSyn software. CI values of less than 1 were considered to respresent synergism.
SC-2001 Potentiates the Antitumor Effect of Sorafenib in both Sorafenib-Sensitive and Sorafenib-Resistant Huh7 Xenograft Models
Results of the biological assays demonstrated that p-STAT3 status and cell survival of wild-type HCC cells was hindered by sorafenib or SC-2001. SC-2001 and sorafenib in combination inhibited p-STAT3 and cell survival more significantly than either monotherapy in both in wild-type as well as sorafenib-resistant cells. To examine the therapeutic effect, wild-type Huh7 and sorafenib-resistant Huh 7 cells were injected into nude mice to initiate tumor growth and sorafenib or SC-2001 or combination treatement was administered. Although wild-type Huh7 tumors treated with sorafenib were smaller than control for the first 5 days treatment, we observed that sorafenib-treated mice had an accelerated tumor growth rate after 5-days of treatment and eventually showed moderate growth inhibition at the end of the treatment, indicating that wild-type Huh7 tumor became resistant to sorafenib (Figure 6A, left). On the other hand, sorafenib alone showed no inhibitory effect on sorafenib-resistant bearing xenograft mice, suggesting that acquired Huh7 resistance reflected clinical results with sorafenib treatment (Figure 6A, left). Next, we administrated SC-2001 to both wild-type and sorafenib-resistant xenograft animals. Treatment with SC-2001 inhibited wild-type Huh7 and sorafenib-resistant growth more significantly than sorafenib (Figure 6A, left, c, left). Notably, the size of sorafinib-resistant tumors treated with SC-2001 was only 20% that of vehicle-treated mice at the end of treatment (Figure 6A, left). More importantly, SC-2001 and sorafenib combination treatment almost completely repressed tumor growth in both wild-type and sorafenib-resistant tumors (Figure 6A, left, C, left). There was moderate weight loss in controls, mono-treated and combination-treated mice (Figure 6A, right, C, right). In addition, tumors from control and sorafenib treated-mice did not exhibit RFX-1 and SHP-1 activation signals (Figure 6B, left, D, left). However, SC-2001 alone or in combination with sorafenib showed an obvious increase in RFX-1 and SHP-1 expression in both wild-type and sorafenib-resistant tumors (Figure 6B, left, D, left). The high levels of expression of RFX-1 and SHP-1 induced by SC-2001 drove SHP-1 activation and further repressed p-STAT3 (Figure 6B and D). Together, these data demonstrated that SC-2001 overcame sorafenib resistance through RFX-1 and SHP-1 dependent STAT3 inactivation.
Figure 6.
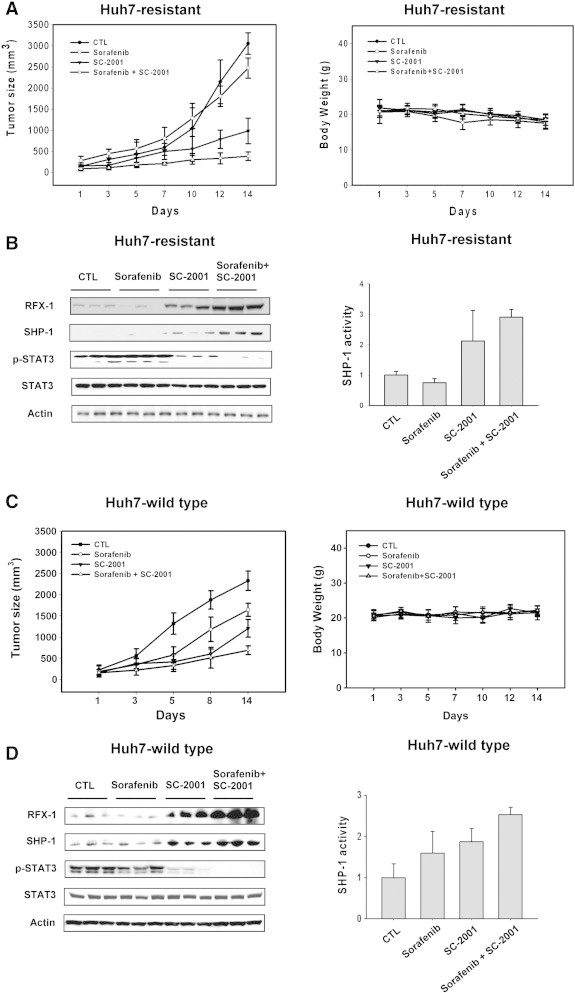
SC-2001 potentiates the antitumor effect of sorafenib in both sorafenib-sensitive and sorafenib-resistant Huh7 xenograft models. (A) Left, Huh7-resistant cells were subcutaneously injected into nude mice. When tumors reached 100 mm3, the mice were then treated with sorafenib and/or SC-2001 orally for 2 weeks. Tumor volume was measured and calculated according to the formula described in Materials and Methods. Right, The body weight of nude mice bearing Huh7-resistant cells was measured. (B) Left, The protein levels of RFX-1, SHP-1, and p-STAT3 in Huh7-resistant cells in vivo were determined by western blot. Right, The in vivo SHP-1 activity in Huh7-resistant cells was determined. (C) Left, Huh7-wild type cells were subcutaneously injected into nude mice. When tumors reached 100 mm3, the mice were treated with sorafenib and/or SC-2001 orally for 2 weeks. The tumor volume was measured and calculated according to the formula described in Materials and Methods. Right, The body weight of nude mice bearing Huh7-wild type cells was measured. (D) Left, The in vivo protein levels of RFX-1, SHP-1, and p-STAT3 in Huh7 wild-type cells were determined by western blot. Right, The in vivo SHP-1 activity in Huh7 wild type cells was determined.
Discussion
This study first demonstrated that RFX-1/SHP-1 activity is lost after sustained sorafenib treatment in both human HCC cells and a mouse model. To better understand the mechanisms surrounding sorafenib resistance, HCC cell lines were treated with SC-2001 and sorafenib, and tumor resistance, and STAT3 and its target gene levels were investigated. The results indicated that RFX-1/SHP-1 mediates sensitivity to sorafenib in HCC cells and sustained sorafenib treatment resulted in decreased RFX-1/SHP-1, and increased p-STAT3 protein levels and transcriptional activity. Importantly, the lack of growth inhibition in resistant HCC in a xenograft model treated with sorafenib accompanied with decreased RFX-1 suggests that RFX-1 level might be mediator of HCC response to sorafenib. Since sorafenib is the first and only targeted therapy drug approved for HCC, we further wanted to link the correlation between sorafenib resistance and disease diagnosis. Due to the limitation of human patient samples, no further patients on the correlation with drug resistance and disease diagnosis could be made. However, we analyzed the correlation between RFX-1 and SHP-1 in HCC patients (not necessarily receiving sorafenib therapy). There was a positive relationship between the RFX1 and SHP-1 mRNA levels in 11 HCC patient tissues (stage 1 or 2) with a R2 at 0.5016 (Supplementary Figure 3).
In vitro studies suggested that loss of RFX-1 is able to induce sorafenib resistance by decreasing sorafenib-induced growth inhibition. In addition, sustained sorafenib treatment in HCC cells also resulted in decreased expression and function of RFX-1 targets, such as SHP-1. SHP-1 is a key contributor to negative regulation of p-STAT3 [21], [29], [30] which has been linked to sorafenib-induced drug resistance [17]. Sustained high levels of expression of p-STAT3 in HCC cells is known to drive the expression of its antiapoptotic target genes such as Mcl-1, survivin and cyclin D1 [17]. All these data strongly suggest that RFX-1/SHP-1 might play roles as tumor suppressors and contribute to a STAT3 dependent sorafenib-resistance in cells. In addition, the effect of sorafenib-induced high levels of STAT3 expression in tumors suggests that its use in combination with a RFX-1 activator may be a rational therapeutic strategy for HCC treatment.
In light of the fact that SC-2001 could activate RFX-1/SHP-1 and reduce the level of p-STAT3, we hypothesized that SC-2001 may overcome STAT3-dependent sorafenib-resistance in HCC cells. This hypothesis was supported in two sorafenib-resistant HCC cell lines by cell viability, colony formation and apoptosis results, which showed that SC-2001 was more effective at inhibiting cell growth and inducing apoptosis than sorafenib. On the other hand, the protein level of RFX-1was increased and this gave us a clue that SC-2001 might regulate RFX-1 through transcriptional regulation. As shown in Supplementary Figure 2, the mRNA of RFX-1 increased under SC-2001 treatment but not obatoclax, the lead compound of SC-2001. We also found that SC-2001 used in combination with sorafenib displayed synergistic tumor growth inhibition both in wild-type and sorafenib-resistant HCC-bearing xenograft mouse models. Importantly, in this study low dosages of SC-2001 were able to down-regulate p-STAT3 through activating RFX-1/SHP-1 in sorafenib resistant Huh7. The dramatic inhibition tumor growth exerted by the combination treatment may possibly be explained by the fact that SC-2001 also acts as an inhibitor of the anti-apoptitic Bcl-2 family [18]. Indeed, our previous data indicated that SC-2001 significantly prevented the interaction between Mcl-1 and Bak in HCC cells [19]. Moreover, our data showed that SC-2001 alone also significantly enhanced the expression of RFX-1/SHP-1 in wild-type Huh-7 xenograft tumors (Figure 6D), supporting that RFX-1/SHP-1/stat3 pathway is also an effector target of SC-2001 in wild-type cells. In addition to the fact that sorafenib is a well-known multiple kinase inhibitor that inhibits Raf-1 and other angiogenic kinases (such as VEGFR2, VEGFR3, Flt-3, PDGFR, and FGFR-1) [7], sorafenib also can directly interact with SHP-1 to enhance SHP-1 activity, without affecting SHP-1 expression, and induce apoptosis in HCC cells (including wild-type Huh7) [21], [29], [31]. Therefore, it can be speculated that combination of sorafenib with SC-2001 may also have synergistic antitumor effect in wild type Huh-7 xenograft tumor, as supported by our results. It is noteworthy that the level of RFX-1/SHP-1 in the combination treated group was higher than that in SC-2001 alone-treated group, both in sorafenib-resistant Huh7 xenograft tumors (Figure 6B) and in wild-type Huh7 tumors (Figure 6D). Furthermore, sorafenib treatment alone did not significant alter expression of RFX-1/SHP-1 in wild-type Huh7 xenograft tumors. To our acknowledgement, there is no study reporting sorafenib could affect the expression of RFX-1/SHP-1. Despite that other off-targets (other than RFX-1/SHP-1/STAT3 pathway) may also be involved in the combination effects of sorafenib and SC-2001, the exact mechanisms to explain why sorafenib could significantly potentiate the effect of SC-2001 on RFX-1/SHP-1 expression in these in vivo xenograft tumors remain unclear and future studies are needed.
Current study has some limitation. Although the sorafenib-resistant Huh-7 R1 and Huh-7 R3 cells displayed decreased RFX-1 and SHP-1 and increased p-STAT3 which implied a possible mechanism of acquired sorafenib resistance (Figure 1B), Considering multiple mechanisms of sorafenib resistance [8], a resistant clone that displayed a similar expression of RFX-1/SHP-1 compared with parent Huh7 cells will serve a critical control to help figure out the importance of RFX-1/SHP-1/STAT3 pathway and whether this pathway is the only target of SC-2001. Furthermore, studies on clinical relevance of RFX-1/SHP-1/STAT3 with sorafenib resistance using primary malignant cells or biopsy samples from patients will strengthen our current findings. More studies are needed to further address this point.
In summary, our data provide strong evidence that RFX-1/SHP-1 activation is the driving force determining the therapeutic effect of sorafenib on HCC cells. We further confirmed that activation of RFX-1 and SHP-1 by SC-2001 overcomes drug resistance to sorafenib in HCC thus pointing to a possible new sorafenib combinational therapy for HCC and the need for further clinical investigation.
The following are the supplementary data related to this article.
Phosphorylated STAT5 did not significant changed in Huh7 WT and Huh7 resistant cells. The activity of p-STAT5 in Hun7 WT, Hun7 R1 and R3 cells are measured by ELISA assay.
SC-2001 increased RFX-1 mRNA in Huh7 R1 and R3 cells. mRNA levels of RFX-1 in Huh7 R1 and R3 cells after treatment of SC-2001 and obatoclax in indicated doses.
Positive correlation of RFX-1 and SHP-1 mRNA in HCC cells from tumor samples of 11 patients with hepatocellular carcinoma. Linear regression model, the correlation coefficient (R2) was 0.5016. (p = 0.0147).
Acknowledgments
We would like to thank Taiwan Liver Cancer Network (TLCN) for providing the liver tissue samples and related clinical data (all are anonymous) for our research. TLCN is supported by grants from Ministry of Science and Technology and National Health Reseach Institute, Taiwan.
Footnotes
Financial Support: This research was supported by grants from National Science Council, Taiwan (NSC102-2321-B-010-007), and National Health Research Institutes, Taiwan (NHRI-EX103-10111BC).
Disclosure of Potential Conflicts of Interest: No potential conflicts of interest were disclosed.
Contributor Information
Kuen-Feng Chen, Email: kfchen1970@ntu.edu.tw, cwshiau@ym.edu.tw.
Chung-Wai Shiau, Email: cwshiau@ym.edu.tw.
References
- 1.Bruix J., Llovet J.M. HCC surveillance: who is the target population? Hepatology. 2003;37:507–509. doi: 10.1053/jhep.2003.50142. [DOI] [PubMed] [Google Scholar]
- 2.Llovet J.M., Di Bisceglie A.M., Bruix J., Kramer B.S., Lencioni R., Zhu A.X., Sherman M., Schwartz M., Lotze M., Talwalkar J. Design and endpoints of clinical trials in hepatocellular carcinoma. J Natl Cancer Inst. 2008;100:698–711. doi: 10.1093/jnci/djn134. [DOI] [PubMed] [Google Scholar]
- 3.Di Maio M., Daniele B., Perrone F. Targeted therapies: Role of sorafenib in HCC patients with compromised liver function. Nat Rev Clin Oncol. 2009;6:505–506. doi: 10.1038/nrclinonc.2009.114. [DOI] [PubMed] [Google Scholar]
- 4.Panka D.J., Wang W., Atkins M.B., Mier J.W. The Raf inhibitor BAY 43-9006 (Sorafenib) induces caspase-independent apoptosis in melanoma cells. Cancer Res. 2006;66:1611–1619. doi: 10.1158/0008-5472.CAN-05-0808. [DOI] [PubMed] [Google Scholar]
- 5.Wilhelm S.M., Carter C., Tang L., Wilkie D., McNabola A., Rong H., Chen C., Zhang X., Vincent P., McHugh M. BAY 43-9006 exhibits broad spectrum oral antitumor activity and targets the RAF/MEK/ERK pathway and receptor tyrosine kinases involved in tumor progression and angiogenesis. Cancer Res. 2004;64:7099–7109. doi: 10.1158/0008-5472.CAN-04-1443. [DOI] [PubMed] [Google Scholar]
- 6.Zhang W., Konopleva M., Shi Y.X., McQueen T., Harris D., Ling X., Estrov Z., Quintas-Cardama A., Small D., Cortes J. Mutant FLT3: a direct target of sorafenib in acute myelogenous leukemia. J Natl Cancer Inst. 2008;100:184–198. doi: 10.1093/jnci/djm328. [DOI] [PubMed] [Google Scholar]
- 7.Wilhelm S., Carter C., Lynch M., Lowinger T., Dumas J., Smith R.A., Schwartz B., Simantov R., Kelley S. Discovery and development of sorafenib: a multikinase inhibitor for treating cancer. Nat Rev Drug Discov. 2006;5:835–844. doi: 10.1038/nrd2130. [DOI] [PubMed] [Google Scholar]
- 8.Zhai B., Sun X.Y. Mechanisms of resistance to sorafenib and the corresponding strategies in hepatocellular carcinoma. World J Hepatol. 2013;5:345–352. doi: 10.4254/wjh.v5.i7.345. [DOI] [PMC free article] [PubMed] [Google Scholar]
- 9.Tang T.C., Man S., Xu P., Francia G., Hashimoto K., Emmenegger U., Kerbel R.S. Development of a resistance-like phenotype to sorafenib by human hepatocellular carcinoma cells is reversible and can be delayed by metronomic UFT chemotherapy. Neoplasia. 2010;12:928–940. doi: 10.1593/neo.10804. [DOI] [PMC free article] [PubMed] [Google Scholar]
- 10.Ji T., Gong D., Han Z., Wei X., Yan Y., Ye F., Ding W., Wang J., Xia X., Li F. Abrogation of constitutive Stat3 activity circumvents cisplatin resistant ovarian cancer. Cancer Lett. 2013;341:231–239. doi: 10.1016/j.canlet.2013.08.022. [DOI] [PubMed] [Google Scholar]
- 11.Duan Z., Foster R., Bell D.A., Mahoney J., Wolak K., Vaidya A., Hampel C., Lee H., Seiden M.V. Signal transducers and activators of transcription 3 pathway activation in drug-resistant ovarian cancer. Clin Cancer Res. 2006;12:5055–5063. doi: 10.1158/1078-0432.CCR-06-0861. [DOI] [PubMed] [Google Scholar]
- 12.Sheng W.J., Jiang H., Wu D.L., Zheng J.H. Early responses of the STAT3 pathway to platinum drugs are associated with cisplatin resistance in epithelial ovarian cancer. Braz J Med Biol Res. 2013;46:650–658. doi: 10.1590/1414-431X20133003. [DOI] [PMC free article] [PubMed] [Google Scholar]
- 13.Colomiere M., Findlay J., Ackland L., Ahmed N. Epidermal growth factor-induced ovarian carcinoma cell migration is associated with JAK2/STAT3 signals and changes in the abundance and localization of alpha6beta1 integrin. Int J Biochem Cell Biol. 2009;41:1034–1045. doi: 10.1016/j.biocel.2008.09.018. [DOI] [PubMed] [Google Scholar]
- 14.Real P.J., Sierra A., De Juan A., Segovia J.C., Lopez-Vega J.M., Fernandez-Luna J.L. Resistance to chemotherapy via Stat3-dependent overexpression of Bcl-2 in metastatic breast cancer cells. Oncogene. 2002;21:7611–7618. doi: 10.1038/sj.onc.1206004. [DOI] [PubMed] [Google Scholar]
- 15.Ikuta K., Takemura K., Kihara M., Nishimura M., Ueda N., Naito S., Lee E., Shimizu E., Yamauchi A. Overexpression of constitutive signal transducer and activator of transcription 3 mRNA in cisplatin-resistant human non-small cell lung cancer cells. Oncol Rep. 2005;13:217–222. [PubMed] [Google Scholar]
- 16.Chen K.F., Tai W.T., Liu T.H., Huang H.P., Lin Y.C., Shiau C.W., Li P.K., Chen P.J., Cheng A.L. Sorafenib overcomes TRAIL resistance of hepatocellular carcinoma cells through the inhibition of STAT3. Clin Cancer Res. 2010;16:5189–5199. doi: 10.1158/1078-0432.CCR-09-3389. [DOI] [PubMed] [Google Scholar]
- 17.Tai W.T., Cheng A.L., Shiau C.W., Liu C.Y., Ko C.H., Lin M.W., Chen P.J., Chen K.F. Dovitinib induces apoptosis and overcomes sorafenib resistance in hepatocellular carcinoma through SHP-1-mediated inhibition of STAT3. Mol Cancer Ther. 2012;11:452–463. doi: 10.1158/1535-7163.MCT-11-0412. [DOI] [PubMed] [Google Scholar]
- 18.Chen K.F., Lin J.P., Shiau C.W., Tai W.T., Liu C.Y., Yu H.C., Chen P.J., Cheng A.L. Inhibition of Bcl-2 improves effect of LCL161, a SMAC mimetic, in hepatocellular carcinoma cells. Biochem Pharmacol. 2012;84:268–277. doi: 10.1016/j.bcp.2012.04.023. [DOI] [PubMed] [Google Scholar]
- 19.Chen K.F., Su J.C., Liu C.Y., Huang J.W., Chen K.C., Chen W.L., Tai W.T., Shiau C.W. A novel obatoclax derivative, SC-2001, induces apoptosis in hepatocellular carcinoma cells through SHP-1-dependent STAT3 inactivation. Cancer Lett. 2012;321:27–35. doi: 10.1016/j.canlet.2012.03.023. [DOI] [PubMed] [Google Scholar]
- 20.Kim D.J., Tremblay M.L., Digiovanni J. Protein tyrosine phosphatases, TC-PTP, SHP1, and SHP2, cooperate in rapid dephosphorylation of Stat3 in keratinocytes following UVB irradiation. PLoS One. 2010;5:e10290. doi: 10.1371/journal.pone.0010290. [DOI] [PMC free article] [PubMed] [Google Scholar]
- 21.Tai W.T., Cheng A.L., Shiau C.W., Huang H.P., Huang J.W., Chen P.J., Chen K.F. Signal transducer and activator of transcription 3 is a major kinase-independent target of sorafenib in hepatocellular carcinoma. J Hepatol. 2011;55:1041–1048. doi: 10.1016/j.jhep.2011.01.047. [DOI] [PubMed] [Google Scholar]
- 22.Bousquet C., Susini C., Melmed S. Inhibitory roles for SHP-1 and SOCS-3 following pituitary proopiomelanocortin induction by leukemia inhibitory factor. J Clin Invest. 1999;104:1277–1285. doi: 10.1172/JCI7924. [DOI] [PMC free article] [PubMed] [Google Scholar]
- 23.Lopez-Ruiz P., Rodriguez-Ubreva J., Cariaga A.E., Cortes M.A., Colas B. SHP-1 in cell-cycle regulation. Anticancer Agents Med Chem. 2011;11:89–98. doi: 10.2174/187152011794941154. [DOI] [PubMed] [Google Scholar]
- 24.Wu C., Sun M., Liu L., Zhou G.W. The function of the protein tyrosine phosphatase SHP-1 in cancer. Gene. 2003;306:1–12. doi: 10.1016/s0378-1119(03)00400-1. [DOI] [PubMed] [Google Scholar]
- 25.Wlodarski P., Zhang Q., Liu X., Kasprzycka M., Marzec M., Wasik M.A. PU.1 activates transcription of SHP-1 gene in hematopoietic cells. J Biol Chem. 2007;282:6316–6323. doi: 10.1074/jbc.M607526200. [DOI] [PubMed] [Google Scholar]
- 26.Nakase K., Cheng J., Zhu Q., Marasco W.A. Mechanisms of SHP-1 P2 promoter regulation in hematopoietic cells and its silencing in HTLV-1-transformed T cells. J Leukoc Biol. 2009;85:165–174. doi: 10.1189/jlb.0608383. [DOI] [PMC free article] [PubMed] [Google Scholar]
- 27.Amin S., Kumar A., Nilchi L., Wright K., Kozlowski M. Breast cancer cells proliferation is regulated by tyrosine phosphatase SHP1 through c-jun N-terminal kinase and cooperative induction of RFX-1 and AP-4 transcription factors. Mol Cancer Res. 2011;9:1112–1125. doi: 10.1158/1541-7786.MCR-11-0097. [DOI] [PubMed] [Google Scholar]
- 28.Chou T.C. Drug combination studies and their synergy quantification using the Chou-Talalay method. Cancer Res. 2010;70:440–446. doi: 10.1158/0008-5472.CAN-09-1947. [DOI] [PubMed] [Google Scholar]
- 29.Tai W.T., Shiau C.W., Chen P.J., Chu P.Y., Huang H.P., Liu C.Y., Huang J.W., Chen K.F. Discovery of novel src homology region 2 domain-containing phosphatase 1 agonists from sorafenib for the treatment of hepatocellular carcinoma. Hepatology. 2014;59:190–201. doi: 10.1002/hep.26640. [DOI] [PubMed] [Google Scholar]
- 30.Phromnoi K., Prasad S., Gupta S.C., Kannappan R., Reuter S., Limtrakul P., Aggarwal B.B. Dihydroxypentamethoxyflavone down-regulates constitutive and inducible signal transducers and activators of transcription-3 through the induction of tyrosine phosphatase SHP-1. Mol Pharmacol. 2011;80:889–899. doi: 10.1124/mol.111.073676. [DOI] [PMC free article] [PubMed] [Google Scholar]
- 31.Liu C.Y., Tseng L.M., Su J.C., Chang K.C., Chu P.Y., Tai W.T., Shiau C.W., Chen K.F. Novel sorafenib analogues induce apoptosis through SHP-1 dependent STAT3 inactivation in human breast cancer cells. Breast Cancer Res. 2013;15:R63. doi: 10.1186/bcr3457. [DOI] [PMC free article] [PubMed] [Google Scholar]
Associated Data
This section collects any data citations, data availability statements, or supplementary materials included in this article.
Supplementary Materials
Phosphorylated STAT5 did not significant changed in Huh7 WT and Huh7 resistant cells. The activity of p-STAT5 in Hun7 WT, Hun7 R1 and R3 cells are measured by ELISA assay.
SC-2001 increased RFX-1 mRNA in Huh7 R1 and R3 cells. mRNA levels of RFX-1 in Huh7 R1 and R3 cells after treatment of SC-2001 and obatoclax in indicated doses.
Positive correlation of RFX-1 and SHP-1 mRNA in HCC cells from tumor samples of 11 patients with hepatocellular carcinoma. Linear regression model, the correlation coefficient (R2) was 0.5016. (p = 0.0147).