

Abstract
We have previously described gene expression changes during spontaneous immortalization of T-cells, thereby identifying cellular processes important for cell growth crisis escape and unlimited proliferation. Here, we analyze the same model to investigate the role of genome-wide methylation in the immortalization process at different time points pre-crisis and post-crisis using high-resolution arrays. We show that over time in culture there is an overall accumulation of methylation alterations, with preferential increased methylation close to transcription start sites (TSSs), islands, and shore regions. Methylation and gene expression alterations did not correlate for the majority of genes, but for the fraction that correlated, gain of methylation close to TSS was associated with decreased gene expression. Interestingly, the pattern of CpG site methylation observed in immortal T-cell cultures was similar to clinical T-cell acute lymphoblastic leukemia (T-ALL) samples classified as CpG island methylator phenotype positive. These sites were highly overrepresented by polycomb target genes and involved in developmental, cell adhesion, and cell signaling processes. The presence of non-random methylation events in in vitro immortalized T-cell cultures and diagnostic T-ALL samples indicates altered methylation of CpG sites with a possible role in malignant hematopoiesis.
Abbreviations: CIMP, CpG island methylator phenotype; DEG, differently expressed gene; DM-CpG, differently methylated CpG; DMG, differently methylated gene; T-ALL, T-cell acute lymphoblastic leukemia
Introduction
Cellular immortalization is a multistep process and a major step in cancer development. Senescence checkpoint bypass and acquisition of indefinite replicative capacity in cell cultures have been associated with pathways affecting cell cycle progression, DNA damage, oxidative stress responses, and cytoskeletal organization, as well as interferon-, insulin growth factor–, and MAP kinase–related pathways [1]. Published data on cellular processes involved in immortalization have essentially been generated from fibroblasts and endothelial and epithelial cells, whereas less is known for lymphoid cells [1], [2], [3], [4]. A common feature of immortalized cells is activation of telomerase through up-regulation of human Telomerase Reverse Transcriptase (hTERT), the expression of which is regulated by a multitude of factors including modifiers of the chromatin structure [5], [6], [7]. We have previously shown that impaired DNA damage response and deregulated cell senescence control together with activation of telomerase were coupled to T-cell immortalization [8]. In vitro immortalization of mammary epithelial cells has been associated with stepwise DNA methylation alterations [3], and in the present study, we have analyzed methylation alterations during this process in primary T-cell cultures and in relation to diagnostic T-cell acute lymphoblastic leukemia (T-ALL) samples.
Epigenetic processes involve DNA methylation and histone modifications, which can participate in gene regulation without altering the DNA sequence. DNA methylation frequently occurs on a cytosine followed by a guanine (CpG sites) [9]. Many CpG-enriched regions (CpG islands) are located in promoters and methylation of such CpG islands represents one major transcriptional control mechanism [4]. Abnormal DNA methylation is a hallmark of cancer development and might lead to silencing of tumor suppressor genes and/or activation of oncogenes [9], [10], [11]. Specific CpG islands are commonly methylated in malignancies and the methylation pattern seems to be tumor type specific [3], [9], [11], [12], [13], [14], [15]. Epigenetic repression of the INK4a/ARF locus, encoding the tumor suppressors p16INK4a and p14ARF, is a frequent event during immortalization of fibroblasts and epithelial cells [2], [16], [17]. In addition, hypomethylation of intragenic regions may result in derepression of transposable elements contributing to genomic instability [9].
Analysis of the impact of DNA methylation on processes relevant for cellular immortalization in vitro is complicated due to the fact that successive methylation changes may occur by time and number of population doublings (PDs). Long-term culture of fibroblasts and mesenchymal stromal cells is associated with specific senescence-associated DNA methylation changes [18]. In mesenchymal stromal cells, overexpression of TERT or immortalization with a doxycycline-inducible system (TERT and SV40-TAg) resulted in telomere extension but did not prevent senescence-associated DNA methylation [19]. It was also noted that methylation patterns were maintained throughout both long-term culture and aging but with highly significant differences at specific CpG sites [20]. However, for hematopoietic cells in vitro data are conflicting and limited to Epstein Barr Virus (EBV)-transformed lymphoblastoid B cell lines [21], [22].
In the present study, genome-wide promoter-associated methylation was analyzed during spontaneous immortalization of T-cell cultures established from patients with Nijmegen breakage syndrome (NBS) and a healthy individual, using high-density arrays. A significant number of CpG site alterations throughout immortalization were shared with pediatric T-ALL suggesting a clinical relevance of these methylation changes.
Materials and Methods
T-cell Cultures and Culture Conditions
The studied T-cell cultures were established at the Sklodowska-Curie Memorial Cancer Center in Warsaw, Poland, and at Umeå University in Umeå, Sweden, using mitogen-initiated, Interleukin-2 (IL-2)–dependent cultures without genetic manipulations, as previously described [8], [23], [24]. The spontaneously immortalized T-cell lines (S3R, S4, and S9) were established from peripheral blood mononuclear cells derived from patients with NBS homozygous for the 657del5 mutation of the NBS1 gene [8], [23]. T-cell lines (L4 and L5) and their parental population (L2) as well as the primary T lymphoblast culture S1/PHA were derived from normal spleen [24]. The primary T-lymphoblast culture P7/R2 was derived from peripheral blood mononuclear cells of a healthy donor and was generated after initial 24-hour activation with 20 μg/ml Wheat Germ Agglutinin (WGA), followed by culture in standard medium without mitogen for the next 5 days and thereafter propagation in 20 U/ml of rIL-2 for 14 PDs. All cultures were maintained in standard medium [RPMI 1640, 10-12% fetal calf serum, 50 μg/ml gentamicin (Sigma-Aldrich, St Louis, MO)] supplemented with 20 U/ml rIL-2 (R&D Systems, Minneapolis, MN), in 5% CO2 at 37°C. An approval from the Ethical Council in Warsaw, Poland, was obtained before collection of the NBS blood samples and the patients’ guardians provided informed consent.
Cell cultures were grouped accordingly: primary with limited life-span in vitro (P7/R2 14 PDs, S1/PHA 2 PDs), pre-immortal (S3R 17 PDs, S4 12/18/48 PDs, S9 10 PDs, L2 5 PDs), and immortal (S3R 27/76/192 PDs, S4 68/223 PDs, S9 104 PDs, L4 195 PDs, L5 157 PDs). Pre-immortal and immortal T-cell cultures were separated by a period of growth crisis, in S3R at 21 to 25 PDs and in S4 at 62 to 67 PDs, but with no clear growth crisis period in cultures S9, L4, or L5.
T-ALL Samples
Diagnostic bone marrow samples from 43 pediatric T-ALL patients collected at the University Hospital in Umeå, Sweden, have been previously analyzed by the HumMeth27K (n = 43) and HumMeth450K (n = 10) Illumina methylation arrays (Illumina, San Diego, CA) and classified regarding CpG island methylator phenotype (CIMP) status [25]. Methylation array data from the HumMeth27K array was downloaded from the National Center for Biotechnology Information (NCBI) Gene Expression Omnibus (GEO) database, GSE42079, and data from the HumMeth450K array has been deposited to the GEO database, GSE56070. The Regional Ethics Committee approved the study, and the patients and/or their guardians provided informed consent.
DNA Preparation
DNA was prepared with the Nucleon BACC2 kit (Amersham Biosciensces AB, Uppsala, Sweden) and DNA purity and concentration were determined by spectrophotometry (NanoDrop; Thermo Scientific, Wilmington, DE).
Genome-Wide CpG Site Methylation Profiling
The cell cultures were analyzed at different stages during immortalization using a high-density array covering 485,577 CpG sites (HumMeth450K, Illumina). The included CpG sites are located in different genomic regions, but the main focus is promoter-associated regions and CpG islands. The array definition of genomic regions and the relations to CpG islands are shown in Supplementary Figure S1. A methylated control sample (Human HCT116 DKO methylated DNA; Zymo Research, Irvine, CA, USA) enzymatically methylated on all cytosines by M.SssI methyltransferase and a non-methylated (< 5%) control double knocked out for DNA methyltransferases (DNMT1 −/− and DNMT3B −/−; Human HCT116 DKO non-methylated DNA; Zymo Research) were included. For each sample, 500 ng of DNA was bisulfite converted with the EZ-96 DNA Methylation-Gold Kit (Zymo Research) according to the manufacturer’s manual. Two hundred nanograms of bisulfite-converted DNA was applied to each array, which was handled according to the Illumina provided protocol and scanned with an iScan SQ instrument (Illumina). The fluorescence intensities were extracted using the Methylation module (1.9.0) in the Genome Studio software (V2011.1).
Pre-Processing of Methylation Array Data
CpGs on the X and Y chromosomes were omitted from the analysis to avoid gender-related methylation biases. In addition, CpG sites lacking observations due to less than or equal three reported beads/array or CpG sites with low detection P value (> .05) were excluded. Likewise, CpG sites located at or close to a (10-bp) single nucleotide polymorphism (SNP) as well as CpG sites located in intergenic regions were excluded. All filtration steps are shown in Supplementary Figure S2. The methylation levels for the remaining 330,354 CpG sites were determined by calculating the ratio (i.e., the β value) between the fluorescent intensity from the methylated alleles and the total intensity, as defined in the Genome Studio software (Illumina). The β value ranges in theory from 0, corresponding to completely unmethylated DNA, to 1, representing fully methylated DNA. To compensate for the two different bead types used in the HumMeth450K array, the β values were normalized using the BMIQ method [26], [27].
The methylation array data have been deposited to the NCBI GEO database, GSE56070.
Verification of Methylation Array Data by Pyrosequencing
DNA samples were sent to the Genome Centre Queen Mary, University of London for targeted pyrosequencing on a selection of genomic regions overlapping with specific CpGs in the methylation array, including TAL1 (cg19797376), KLF4 (cg07309102), HOXD8 (cg15520279), and TWIST1 (cg24446548). Pyrosequencing was performed according to the manufacturer’s protocol by bisulfite treatment of DNA (EZ DNA Methylation; Zymo Research), followed by polymerase chain reaction (PCR) amplification and pyrosequencing using PyroMark Gold Q96 Reagents (Qiagen, Sollentuna, Sweden) in the PSQ 96MA instrument with PSQ 96MA software V2.1 (Qiagen). The following set of primers were used: TAL1_F: ATGGGGGTTAGAGAGAGAATGA; TAL1_R:ACCTCCTCAACCAAATCTC; TAL1_seq: GGGGGATTTTAAGGT; HOXD8_F: AGTGATAGTAGTAGTAAGTGGGATTGAT; HOXD8_R: AACAACCCCCCCACAAACCCC; HOXD8_seq: GTTTTGTATTTGGAGTATAG; KLF4_F: AGGTTGTAGAGAAGGAAGTTATAAGTAAG; KLF4_R: CAACAACCTCCCCCACCACTAT; KLF4_seq: ATACCCCCAAATAAAACTAACTAC; TWIST1_F: GGAGGTATAAGAGTTTTTAAGTTTGTAG; TWIST1_R: ACACCCCCCCAAACCTCCTA; TWIST1_seq: AGAGTTTTTAAGTTTGTAGTT.
RNA Preparation and Pre-Processing of Gene Expression Data
Total RNA was isolated using TRIzol reagent (Invitrogen, Stockholm, Sweden) according to the manufacturer’s protocol. The RNA quality was analyzed in a 2100 Bioanalyzer (Agilent Technologies, Santa Clara, CA) and RNA integrity number was > 9 in all samples. In brief, 200 ng of total RNA was used for cRNA production by the Illumina TotalPrep RNA amplification kit (Ambion Inc, St Austin, TX) according to the provided protocol. The biotin-labeled cRNA was purified and the quality was evaluated using the RNA 6000 pico kit in the 2100 Bioanalyzer (Agilent Technologies).
A total of 750 ng of biotinylated cRNA was hybridized to the human HT12 Illumina Beadchip gene expression array (Illumina) according to the manufacturer’s protocol and scanned using the Illumina Bead Array Reader (Illumina). Illumina Genome Studio software (V2011.1) with gene expression module (1.9.0) was used for data extraction and normalization using the rank invariant normalization. Selected parts of the gene expression array data have been previously published [8]. Gene expression array data have been deposited to the NCBI GEO database, GSE56070.
Quantitative Reverse Transcription–PCR Analysis
cDNA was prepared by reverse transcription (RT) of 500 ng of total RNA with the Superscript II Reverse Transcriptase kit (Invitrogen) together with random hexamers (Applied Biosystems, Inc, Foster City, CA) and RNasin (Promega, Nacka, Sweden) according to the manufacturer’s instructions (Invitrogen).
Expression levels of selected genes were determined by quantitative PCR in duplicates and a standard curve was included in each assay to monitor PCR efficiency. The following genes were analyzed by TaqMan assays on demand according to the manufacturer’s protocol using the TaqMan Universal PCR Mastermix in the ABI PRISM 7900HT Instrument (Applied Biosystems, Inc): TATA-binding protein gene (TBP) (Hs99999910_m1), BMI1 polycomb ringfinger oncogene (BMI1) (Hs00180411_m1), Chromobox homolog 2 (CBX2) (Hs01034268_m1), chromobox homolog 7 (CBX7) (Hs00545603_s1), Enhancer of Zeste homolog 2 (EZH2) (Hs01016789_m1), and supressor of Zeste 12 (SUZ12) (Hs00248742_m1). Relative mRNA levels were normalized to a housekeeping TBP gene and fold change was calculated by the 2− ΔΔCt method using P7/R2 and S1/PHA as primary mortal T-cell culture references [28].
Bioinformatic and Statistical Analyses
Downstream analyses of the methylation and gene expression array data were performed using R (v2.15.0). The CpG sites were matched to genes on the expression array according to their RefSeq accessions. Gene annotations from both gene expression and methylation arrays were matched to the hg19 assembly (NCBI) and their annotations were updated. Genes with discontinued accessions or non-consistent annotations were excluded from further analysis. In the downstream analysis, the normalized β values and the log2-transformed normalized signal intensities were used as measures of methylation and gene expression levels, respectively.
The primary T-lymphoblast culture P7/R2 was used as a universal reference and the methylation pattern for each time point of the two cell cultures was analyzed in relation to P7/R2 (Figure 1). The CpG sites were classified as de novo altered CpGs if the difference in β values was greater than 0.4 (gain of methylation) or less than − 0.4 (loss of methylation). Although the methylation of the P7/R2 cell line was highly correlated with the pre-crisis samples in each cell line, it was excluded from further analysis of differential methylation and expression in the S3R and S4 cell cultures.
Figure 1.
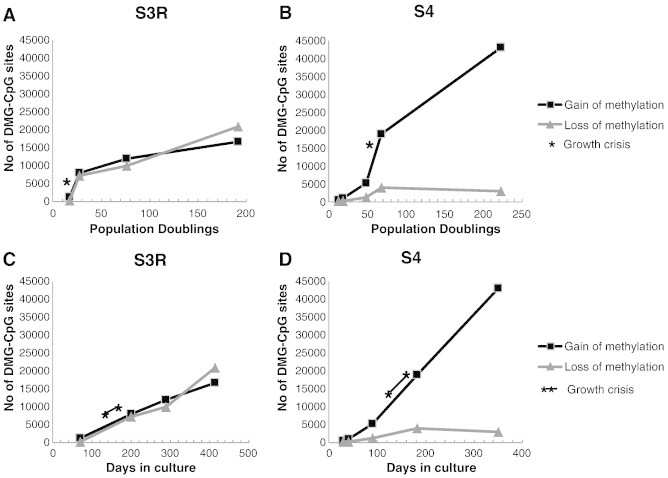
Methylation alterations accumulated during the immortalization process. The number of de novo altered CpG sites at increasing PDs (A and B) or days in culture (C and D) in S3R (A and C) and S4 (B and D) is shown. The gain of methylation is defined as δβ > 0.4, and loss of methylation is defined as δβ < − 0.4, compared with a stimulated primary T-cell culture (P7/R2). The growth crisis periods are marked with asterisks.
For each CpG site, the alteration between post-crisis and pre-crisis samples was measured with the maximum differences in methylation (δβ). CpG sites with an δβ greater than 0.4 or less than − 0.4 were classified as differentially methylated (DM-CpG). For gene expression, genes expressed at background level were censored to the largest of the 95th percentiles of the negative controls across the arrays. The alteration between post-crisis and pre-crisis samples was then measured with the maximum differences in log2-transformed censored intensities (M). Genes with an M value greater than log2(1.7) or less than − log2(1.7), corresponding to a fold change of 1.7 and expressed above background level were classified as differentially expressed genes (DEG). Further details of the analysis can be found in Supplementary Figure S2. Differently methylated gene (DMG) and DEG found in both cell cultures (DMG/DEG) were selected for further analysis (Figure 2). The significance of the overlaps between the two cell cultures was determined using the chi-square test.
Figure 2.
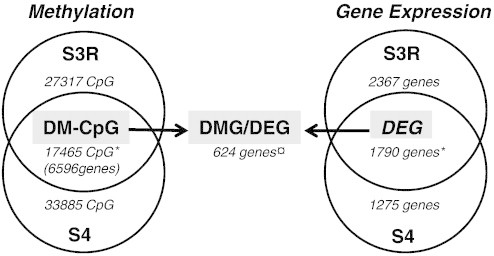
Commonly DM-CpG sites and differentially expressed genes in immortal T-cell cultures. (A) The DM-CpG sites (δβ > 0.4 or <−0.4) and the DMG (fold change ± 1.7) pre-crisis versus post-crisis in the S3R and S4 cell cultures were combined in Venn diagrams. The commonly DM-CpG sites (17,465 CpGs representing 6596 genes) and DEG (1790 genes) are highlighted in the figure as well as the combined DMG/DEG list (624 genes). There was a significantly higher proportion of common DM-CpG and DEG than expected by random (*P < .001) in the immortal cultures. In contrast, the number of genes that were both DMG and DEG was significantly smaller than expected (¤P < .001).
The significance of the overlap between DMG and DEG (Figure 2) and distributions of downregulated genes among methylated and demethylated genes (Table 2) were evaluated using a permutation-based test. While keeping the gene-CpG structure intact, the gene expression profiles were randomly assigned to genes 2000 times. Thus, the distributions under the null hypothesis of independence between methylation and gene expression and P values for the size of the overlap and the distribution of downregulated genes were obtained.
Table 2.
Decreased Gene Expression Was Associated with Increased Methylation around TSS and Decreased Methylation in Gene Body
| Genomic Region | Methylated | Demethylated |
|---|---|---|
| TSS1500 | 61* | 52 |
| TSS200 | 70*** | 50 |
| 5′UTR | 68*** | 53 |
| First exon | 60 | 0***1 |
| Body | 58 | 69*** |
| 3′UTR | 64 | 79*** |
The percentage of downregulated genes in gene regions that were methylated/demethylated is shown. For the significance based on permutation of gene expression probes, expected percentage of downregulated genes is 50% to 51% in all categories. The level of significance is represented by *P < .05, **P < .01, and ***P < .001; 1 denotes categories with less than five observations.
To analyze common methylation patterns between the two T-cell cultures and T-ALL samples, hierarchical clustering with Euclidean distance matrix using the Ward method [29] was performed and visualized in a heat map. Publicly available sorted T-cells (CD3 +) and hematopoietic stem cells (CD34+CD38 −) from healthy donors were used as controls. The methylation data from the sorted cells were previously published by the Cancer Genome Atlas Research Network [30] and were downloaded from the NCBI GEO database, GSE49618.
The polycomb target gene (PCTG) lists from Lee et al. [31] were compared with the genes with common methylation changes between T-ALL samples and T-cell cultures. We hypothesized that the proportion of PCTGs in the list of shared changed CpG sites was larger than expected by chance and we tested our hypothesis using a binominal test. The systems biology tool Metacore from GeneGo Inc (St Joseph, MI) was used to identify networks and processes of possible relevance for immortalization.
Results
Quality Control and Reproducibility of Methylation Array Data
The quality of each individual array was evaluated with the built-in controls, i.e., bisulfite conversion, staining, negative controls, hybridization, and specificity. A replicate sample was included in the HumMeth450K array to assess inter-assay reproducibility (R2 = 0.989). Selected genomic regions for TAL1 (cg19797376), KLF4 (cg07309102), TWIST1 (cg24446548), and HOXD8 (cg15520279) were separately analyzed by pyrosequencing at increasing PDs in the S3R and S4 cell cultures and compared with CpG site data from the HumMeth450K array, showing a strong correlation between the methods (Supplementary Figure S3).
DNA Methylation Alterations during T-Cell Immortalization
Genome-wide promoter methylation status was determined by the HumMeth450K array at different stages during spontaneous immortalization of the two human T-cell cultures, S3R and S4. Both cultures experienced a growth crisis period, between 21 and 25 PDs (93 days) in S3R and between 62 and 67 PDs (45 days) in S4. After pre-processing of the array data, as detailed in the Materials and Methods section and in Supplementary Figure S2, 330,354 CpG sites remained for analysis. The methylation status of these CpGs were analyzed at increasing PDs and compared with a primary stimulated T-cell culture (P7/R2). Both the S3R and S4 cultures showed an accumulation of de novo altered CpG sites with increasing PDs (Figure 1, A and B). The most pronounced change was observed in cultures escaping from the growth crisis period (S3R 27 PDs and S4 68 PDs; Figure 1, A and B). However, the growth crisis period lasted for a long period of time and when analyzing methylation changes in relation to days in culture the rate of changes appeared rather constant (Figure 1, C and D). The fraction of de novo methylated sites was, in S3R, 0.3% at 17 PDs (pre-crisis) and 5% at 192 PDs (post-crisis) and, in S4, 0.1% at 12 PDs (pre-crisis) and 13% at 223 PDs (post-crisis) of all CpG sites analyzed and in relation to the primary stimulated T-cell culture (P7/R2). Loss of methylation was less common in S4 in comparison to the S3R culture, in which gain and loss of methylation were equally common (Figure 1, A–D).
Next, by filtering for shared DM-CpG sites (demethylated or methylated) between the cultures pre-crisis versus post-crisis, a significantly larger overlap (P < .001) than expected by random was observed. This overlap consisted of 17,465 DM-CpGs with potential importance for immortalization (Figure 2). By focusing on these DM-CpGs, it was further shown that the unmethylated CpG sites close to transcription start sites (TSSs) (TSS200/exon 1) and CpG islands (islands/shores) were preferentially and gradually methylated during the process (Table 1 and Supplementary Figure S4). Demethylation was observed in methylated regions far away from CpG islands, here titled “open sea” and “shelf” (Table 1 and Supplementary Figure S4).
Table 1.
Preferential Methylation in CpG Islands and Regions around TSS
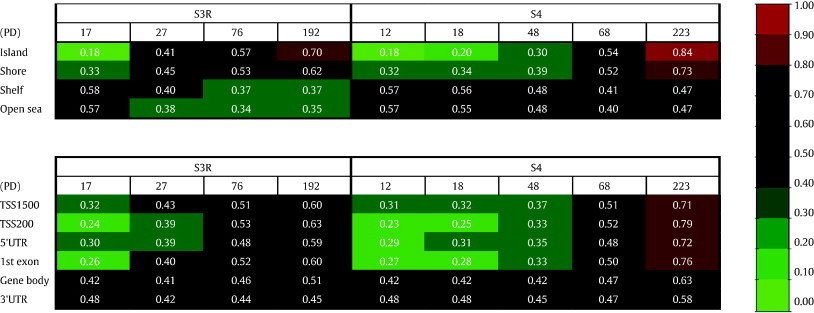
Average methylation (average β) of the commonly differently methylated 17,465 CpG sites for the respective genomic region and CpG island location is shown at increasing PDs. The colors represent a scale from unmethylated (green) to fully methylated (red) as shown in the figure.
Genomic Distribution of Coinciding DM-CpG Sites and Differently Expressed Genes
In addition to the DM-CpGs, a significant overlap (P < .001) of 1790 differently expressed genes (DEG) either upregulated or downregulated pre-crisis versus post-crisis was identified, indicating shared pathways for immortalization (Figure 2). A gene with at least one DM-CpG was defined as a DMG. The DMG and the DEG lists were combined and an overlap of 624 genes both differentially methylated and differentially expressed was identified (DMG/DEG). The DMG/DEG list was analyzed for associations to methylation in different genomic regions. A significant overrepresentation of downregulated genes was observed when methylation occurred close to TSS (P < .001; Table 2). In contrast, decreased methylation within the gene body region was associated with decreased expression (P < .001; Table 2). However, the DMG/DEG overlap was significantly lower than expected by random (P < .001), indicating that the majority of methylation alterations have little or no effect on gene expression levels (Figure 2).
Functional Analysis of Shared DM-CpGs in Immortal T-Cell Cultures and T-Cell Leukemia
To identify methylation alterations of potential importance for both in vitro T-cell immortalization and in vivo malignancy, we applied data from 10 diagnostic pediatric T-ALL samples (7 CIMP + and 3 CIMP −) on a heat map showing the 17,465 commonly altered CpGs in the immortal S3R and S4 T-cell cultures (Figure 2, Figure 3A). Sorted cells from healthy donors were used as controls [30]. CD34 +/CD38 − hematopoietic stem cells represented immature T-cells and CD3 + represented mature T-cells. Immature and mature T-cells showed similar methylation profiles as pre-immortal cell cultures regarding the CpG sites that were commonly altered during the immortalization process (Figure 3A).
Figure 3.
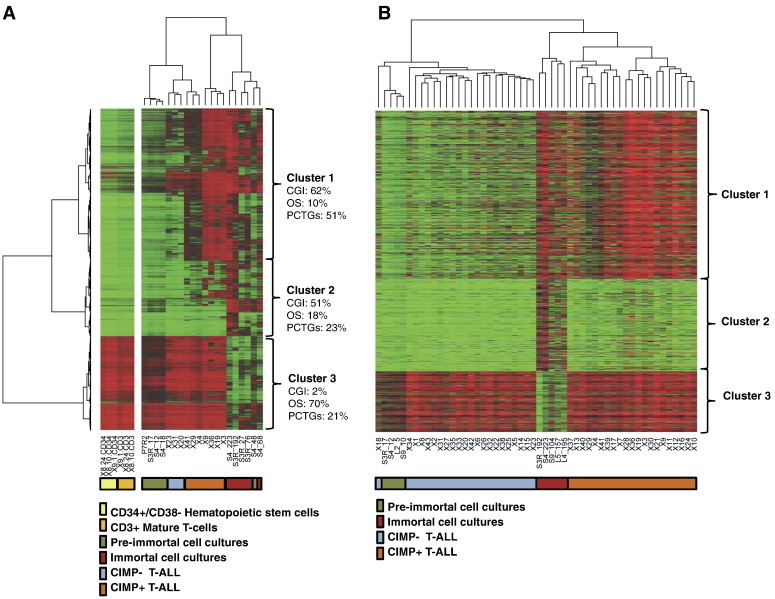
Shared methylation alterations in immortal T-cell cultures and diagnostic CIMP + T-ALL samples. (A) Methylation HumMeth450K array data for the commonly altered 17,465 CpGs in T-cell cultures visualized in a heat map together with 10 diagnostic T-ALL samples. Separated CD34 +/CD38 − (hematopoietic stem cells, n = 3) and CD3 + (mature T-cells, n = 3) cells from healthy donors were included as controls. The CpG sites were separated into three distinct clusters. The percentage of CpG sites located within CpG islands (CGI) and open sea (OS) regions in each cluster is displayed as well as the percentage of PCTGs in each cluster defined by Lee et al. [31]. The diagnostic T-ALL sample CIMP status is shown in the figure as well as the pre-immortal or post-immortal status of the cell cultures. (B) Verification of shared altered CpG sites in immortal cell cultures and in CIMP + T-ALL leukemias by HumMeth27K array analysis; 1478 CpGs of the 17,465 CpGs commonly altered CpG sites in immortal S3R and S4 cultures were present in the 27K array and used to verify data in a larger number of T-ALL samples and in three additional cell cultures derived from one patient with NBS (S9) and one healthy individual (L4 and L5).
Hierarchical clustering of the cell cultures and leukemias separated the CpGs into three clusters; cluster 1 in which de novo methylated CpGs in the immortal cells overlapped with methylated CpGs in CIMP + T-ALL diagnostic samples. CpGs in cluster 2 were de novo methylated in immortal cell cultures but less methylated in leukemia, and cluster 3 demethylated in immortal cell cultures but methylated in leukemia (Figure 3A). Bioinformatic analysis revealed a significant overrepresentation (P < .001) of PCTGs [31] compared to random methylation (Figure 3A) in all clusters, but the overrepresentation was most evident in cluster 1 where 51% of the CpG sites were located in PCTGs compared to 23% and 21%, respectively, in clusters 2 and 3. Furthermore, the majority (62%) of the shared CpG sites in immortal cell cultures and CIMP + leukemias were located in CpG islands.
To verify the overlap in altered genes in immortal T-cell cultures and CIMP + T-ALL, data from 43 diagnostic T-ALL samples analyzed on the HumMeth27K array as well as three additional cell cultures derived from one patient with NBS and one healthy individual were included; 1478 CpG sites of the 17,465 shared DM-CpGs (Figure 2) were present in the HumMeth27K array. Cell cultures and leukemias were clustered, and CpGs sorted in the three clusters were identified in Figure 3A. All immortal cell cultures showed similar alterations and cluster 1 was commonly methylated in immortal cell cultures and CIMP + leukemias (Figure 3B).
To further investigate the cellular pathways commonly altered in immortal cell cultures and leukemia, the list of shared DM-CpGs in cluster 1 (Figure 3A) was applied to Metacore process network analysis (Figure 4, A–C). The resulting P values were compared at increasing PDs in cell cultures, in grouped CIMP + (n = 7) and CIMP − (n = 3) leukemias, and the list of PCTGs [31] (Figure 4, A and B). This comparison allowed assessment of the number of alterations for each individual process network with corrections for pathway and gene list sizes. The process networks of highest relevance were cell adhesion, cytoskeletal remodeling, development, and signal transduction processes (Figure 4B). Interestingly, a large set of genes in the Wnt signaling pathway became methylated during immortalization of cell cultures and in diagnostic CIMP-positive leukemias (Figure 4C).
Figure 4.
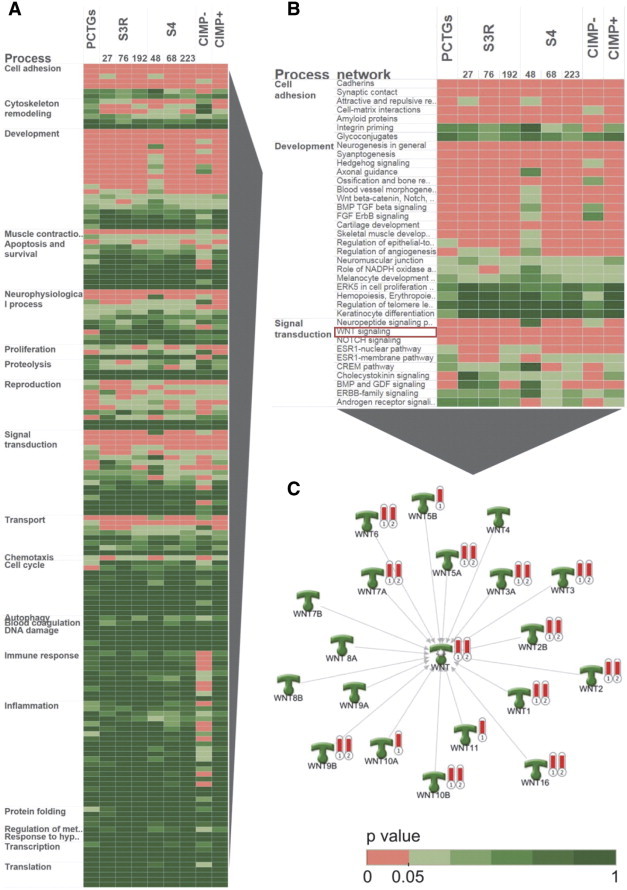
Ontology analysis of common cellular processes affected by methylation. Metacore process network analysis of the shared 8255 CpG sites (cluster 1; Figure 3A) between post-crisis T-cell cultures and diagnostic CIMP + T-ALL (A). CIMP − (n = 3) and CIMP + (n = 7) T-ALL samples were grouped in the analysis, whereas each time point is shown for the cell cultures. A significant process (P < .05) is indicated in red in the heat map. (B and C) The top processes in the Metacore process network analysis are shown as well as the WNT signaling genes representing a process with many affected genes. The red thermometers represents (1) polycomb target genes and (2) shared 8255 CpG sites in post-crisis T-cell cultures/CIMP + T-ALL.
To identify potentially deregulated components/pathways in the methylation and chromatin modifying machinery during immortalization, we analyzed gene expression of DNA methyltransferases (DNMT1, DNMT3A, and DNMT3B) and polycomb repressive complex 1 (PRC1) and PRC2 genes in the S3R and S4 cell cultures. PRC1/2 was significantly changed regarding the EZH2 (S3R, S4), BMI (S4), PCGF2 (S3R, S4), CBX2 (S3R, S4), and CBX6 (S3R, S4) genes, all showing up-regulation. In contrast, decreased levels of CBX4 (S3R) and CBX7 (S3R, S4) were recorded. In S3R, DNMT1 remained stable throughout the culture, whereas DNMT3A and DNMT3B decreased (Supplementary Figure S5). In contrast, S4 showed increased expression of DNMT1 and stable expression of DNMT3A and 3B (Supplementary Figure S5).
Discussion
Here, we have shown that spontaneous immortalization of T-cell cultures was associated with common DNA methylation alterations found to be shared at a high frequency with CIMP + T-ALL diagnostic samples, indicating that the in vitro established methylation alterations might be relevant in the clinical setting.
In our study, two IL-2–dependent T-cell cultures were analyzed with a high-density genome-wide methylation array at several time points, from primary culture, over a growth crisis period, and until clonal immortal cell cultures emerged (approximately 350-400 days). We have previously shown that the initial polyclonal cultures gradually became monoclonal indicating a continuous loss of cells likely due to the senescence program [8], [23]. Methylation changes were recorded in pre-immortal S4 cells already before the growth crisis period, which might have contributed to senescence bypass/growth crisis escape. The accumulation of methylation alterations was rather constant when analyzing changes against days in culture. In contrast, when analyzed in relation to PDs, the changes appeared more stepwise. Stepwise methylation changes have been recorded during immortalization of human mammary epithelial cell cultures in which a “stasis” (stress-induced senescence barrier) and a “telomere dysfunction” (i.e., crisis) barrier were identified [3], [32]. The immortalized human mammary epithelial cells were experimentally achieved and thereby not comparable to the spontaneously immortalized T-cells analyzed in the present study.
Both T-cell cultures studied showed an accumulation of de novo altered CpG sites during immortalization, with similar levels of gain and loss of methylation for S3R while culture S4 was dominated by gain of methylated CpG sites. Interestingly, the two cultures shared a large fraction of DM-CpG sites between pre-crisis and post-crisis cells. For these sites, a preferential gain of methylation in CpG islands and CpG sites located close to TSS was observed, whereas loss of methylation preferentially occurred in gene body regions and at sites located far away from CpG islands (“open sea”). Genomic regions close to TSS are known to contain a high density of CpG islands, whereas the gene body has a lower density, explaining the overlapping results of genomic regions and CpG island relations [9]. The chromosomal distribution of the methylation alterations paralleled the distribution of CpG sites on the array, and methylation alterations therefore appeared as a genome-wide phenomenon (data not shown).
The collected findings of common and non-random methylation changes in the immortalized T-cells indicate a functional meaning. One question was to what extent the methylation pattern was coupled to gene expression. To answer this question, we combined methylation data with our previously published gene expression array data [8]. Methylation and gene expression did not correlate for the majority of genes, indicating that many methylation alterations did not relate to gene expression. However, we could identify genes with strong negative or positive correlation to methylation status. The direction of the correlation seemed to depend on where in the promoter region the methylation occurred. Generally, silenced gene expression was significantly associated with increased methylation close to TSS and loss of methylation in the gene body region. However, increased methylation within the gene body was observed as well and might reflect the presence of enhancers or regulatory regions as recently suggested by Varley et al. [33].
To identify methylation alterations of potential importance for both in vitro T-cell immortalization and in vivo malignancy, we applied data from diagnostic pediatric T-ALL samples to the analysis. T-ALL originates from precursor cells in the bone marrow, whereas our T-cell culture models are derived from mature peripheral blood lymphocytes. However, the methylation profiles of the CpG sites that were differently methylated during the immortalization process were comparable between immature and mature cells from healthy donors and pre-immortal cell cultures and confirm our T-cell culture model as suitable for comparable analysis with T-ALL.
We have recently identified methylation alterations within T-ALL samples separating them into subgroups (CIMP +/CIMP −) with different prognosis [25]. Interestingly, a substantial fraction of the altered CpG sites observed in the T-cell cultures had similar methylation profiles in the CIMP + T-ALL samples. This commonality indicates that the in vitro established methylation changes were relevant also in the clinical setting. The affected CpG sites were not unbiased regarding the function of associated genes since differential methylation of PCTGs was overrepresented. Furthermore, bioinformatic analyses showed a pattern of overlapping networks among the affected genes in post-crisis T-cell cultures, CIMP + leukemias, and the PCTG list [31]. These shared processes were involved in cell adhesion, cytoskeleton remodeling, development, and signal transduction. Of special notice was a high number of methylation altered genes in the Wnt signaling pathways. The reason for this is unclear but indicates selectivity in the methylation targets.
Gene expression alterations of DNA methyltransferases (DNMT1, DNMT3A, and DNMT3B) as well as subunits in the PRC1/2 were observed in both cultures suggesting a functional role for the observed methylation changes during the immortalization process. Previous observations have shown that different DNA methylation changes typical for cancer cells may evolve from senescence-related alterations triggered by different stimuli [34] and altered DNA methylation acquired in senescent cells can be retained when these cells bypass senescence [35].
The three spontaneously immortalized cell cultures, S3R, S4, and S9, were derived from individuals diagnosed with NBS with increased risk of leukemia due to DNA repair deficiency. However, the patients were not diagnosed with any malignancy at the time when the cultures were established. The observed methylation alterations in the immortal NBS-derived T-cell cultures overlapped with T-cell cultures derived from a healthy individual (L4 and L5) indicating general accumulated methylation alterations during the immortalization process.
In conclusion, our analysis identified a high number of commonly methylated CpG sites in immortalized T-cell cultures and diagnostic CIMP + T-ALL samples with potential significance for malignant transformation. Whether CIMP + and CIMP − leukemias represent subtypes with different routes for transformation has to be further investigated. One alterative hypothesis is that CIMP + and CIMP − leukemias reflect cells with diverse replicative histories, where CIMP + leukemias might have undergone a large number of replication rounds and thereby demonstrate DNA methylation pattern similar to long-term cultured T-cells. These issues have to be further evaluated to better understand the relevance of methylation during immortalization and the development of hematological malignancies.
The following are the supplementary data related to this article.
Genomic regions and CpG island location in the HumMeth450K array. A graphical overview of the genomic regions (A) and the relation to CpG island (B) definitions.
Schematic figure over the pre-filtering steps of the HumMeth450K and HT-12 arrays. A flow chart detailing the array analyses including filtration, normalization, and differential identification for the methylation and gene expression arrays is shown. The tables describe the number of remaining CpG sites, genes, and gene-CpG site connections in each step of the analysis.
Pyrosequencing verified the HumMeth450K array data. (A) HOX9, (B) TAL1, (C) KLF4, and (D) TWIST1 analyzed by pyrosequencing at increasing PDs in the S3R and S4 cell cultures and related to the methylation status at the same CpG position in the HumMeth450K array.
Preferential gain of methylation within CpG islands and loss in gene body regions. The distribution of DM-CpG sites was analyzed in relation to CpG islands (A) and in relation to genomic regions (B) and compared with the distribution of the analyzed 330,354 CpG sites on the array.
Deregulated expression of DNMT1/3A/3B and PRC1 and PRC2 genes. (A) PRC1 and PRC2 were analyzed for differentially expressed genes in immortal T-cell cultures versus stimulated primary T-cells by gene expression array analysis and quantitative RT-PCR analysis verification of a selection of genes. (B and C) DNMT1, -3A, and -3B gene expression was analyzed by RT-PCR and normalized against TBP and expressed as a ratio against primary stimulated T-cells (P7/R2 and S1/PHA) for the S3R (B) and S4 (C) cell cultures.
Acknowledgments
This work was supported by grants from the Swedish Cancer Society (G.R.), the Swedish Research Council (G.R.), Dnr 340-2013-5185 (P.R.), the Swedish Childhood Cancer Foundation (G.R.), the Medical Faculty, Umeå University (G.R.), and Lion's Cancer Research Foundation, Umeå University (S.D. and G.R.). The research leading to these results has received funding from the European Community’s Seventh Framework Programme FP7/2007-2011 under grant agreement No. 200950 (G.R.).
Footnotes
This article refers to supplementary materials, which are designated by Supplementary Figure S1 to S5 and are available online at http://www.neoplasia.com.
Author contributions: S.D., M.L., W.N.K., and G.R. conceived and designed the experiments. S.D., J.K.S., E.E., and K.H.C. performed the experiments. S.D., M.L., P.R., E.F., M.B., and J.R. analyzed the data. S.D., M.L., J.K.S., W.N.K., and G.R., with contribution from coauthors, wrote the paper.
Conflict-of-interest disclosure: The authors declare no competing financial interests.
References
- 1.Fridman AL, Tainsky MA. Critical pathways in cellular senescence and immortalization revealed by gene expression profiling. Oncogene. 2008;27:5975–5987. doi: 10.1038/onc.2008.213. [DOI] [PMC free article] [PubMed] [Google Scholar]
- 2.Benanti JA, Wang ML, Myers HE, Robinson KL, Grandori C, Galloway DA. Epigenetic down-regulation of ARF expression is a selection step in immortalization of human fibroblasts by c-Myc. Mol Cancer Res. 2007;5:1181–1189. doi: 10.1158/1541-7786.MCR-06-0372. [DOI] [PubMed] [Google Scholar]
- 3.Novak P, Jensen TJ, Garbe JC, Stampfer MR, Futscher BW. Stepwise DNA methylation changes are linked to escape from defined proliferation barriers and mammary epithelial cell immortalization. Cancer Res. 2009;69:5251–5258. doi: 10.1158/0008-5472.CAN-08-4977. [DOI] [PMC free article] [PubMed] [Google Scholar]
- 4.Takai D, Jones PA. Comprehensive analysis of CpG islands in human chromosomes 21 and 22. Proc Natl Acad Sci U S A. 2002;99:3740–3745. doi: 10.1073/pnas.052410099. [DOI] [PMC free article] [PubMed] [Google Scholar]
- 5.Liu C, Fang X, Ge Z, Jalink M, Kyo S, Bjorkholm M, Gruber A, Sjöberg J, Xu D. The telomerase reverse transcriptase (hTERT) gene is a direct target of the histone methyltransferase SMYD3. Cancer Res. 2007;67:2626–2631. doi: 10.1158/0008-5472.CAN-06-4126. [DOI] [PubMed] [Google Scholar]
- 6.Renaud S, Loukinov D, Abdullaev Z, Guilleret I, Bosman FT, Lobanenkov V, Benhattar J. Dual role of DNA methylation inside and outside of CTCF-binding regions in the transcriptional regulation of the telomerase hTERT gene. Nucleic Acids Res. 2007;35:1245–1256. doi: 10.1093/nar/gkl1125. [DOI] [PMC free article] [PubMed] [Google Scholar]
- 7.Zinn RL, Pruitt K, Eguchi S, Baylin SB, Herman JG. hTERT is expressed in cancer cell lines despite promoter DNA methylation by preservation of unmethylated DNA and active chromatin around the transcription start site. Cancer Res. 2007;67:194–201. doi: 10.1158/0008-5472.CAN-06-3396. [DOI] [PubMed] [Google Scholar]
- 8.Degerman S, Siwicki JK, Osterman P, Lafferty-Whyte K, Nicol Keith W, Roos G. Telomerase upregulation is a postcrisis event during senescence bypass and immortalization of two Nijmegen breakage syndrome T cell cultures. Aging Cell. 2010;9:220–235. doi: 10.1111/j.1474-9726.2010.00550.x. [DOI] [PubMed] [Google Scholar]
- 9.McCabe MT, Brandes JC, Vertino PM. Cancer DNA methylation: molecular mechanisms and clinical implications. Clin Cancer Res. 2009;15:3927–3937. doi: 10.1158/1078-0432.CCR-08-2784. [DOI] [PMC free article] [PubMed] [Google Scholar]
- 10.Boultwood J, Wainscoat JS. Gene silencing by DNA methylation in haematological malignancies. Br J Haematol. 2007;138:3–11. doi: 10.1111/j.1365-2141.2007.06604.x. [DOI] [PubMed] [Google Scholar]
- 11.Esteller M. Epigenetics in cancer. N Engl J Med. 2008;358:1148–1159. doi: 10.1056/NEJMra072067. [DOI] [PubMed] [Google Scholar]
- 12.Costello JF, Frühwald MC, Smiraglia DJ, Rush LJ, Robertson GP, Gao X, Wright FA, Feramisco JD, Peltomaki P, Lang JC. Aberrant CpG-island methylation has non-random and tumour-type-specific patterns. Nat Genet. 2000;24:132–138. doi: 10.1038/72785. [DOI] [PubMed] [Google Scholar]
- 13.Ehrich M, Turner J, Gibbs P, Lipton L, Giovanneti M, Cantor C, van den Boom D. Cytosine methylation profiling of cancer cell lines. Proc Natl Acad Sci U S A. 2008;105:4844–4849. doi: 10.1073/pnas.0712251105. [DOI] [PMC free article] [PubMed] [Google Scholar]
- 14.Martin-Subero JI, Ammerpohl O, Bibikova M, Wickham-Garcia E, Agirre X, Alvarez S, Bruggemann M, Bug S, Calasanz MJ, Deckert M. A comprehensive microarray-based DNA methylation study of 367 hematological neoplasms. PLoS One. 2009;4:e6986. doi: 10.1371/journal.pone.0006986. [DOI] [PMC free article] [PubMed] [Google Scholar]
- 15.Teschendorff AE, Menon U, Gentry-Maharaj A, Ramus SJ, Gayther SA, Apostolidou S, Jones A, Lechner M, Beck S, Jacobs IJ. An epigenetic signature in peripheral blood predicts active ovarian cancer. PLoS One. 2009;4:e8274. doi: 10.1371/journal.pone.0008274. [DOI] [PMC free article] [PubMed] [Google Scholar]
- 16.Shao G, Balajee AS, Hei TK, Zhao Y. p16INK4a downregulation is involved in immortalization of primary human prostate epithelial cells induced by telomerase. Mol Carcinog. 2008;47:775–783. doi: 10.1002/mc.20434. [DOI] [PubMed] [Google Scholar]
- 17.Tzatsos A, Pfau R, Kampranis SC, Tsichlis PN. Ndy1/KDM2B immortalizes mouse embryonic fibroblasts by repressing the Ink4a/Arf locus. Proc Natl Acad Sci U S A. 2009;106:2641–2646. doi: 10.1073/pnas.0813139106. [DOI] [PMC free article] [PubMed] [Google Scholar]
- 18.Koch CM, Joussen S, Schellenberg A, Lin Q, Zenke M, Wagner W. Monitoring of cellular senescence by DNA-methylation at specific CpG sites. Aging Cell. 2012;11:366–369. doi: 10.1111/j.1474-9726.2011.00784.x. [DOI] [PubMed] [Google Scholar]
- 19.Koch CM, Reck K, Shao K, Lin Q, Joussen S, Ziegler P, Walenda G, Drescher W, Opalka B, May T. Pluripotent stem cells escape from senescence-associated DNA methylation changes. Genome Res. 2013;23:248–259. doi: 10.1101/gr.141945.112. [DOI] [PMC free article] [PubMed] [Google Scholar]
- 20.Bork S, Pfister S, Witt H, Horn P, Korn B, Ho AD, Wagner W. DNA methylation pattern changes upon long-term culture and aging of human mesenchymal stromal cells. Aging Cell. 2010;9:54–63. doi: 10.1111/j.1474-9726.2009.00535.x. [DOI] [PMC free article] [PubMed] [Google Scholar]
- 21.Grafodatskaya D, Choufani S, Ferreira JC, Butcher DT, Lou Y, Zhao C, Scherer SW, Weksberg R. EBV transformation and cell culturing destabilizes DNA methylation in human lymphoblastoid cell lines. Genomics. 2010;95:73–83. doi: 10.1016/j.ygeno.2009.12.001. [DOI] [PubMed] [Google Scholar]
- 22.Zhang Z, Liu J, Kaur M, Krantz ID. Characterization of DNA methylation and its association with other biological systems in lymphoblastoid cell lines. Genomics. 2012;99:209–219. doi: 10.1016/j.ygeno.2012.01.002. [DOI] [PMC free article] [PubMed] [Google Scholar]
- 23.Siwicki JK, Degerman S, Chrzanowska KH, Roos G. Telomere maintenance and cell cycle regulation in spontaneously immortalized T-cell lines from Nijmegen breakage syndrome patients. Exp Cell Res. 2003;287:178–189. doi: 10.1016/s0014-4827(03)00140-x. [DOI] [PubMed] [Google Scholar]
- 24.Siwicki JK, Hedberg Y, Nowak R, Lodén M, Zhao J, Landberg G, Roos G. Long-term cultured IL-2-dependent T cell lines demonstrate p16INK4a overexpression, normal pRb/p53, and upregulation of cyclins E or D2. Exp Gerontol. 2000;35:375–388. doi: 10.1016/s0531-5565(00)00088-7. [DOI] [PubMed] [Google Scholar]
- 25.Borssén M, Palmqvist L, Karrman K, Abrahamsson J, Behrendtz M, Heldrup J, Forestier E, Roos G, Degerman S. Promoter DNA methylation pattern identifies prognostic subgroups in childhood T-cell acute lymphoblastic leukemia. PLoS One. 2013;8:e65373. doi: 10.1371/journal.pone.0065373. [DOI] [PMC free article] [PubMed] [Google Scholar]
- 26.Marabita F, Almgren M, Lindholm ME, Ruhrmann S, Fagerström-Billai F, Jagodic M, Sundberg CJ, Ekstrom TJ, Teschendorff AE, Tegnér J. An evaluation of analysis pipelines for DNA methylation profiling using the Illumina HumanMethylation450 BeadChip platform. Epigenetics. 2013;8:333–346. doi: 10.4161/epi.24008. [DOI] [PMC free article] [PubMed] [Google Scholar]
- 27.Teschendorff AE, Marabita F, Lechner M, Bartlett T, Tegner J, Gomez-Cabrero D, Beck S. A beta-mixture quantile normalization method for correcting probe design bias in Illumina Infinium 450 k DNA methylation data. Bioinformatics. 2013;29:189–196. doi: 10.1093/bioinformatics/bts680. [DOI] [PMC free article] [PubMed] [Google Scholar]
- 28.Schmittgen TD, Livak KJ. Analyzing real-time PCR data by the comparative C(T) method. Nat Protoc. 2008;3:1101–1108. doi: 10.1038/nprot.2008.73. [DOI] [PubMed] [Google Scholar]
- 29.Ward JH., Jr. Hierarchical grouping to optimize an objective function. J Am Stat Assoc. 1963;58:236–244. [Google Scholar]
- 30.Cancer Genome Atlas Research Network Genomic and epigenomic landscapes of adult de novo acute myeloid leukemia. N Engl J Med. 2013;368:2059–2074. doi: 10.1056/NEJMoa1301689. [DOI] [PMC free article] [PubMed] [Google Scholar]
- 31.Lee TI, Jenner RG, Boyer LA, Guenther MG, Levine SS, Kumar RM, Chevalier B, Johnstone SE, Cole MF, Isono K. Control of developmental regulators by Polycomb in human embryonic stem cells. Cell. 2006;125:301–313. doi: 10.1016/j.cell.2006.02.043. [DOI] [PMC free article] [PubMed] [Google Scholar]
- 32.Garbe JC, Bhattacharya S, Merchant B, Bassett E, Swisshelm K, Feiler HS, Wyrobek AJ, Stampfer MR. Molecular distinctions between stasis and telomere attrition senescence barriers shown by long-term culture of normal human mammary epithelial cells. Cancer Res. 2009;69:7557–7568. doi: 10.1158/0008-5472.CAN-09-0270. [DOI] [PMC free article] [PubMed] [Google Scholar]
- 33.Varley KE, Gertz J, Bowling KM, Parker SL, Reddy TE, Pauli-Behn F, Cross MK, Williams BA, Stamatoyannopoulos JA, Crawford GE. Dynamic DNA methylation across diverse human cell lines and tissues. Genome Res. 2013;23:555–567. doi: 10.1101/gr.147942.112. [DOI] [PMC free article] [PubMed] [Google Scholar]
- 34.Decottignies A, d'Adda di Fagagna F. Epigenetic alterations associated with cellular senescence: a barrier against tumorigenesis or a red carpet for cancer? Semin Cancer Biol. 2011;21:360–366. doi: 10.1016/j.semcancer.2011.09.003. [DOI] [PubMed] [Google Scholar]
- 35.Cruickshanks HA, McBryan T, Nelson DM, Vanderkraats ND, Shah PP, van Tuyn J, Singh Rai T, Brock C, Donahue G, Dunican DS. Senescent cells harbour features of the cancer epigenome. Nat Cell Biol. 2013;15:1495–1506. doi: 10.1038/ncb2879. [DOI] [PMC free article] [PubMed] [Google Scholar]
Associated Data
This section collects any data citations, data availability statements, or supplementary materials included in this article.
Supplementary Materials
Genomic regions and CpG island location in the HumMeth450K array. A graphical overview of the genomic regions (A) and the relation to CpG island (B) definitions.
Schematic figure over the pre-filtering steps of the HumMeth450K and HT-12 arrays. A flow chart detailing the array analyses including filtration, normalization, and differential identification for the methylation and gene expression arrays is shown. The tables describe the number of remaining CpG sites, genes, and gene-CpG site connections in each step of the analysis.
Pyrosequencing verified the HumMeth450K array data. (A) HOX9, (B) TAL1, (C) KLF4, and (D) TWIST1 analyzed by pyrosequencing at increasing PDs in the S3R and S4 cell cultures and related to the methylation status at the same CpG position in the HumMeth450K array.
Preferential gain of methylation within CpG islands and loss in gene body regions. The distribution of DM-CpG sites was analyzed in relation to CpG islands (A) and in relation to genomic regions (B) and compared with the distribution of the analyzed 330,354 CpG sites on the array.
Deregulated expression of DNMT1/3A/3B and PRC1 and PRC2 genes. (A) PRC1 and PRC2 were analyzed for differentially expressed genes in immortal T-cell cultures versus stimulated primary T-cells by gene expression array analysis and quantitative RT-PCR analysis verification of a selection of genes. (B and C) DNMT1, -3A, and -3B gene expression was analyzed by RT-PCR and normalized against TBP and expressed as a ratio against primary stimulated T-cells (P7/R2 and S1/PHA) for the S3R (B) and S4 (C) cell cultures.