Abstract
Magnetic Block Ionomer Clusters (MBIClusters) with hydrophilic ionic cores and nonionic coronas have been prepared that have ultrahigh transverse NMR relaxivities together with capacities for incorporating high concentrations of polar antibiotic payloads. Magnetite-polymer nanoparticles were assembled by adsorbing the polyacrylate block of an aminofunctional poly(ethylene oxide-b-acrylate) (H2N-PEO-b-PAA) copolymer onto magnetite nanoparticles. The PEO blocks extended into aqueous media to keep the nanoparticles dispersed. Amines at the tips of the H2N-PEO corona were then linked through reaction with a PEO diacrylate oligomer to yield MBIClusters where the metal oxide in the precursor nanoparticles were distinctly separated by the hydrophilic polymer. The intensity average spacing between the magnetite nanoparticles within the clusters was estimated to be ~50 nm. These MBIClusters with hydrophilic intra-cluster space had transverse relaxivities (r2’s) that increased from 190 to 604 s−1 mM Fe−1 measured at 1.4 T and 37 °C as their average sizes increased. The clusters were loaded with up to ~38 wt% of the multi-cationic drug gentamicin. MRI scans focused on the livers of mice demonstrated that these MBIClusters are sensitive contrast agents.
Keywords: magnetite, block ionomer, relaxivity, contrast agent, MRI
Introduction
Magnetite nanoparticles have emerged as versatile probes for biomedical applications, especially as contrast agents for magnetic resonance imaging (MRI). Early MRI results with magnetite-dextran agents that were ~150 nm in average diameter established that the particles accumulated preferentially in normal tissue in the liver and spleen with less accumulation in cancerous tissue, thus allowing for diagnosing hepatic and splenic tumors.1–3 In the past decade, multifunctional magnetite nanocarriers that integrate therapeutic agents into one system have attracted considerable interest because they may enable monitoring of biodistribution via MRI together with treatment.4–8 The concept is challenging, however, because the contrast agents can disperse broadly in vivo and sufficient concentrations must accumulate in close proximity to provide good contrast. Another emerging application of magnetic particles is for cell-based therapies where cells can be labeled with magnetite and potentially monitored with T2- and T2*-weighted MRI in vivo following transplantation.9–14 However, it is desirable to monitor cell migration and differentiation, and again, a challenge is to improve detection sensitivity.15–21 Therefore, particles and agents with high transverse relaxivities are needed to improve upon tracking efficiencies of labeled cells as well as monitoring biodistribution of encapsulated drugs.
Magnetite nanoparticles are of interest as contrast-enhancement agents for T2-weighted MRI due to their high magnetization, low toxicities and surface properties that allow for coatings to be applied so that the particles can be dispersed under physiological conditions.5,6,8,12,22 The contrast is generated through dephasing of the magnetic moment of water protons near these complexes in the transverse plane, and higher rates of relaxation correlate with improved signal in the images. Recent results strongly suggest that the nanoscale size of magnetite-polymer particles is important for obtaining high transverse relaxivity.23–28 We previously reported magnetite nanoparticles coated with copolyethers and showed that they could be aggregated slightly by tuning the hydrophobic versus hydrophilic compositions of the copolymers. Small increases in intensity average hydrodynamic diameter (from approximately 50 to 75 nm) were associated with transverse relaxivities that increased from approximately 150 to 240 s−1 mM Fe−1. This was encouraging, and the best relaxivities obtained using that approach were about a factor of 1.7 better than commercial materials such as Feridex (as reported herein).26 We also introduced the concept that a hydrophilic space between magnetic nanoparticles in a cluster may be important for increasing relaxivities, and developed a model which predicted that ~100 nm between particles in an aggregate would be optimal.25,29 To test the model, functionalized ferritin protein was crosslinked to produce ~1.2 nm between the proteins. Transverse relaxivities increased by ~70% even with the small spacing over the non-crosslinked analogue, but the relaxivities of ferritin are low and this only produced a maximum relaxivity of ~16 s−1 mM Fe−1. Related materials that contained magnetite clusters in hydrophobic cores have also been reported.30 Altogether, both theoretical and experimental investigations of relationships among the properties of polymer coatings, sizes of aggregates, and relaxivities of the complexes have been initiated, but the optimal structure-relaxivity parameters remain far from defined.
We have prepared magnetite-polymer nanoparticles by adsorbing poly(ethylene oxide-b-acrylate) (PEO-b-PAA) onto magnetite.31 A portion of the PAA block of the copolymer complexed with the metal oxide surfaces to form a core, while the PEO component extended into aqueous media to form a corona. Realizing the need to enhance detection sensitivity of the nanocarriers, we herein report Magnetic Block Ionomer Clusters (MBIClusters) with controlled sizes and with significant hydrophilic space between the magnetite particles within the clusters. Their prominent longditudinal and transverse relaxivities together with high capacities for encapsulating cationic therapeutic agents makes these highly promising as future MRI probes.
Experimental
Materials
Benzyl alcohol (>98%), diethyl ether, iron (III) acetylacetonate (Fe(acac)3), oleic acid (90%, technical grade), triethylamine (>99.5%), pentamethyldiethylenetriamine (PMDETA), bromoisobutyryl bromide, gentamicin sulfate and poly(ethylene glycol) diacrylate (PEGDA, 700 g mol−1) were purchased from Aldrich and used as received 3-Hydroxypropyldimethylvinylsilane and N-(t-butoxycarbonyl)-2-aminoethanethiol were synthesized following previously-reported procedures.31–32 t-Butyl acrylate (tBA, 99%) and Celite® (filter aid standard super-cel) were purchased from Alfa Aesar. tBA was distilled from calcium hydride before polymerization. Toluene (anhydrous), tetrahydrofuran (HPLC grade), dichloromethane (HPLC grade), hexane (HPLC grade), and acetone were purchased from Fisher Scientific and used as received. Dialysis tubing was obtained from Spectra/Por. Phosphate buffered saline (PBS) was obtained from Mediatech, Inc.
Characterization
Dynamic Light Scattering (DLS) measurements were conducted with a Malvern Zetasizer NanoZS particle analyzer (Malvern Instruments Ltd) at a wavelength of 633 nm from a 4.0 mW, solid-state He-Ne laser at a scattering angle of 173° and at 25.0 ± 0.1 °C. The samples were dispersed in DI water at a concentration of 0.1 mg mL−1, and the dispersion was sonicated for 5 min in a 75T VWR Ultrasonicator (120 W, 45 kHz). Then 1 mL of the dispersion was transferred into a polystyrene cuvette for analysis. Thermogravimetric analyses (TGA) were carried out on the samples using a TA Instruments TGA Q500 to determine the fraction of each complex that was comprised of magnetite. Each sample (10–15 mg) was first held at 110 ºC for 10 min to drive off any excess moisture. The sample was equilibrated at 100 ºC, then the temperature was ramped at 10 °C min−1 to a maximum of 700 ºC in a nitrogen atmosphere. The mass remaining was recorded throughout the experiment. The mass remaining at 700 °C was taken as the fraction of magnetite in the complexes. The experiments were conducted in triplicate.
Transmission electron microscopy (TEM) was performed on a Philips EM-420 field emission gun TEM operating at an acceleration voltage of 120 kV. Samples were prepared by casting a drop of a dilute aqueous solution of the MBICs or MBIClusters onto amorphous carbon-coated copper grids. Images were acquired at a magnification of 96,000X.
A 7T MPMS SQuID magnetometer (Quantum Design) was used to determine magnetic properties. Hysteresis loops were generated for the magnetite nanoparticles at 300K. Inductively coupled plasma-atomic emission spectroscopy (ICP-AES) was performed with a SPECTRO ARCOS 165 ICP spectrometer (SPECTRO Analytical Instruments, Germany). The particles were digested to release free iron by reacting them with concentrated nitric acid at a concentration of 0.02 mg mL−1 for 5 days at 25 °C. They were diluted to 0.002 mg mL−1 with DI water prior to measurement.
Preparation of magnetic block ionomer complexes (MBICs)
Block copolymers with molecular weights of 3.5K-6.8K and 3.5K-9.5K H2N-PEO-b-PAA were prepared in our laboratories as described previously in supporting information by synthesizing a H2N-PEO-Br macroinitiator and using it with ATRP to prepare poly(t-butyl acrylate) blocks, then the t-butyl groups were removed.31 The molecular weights and compositions of the copolymers were determined using size exclusion chromatography and 1H NMR respectively (see supplemental data). Oleic acid-coated magnetite nanoparticles were synthesized as described previously.31 The particles (50 mg) in chloroform were charged into a 50-mL round-bottom flask. H2N-PEO-b-PAA (100.0 mg) was dissolved in DMF (10 mL) and added to the dispersion. The mixture was sonicated in a VWR 75T Ultrasonicator for 4 h under N2, and then stirred at RT for 24 h. The nanoparticles were precipitated in hexane (200 mL). A permanent magnet was utilized to collect the magnetite nanoparticles and free oleic acid was decanted with the supernatant. The particles were dried under vacuum, then dispersed in DI water (20 mL) with adjustment of the pH to 7 with 1 N NaOH and sonicated for 30 min. The particles were dialyzed against DI water (1 L) for 24 h in a 25,000 g mol−1 MWCO cellulose acetate dialysis bag to remove any free polymer. The dispersion was sterilized by filtration through a 0.2 3m Teflon filter. A black-brown solid product was obtained after freeze-drying with a yield of >85%.
Crosslinking the MBICs to form MBIClusters
The amine termini on the tips of the PEO coronas were crosslinked with PEGDA to form MBIClusters. The reactant concentrations were 10, 20 or 30 mg mL−1. A stock solution of PEGDA (700 g mol−1) was prepared by dissolving 250 mg of PEGDA in 10 mL of DI water, then a stoichiometric amount of the PEGDA solution was added to the MBIC dispersion. For example, to crosslink MBICs that contained 67 wt% of H2N- PEO-b-PAA with block molecular weights of 3.5K-6.8K at a total reactant concentration of 20 mg mL−1, MBICs (100 mg, 7 x 10⁻⁶ eq of amine on H2N-PEO-PAA) were dispersed in 5 mL of DI water, the mixture was sonicated for 5 min, then the pH was adjusted to 7.8 with 1 N aq NaOH. The PEGDA stock solution (100 3L, 7 x 10⁻⁶ eq of acrylate) was added dropwise to the MBIC dispersion with stirring at room temperature over ~5 min. The mixture was stirred at 37 °C for 24 h, then dialyzed against DI water in a 25,000 g mol−1 MWCO dialysis bag for 24 h to remove any unreacted PEGDA. The product was recovered by freeze-drying.
Incorporation of gentamicin into MBIClusters
MBIClusters (40 mg, 2.18 x 10⁻⁴ eq COOH) were weighed into a 20-mL glass vial. Gentamicin sulfate solution in 10 mM phosphate buffer at pH 7.2 (45 mg gentamicin sulfate, 27 mg gentamicin, 5 mL) was added. The solution was sonicated for 5 min and transferred to a centrifugal filter unit equipped with a cellulose acetate membrane (MWCO of 10,000 g mol−1). The free drug and salt solution were removed by centrifuging the dispersion at 3750 rpm for 1 h. This allowed the liquid to pass through the membrane into the bottom of the centrifugation unit, and the particles were collected on the membrane. They were removed from the membrane by redispersing them in a small amount of DI water (10 mL), and then the dispersion was freeze-dried to obtain gentamicin-loaded MBIClusters
The amount of gentamicin in the MBIClusters was measured by reacting the primary amines in the gentamicin-loaded MBIClusters with phthalaldehyde and mercaptoethanol in borate buffer at pH 9.7.47 The fluorescence emission intensity was measured in a fluorimeter (Biotek, USA) using an excitation wavelength of 340 nm and an emission wavelength of 450 nm. All samples including a series of standard solutions of gentamicin were transferred into 48-well plates and their fluorescence emission was measured. The concentration of gentamicin was calculated from a standardized calibration curve.
Relaxivity measurements
The proton transverse relaxation times (T2) and longitudinal relaxation times (T1) were measured on a Model mq-20 or mq-60 NMR Analyzer (Bruker Minispec) at a magnetic field strength of either 0.47 (ωo = 20 MHz) or 1.4 T (ωo = 60 MHz) and at 25 or 37.5 °C. T2 was obtained from fitting a monoexponential decay curve to signal data generated by a Carr-Purcell-Meiboom-Gill (CPMG) spin-echo pulse sequence with an echo spacing of 1 ms and a repetition time of 6000 ms. T1’s were obtained from fitting a monoexponential recovery curve to signal data generated with an inversion recovery (IR) pulse sequence using ten logarithmically spaced inversion times between 50 and 10,000 ms. Samples were diluted in DI water in the concentration range of 0.01–0.001 wt% and 500 μL of each concentration was transferred into a 7.5 mm NMR tube and equilibrated for 15 min prior to measurements. To measure relaxivities at high fields, T1 and T2 relaxation times of five samples at different concentrations were measured on 4.7 T/40-cm, 7 T/21-cm, and 11.7 T/31-cm horizontal bore small animal MRI scanners (Bruker, MA). The images were fitted with a 3-parameter function to calculate T1 and T2 values using the Bruker TopSpin built-in image-processing program. The relaxivities were calculated from the least-squares fit of the relaxation rate (1/T2 or 1/T1) as a function of iron concentration (mM Fe). Fe concentrations were determined by inductively coupled plasma-atomic emission spectroscopy (ICP-AES, Varian Vista Axial CCD) as described above.
MRI parameters
Phantom MR images were measured to demonstrate that the enhanced r2 relaxivities of the MBIClusters led to superior images relative to those of the non-crosslinked MBICs. MBICs (55 nm intensity average diameter) and MBIClusters (174 nm intensity average diameter) were dispersed in DI water at Fe concentrations ranging from 0 to 200 μM Fe. The dispersions were transferred to 1.5 mL Eppendorf tubes and mounted in a 1.5 wt% agarose gel in a glass container. MRI was performed on a 4.7 T small animal MRI scanner with a 40-cm horizontal bore (Bruker). T2-weighted MR images were acquired with a spin- echo sequence with repetition time (TR) = 2,400 ms, echo time (TE) = 63 ms, flip angle = 180°, matrix size = 128 x 128 and slice thickness = 1.00 mm. T1-weighted MR images were acquired with a FLASH sequence with TR = 150 ms, TE = 2.7 ms and FA angle = 90°. Six adult male B6 mice (25–30 g) were used to obtain images of the biodistribution of particles. All animal work was perfomed according to the guidelines of the Animal Care and Use Committee and the Animal Health and Care Section of the National Institute of Neurological Disorders and Stroke, National Institutes of Health (Bethesda, MD). For tail vein injection, the animals were initially anesthetized with 4% isoflurane in 3:3:2 air:nitrogen:oxygen, and kept on 1.5–2.5% isoflurane during the infusions. For MRI scans, the mice were placed in a custom made plastic holder. The anesthesia was maintained at 1.5–2.0% using a nose cone and rectal temperature was maintained at 37 ± 1 °C by a heated water bath. No abnormalities were observed after injection in any of the mice. MRI’s were acquired on a 7T/21cm horizontal bore Bruker Biospec System. The images were acquired using a Fast Low Angle SHot (FLASH) sequence synchronized to respiratory motion. The echo time (TE) was 10 ms, the repetition time (TR) was ~300 ms and the excitation flip angle was 30°. Each set consisted of 16 slices with no gap and a FOV of 3.84 x 2.56 x 1.2 cm, matrix 128 x 192 x 16.
Results and Discussion
Synthesis of MBIClusters
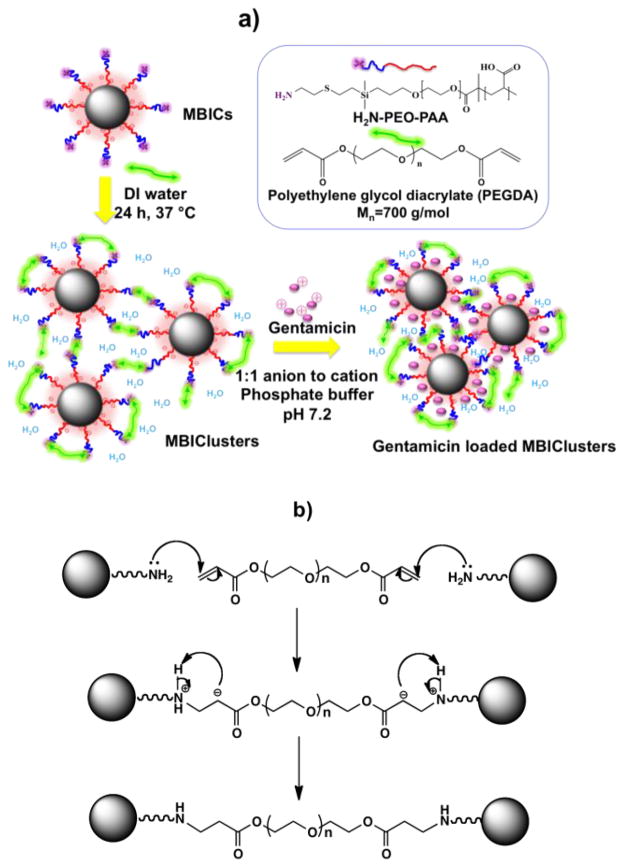
H2N-PEO-b-PAA block copolymers were synthesized through controlled radical polymerization of t-butyl acrylate initiated by a protected aminofunctional PEO macroinitiator.31 The t-butyl esters and the tBoc protecting group on the amine terminus were subsequently removed to yield diblock H2N-PEO-b-PAA copolymers. Two copolymers with number average molecular weights of 3.5K-6.8K and 3.5K-9.5K H2N-PEO-b-PAA were utilized. Magnetite nanoparticles were synthesized by reducing Fe(acac)3 in benzyl alcohol. Each H2N-PEO-b-PAA was coated onto the magnetite through ligand adsorption of a portion of the carboxylates on the PAA block. A targeted composition of 33:67 wt:wt magnetite:polymer was utilized that allowed for carboxylate adsorption onto the nanoparticles and also for a significant fraction of the carboxylates to remain free for subsequent salt formation with charged drugs. TGA indicated that the compositions were ~34 wt% magnetite and ~66 wt% polymer in close agreement with the targeted composition. When dispersed in water, core-shell nanoparticles formed that had PAA-magnetite hydrophilic cores and PEO coronas with amine tips on their outer peripheries. Clusters were formed from these complexes by crosslinking the amines on the corona tips with acrylates on poly(ethylene oxide) diacrylate wherein the magnetite nanoparticles were separated by the hydrophilic polymer around each precursor (Figure 1).
Fig. 1.
(a) Synthesis of MBIClusters containing magnetite contrast agents with hydrophilic spacing in the cores and subsequent drug loading via electrostatic interactions of complementary charged molecules. (b) chemistry of the crosslinking reaction to form MBIClusters
To distinguish the precursor magnetite-polymer nanoparticles from the clusters, the precursors will be designated as Magnetic Block Ionomer Complexes (MBICs), while the clusters will be called Magnetic Block Ionomer Clusters (MBIClusters).
The cluster sizes were controlled by adjusting the reactant concentrations in the crosslinking step (Table 1). In each case, a 1:1 ratio of amines to acrylate groups was utilized. The hydrophilic, oligomeric, crosslinking reagent reacted with amines on the coronas in water to form both inter- and intra-particle links. As the concentration in the crosslinking reaction was increased, inter-particle crosslinking became more pronounced, thus increasing the average cluster sizes. TGA confirmed that the composition of the MBIClusters was 32 wt% magnetite and 68 wt% polymer (including the crosslinking reagent), as expected.
Table 1.
Intensity and z-average diameters of MBICs vs MBIClusters as a function of reactant concentration in the crosslinking step
| Sample | Crosslinking concentration (mg mL−1) | Block ionomer (H2N-PEO-b- PAA) | Intensity average diameter (nm) | Z average diameter (nm) | PDI |
|---|---|---|---|---|---|
| MBICs | - | 3.5K–6.8K | 55±2 | 45±1 | 0.19 |
| 3.5K–9.5K | 50±2 | 42±1 | 0.23 | ||
| MBIClusters | 10 | 3.5K–6.8K | 119±6 | 97±3 | 0.24 |
| 3.5K–9.5K | 105±2 | 83±2 | 0.20 | ||
| 20 | 3.5K–6.8K | 143±5 | 135±1 | 0.21 | |
| 3.5K–9.5K | 139±4 | 110±1 | 0.22 | ||
| 30 | 3.5K–6.8K | 181±2 | 161±2 | 0.12 | |
| 3.5K–9.5K | 174±2 | 155±1 | 0.11 |
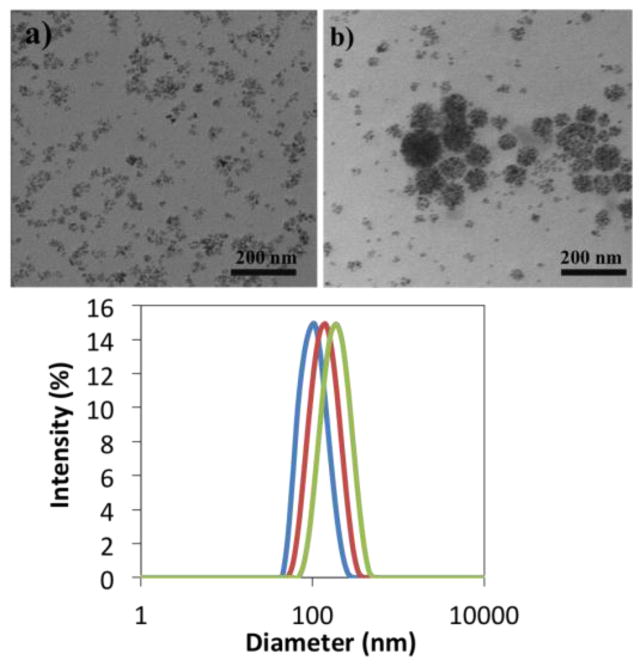
TEM images of the non-crosslinked particles suggested that they formed small aggregates in water (Figure 2a). It was reasoned that this was likely a result of interparticle interactions among cationic ammonium groups on the particle coronas with anionic carboxylates on a neighboring particle. It is noteworthy that analogous non-crosslinked complexes without amine groups on the coronas formed discrete particles. Figure 2b shows the nanoscale MBIClusters after the crosslinking reaction. In addition to the clusters, some of the precursor small aggregates still remain.
Fig. 2.
TEM images (top) of a) MBICs, Di of 50 nm, and b) MBIClusters, Di of 105 nm, and (bottom) DLS curves of intensity-average sizes of MBIClusters
Colloidal stability under physiological conditions is one of the most important issues when considering biological applications of nanomaterials.32 The MBIClusters had excellent colloidal stability in both DI water and phosphate buffered saline (PBS) for up to 7 days (Figure 3). This suggests that they will be sufficiently stable under physiological conditions to be suitable drug carriers.
Fig. 3.
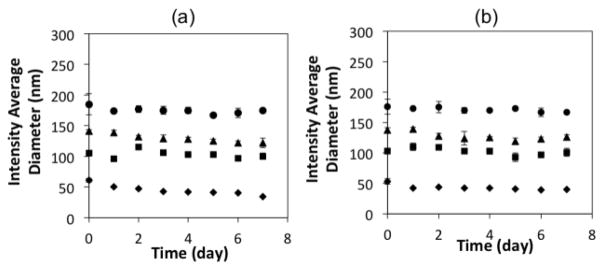
Stability in a) DI water (pH 7.0), and b) PBS (0.14 M NaCl, pH 7.4) of MBICs, Di = 50 nm (Diamonds), MBIClusters, Di = 105 nm (squares), Di = 139 nm (triangles), Di =174 nm (circles)
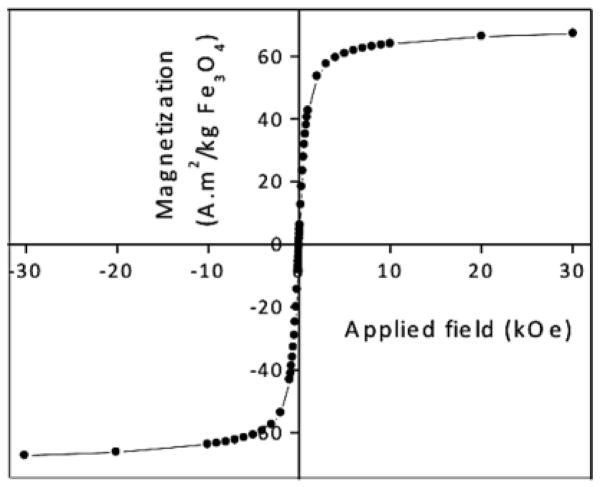
The magnetic properties of the bare magnetite nanoparticles were characterized via SQuID analysis. Hysteresis loops revealed that the nanoparticles were superparamagnetic at 300 K with a saturation magnetization of 67 Am2 kg−1 of magnetite (Figure 4).
Fig. 4.
Hysteresis loop of bare magnetite nanoparticles at 300 K
This value corresponds to ~92 Am2 kg−1 of Fe and is consistent with the mass magnetization values reported for similar sized Fe3O4 nanoparticles.33
Relaxivities of MBIClusters
To validate the potential for these MBIClusters as T2 contrast agents, the proton transverse relaxivities (r2’s) were measured at the clinically-relevant field strength of 1.4 T and physiological temperature. While the non-crosslinked precursor MBICs had r2’s of 68–93 s−1 mM Fe−1, r2’s of the clusters were significantly higher and increased with size (Table 2). For example, MBIClusters with the 3.5K-9.5K H2N-PEO-b-PAA had r2’s increasing from 255 to 444 and 534 s−1 mM Fe−1 as the cluster size was increased from 105 to 139 and 174 nm, respectively (see the supplemental information). Thus, control over the cluster sizes from ~50–180 nm in intensity average diameter afforded control over r2’s covering almost an order of magnitude.
Table 2.
NMR relaxivities of MBICs and MBIClusters at 1.4T, 37 °C
| Sample | Intensity average diameter (nm) | r1 (s−1 mM Fe−1) | r2 (s−1 mM Fe−1) |
|---|---|---|---|
| MBICs | 55±2 | 18 | 68 |
| 50±2 | 14 | 93 | |
| MBIClusters | 119±6 | 30 | 194 |
| 105±2 | 40 | 255 | |
| 143±5 | 34 | 410 | |
| 139±4 | 69 | 444 | |
| 181±2 | 43 | 604 | |
| 174±2 | 75 | 534 |
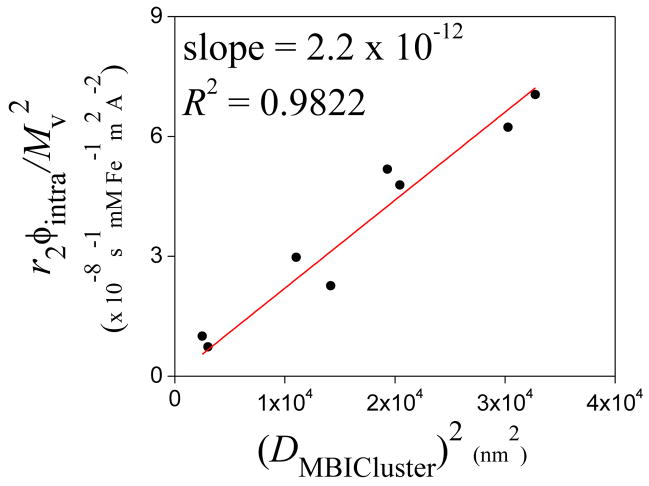
The very high r2 values are likely due to the ability of water to diffuse through the intra-cluster hydrophilic spaces between magnetite nanoparticles.25,34 Vuong et al. have recently developed an empirical equation based on the classical motional-averaging model to predict the transverse relaxivities of hybrid magnetic nanoparticles such as controlled clusters.35 It was shown that the normalized r2’s of magnetic particles over a range of sizes, morphologies and magnetizations followed a universal scaling law varying with the square of the particle hydrodynamic diameter. We used the volume fractions of magnetite in all of the dried MBICs and MBIClusters (from TGA) in the hydrodynamic size range of 50–180 nm (Table 2) and the volumetric magnetizations (Mv at 1.4 T) to normalize the observed r2’s according to [r2’ = (r2×ϕintra)/Mv2] and plotted them versus (DMBICluster)2 (Figure 5). The magnetite volume fraction within the cluster, ϕintra, is based on the TGA analyses but does not account for water included in the clusters. At present, we have no ready method for measuring the magnetite volume fraction in the hydrated clusters. The plot of r2’ versus the square of the hydrodynamic diameters was a straight line with a slope of 2.2 × 10⁻¹², a factor of 5 smaller than the prefactor in Vuong et al. (from figure 1 in that reference). The difference in the prefactor could be attributed, in part, to effects of hydration in the clusters. Specifically, if ϕintra increased with the cluster diameter DMBICluster, this could account for the smaller value of the slope that we find (relative to Vuong et al.) since (r2×ϕintra)/Mv2 = r2/(ϕintra×M2) where M is the magnetization of magnetite at 1.4 T. Other variables may also affect r2 such as the diffusion coefficient of water in the cluster and the spacing between magnetite particles in the cluster. These effects can be captured in part by recent Monte Carlo computer simulations for r2 in hydrophilic clusters.25,29,34,36
Fig. 5.
Relationship between transverse relaxivities normalized by the volume fractions of magnetite in the dried MBICs and MBIClusters and the hydrodynamic diameters
Interestingly, even for the single MBICs, if one considers that only the surface iron on the magnetite nanoparticles is accessible to water, it appears that r1’s of iron oxide nanoparticles can be substantially higher than for gadolinium chelates. At 0.47 T and room temperature, r1 relaxivities of the MBICs and Feridex (a commercial dextran-magnetite control) were ~40 and 22 s−1 mM Fe−1, values that are in line with those reported in the literature for iron oxide nanoparticles.37–39 By controlled clustering of MBICs to form MBIClusters, further increases in r1’s were observed. At 1.4 T and 37 °C, the relaxivity of MBIClusters with an intensity average diameter of 139 nm was 69 s−1 mM Fe−1. Although the numbers are remarkably high, such r1 values are not unheard of. For example, specialty materials such as gadonanotubes in which clusters of gadolinium ions were trapped within defects of short single-walled carbon nanotubes, and also trimetallic gadolinium nitrides encapsulated within fullerenes have been reported to have very high r1’s.40–41 Possible explanations for the marked fast r1’s of the MBIClusters is likely partly attributable to the hydrophilic spacing between each MBIC within the clusters that results in a larger volume fraction of Fe atoms accessible to water molecules relative to aggregated nanoparticle clusters. However, it is not yet fully understood why these r1 values are so high.
The r1’s of both the MBIClusters and precursor MBICs were field-dependent, decreasing as expected with increasing field strength (Figure 6).37,42 The sharp decrease of r1 with increasing field suggests that rotational correlation times of these particles also play a role in enhancing the relaxivities. In contrast, r2 values for these agents remained essentially constant with field strength and this is likely at least partially attributable to the magnetic moments of the particles being almost saturated even at the lowest field investigated (0.47 T).
Fig. 6.
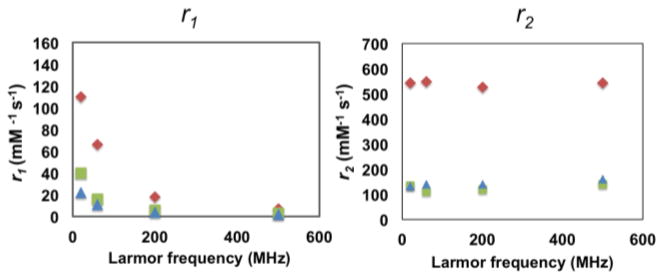
Relaxivities, r1’s and r2’s, of MBIClusters, Di = 174 nm (diamonds), MBICs (squares), and Feridex (triangles) as a function of field strength at room temperature
Phantom and in vivo MRI
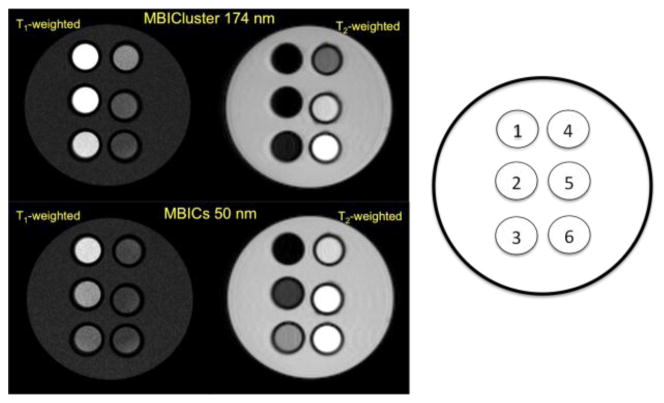
The feasibility of the MBIClusters to be potent negative MRI contrast agents was demonstrated in phantom images measured at 4.7 T. Figure 7 shows that the hypointense contrast signals obtained from aqueous dispersions of the MBIClusters were more pronounced relative to dispersions of the non-crosslinked precursors. With the clusters, significant contrast was already observed at an Fe concentration of 12.5 μM, and complete signal losses were observed at Fe concentrations >50 μM. In contrast, a similar dark hypointense image was only detected in the MBICs dispersion at an Fe concentration of 200 μM, consistent with the lower r2’s. Positive contrast signals generated by the MBIClusters and MBICs were also observed in T1-weighted MRI. As observed for the T2-weighted images, the clusters led to more T1-relaxation enhancement compared to the smaller MBICs. There is an increasing interest in developing MRI contrast agents that exert both positive and negative signals so that the two images can be compared. The MBIClusters, with prominent MRI relaxivities, may be useful as dual T1/T2 contrast agents at clinical field strengths where r1’s of the clusters are still high.
Fig. 7.
MR phantom images at 4.7 T of the MBICs and MBIClusters with intensity-average diameters of 50 and 174 nm respectively. Concentrations of Fe in each tube were 1) 200, 2) 100, 3) 50, 4) 25, 5) 12.5 and 6) 0 μM.
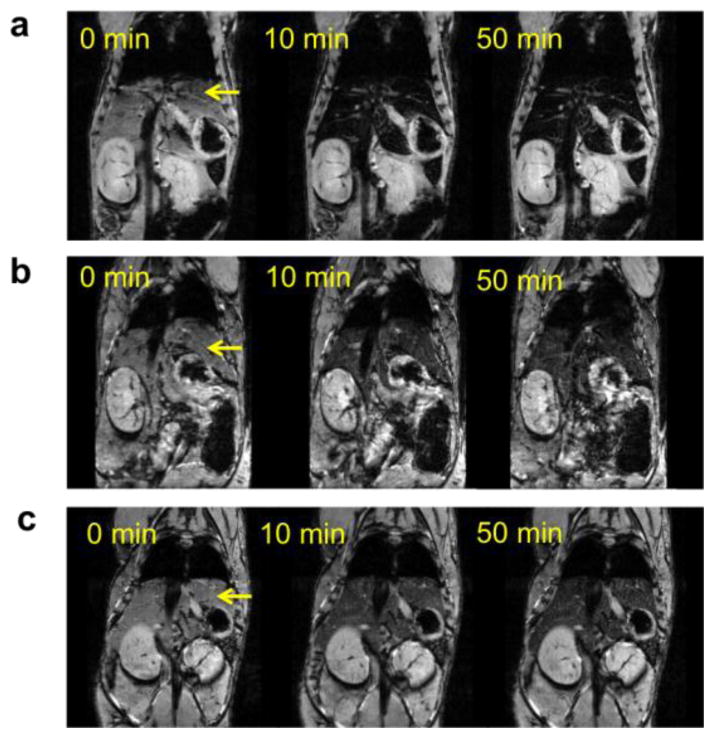
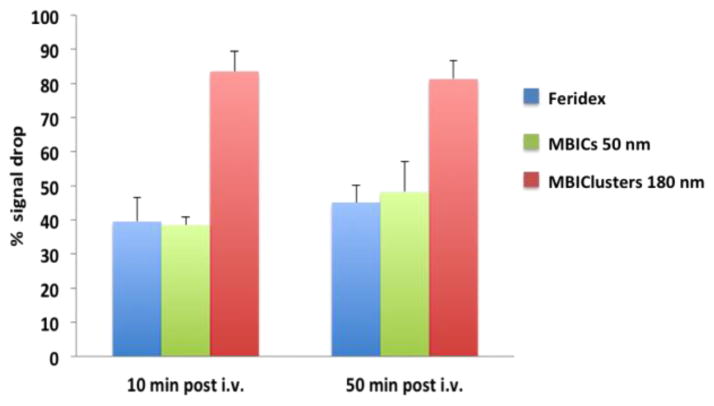
In an in vivo demonstration of T2 contrast with the clusters, mice were intravenously injected with MBIClusters, MBICs or Feridex at Fe doses of 0.28 mg per kg. Serial 2D FLASH T2*-weighted MRI was performed pre-injection and 10 and 50 minutes after injection. It is clear that administration of the MBIClusters at 0.28 mg/kg generated an enhanced hypointense signal in the livers compared to either the MBICs or Feridex (Figure 8). To quantify the comparison, liver signal intensities were normalized against muscle signals and the amounts of signal drop were calculated by dividing the normalized signal intensities by the pre-injection intensity. Figure 9 shows that injection of a low dose of MBIClusters resulted in 81–84% signal drop while injection of the same dose of MBICs and Feridex caused 38–48% and 39–45% signal drop, respectively. The decrease in signal intensity occurred within the first few minutes after injection, thus suggesting rapid uptake of particles by the livers, probably due to endocytosis by Kupffer cells. It was reasoned that the prominent signal drops caused by the MBIClusters are at least partially attributable to the high r2 values. However, it is also possible that the size distributions of these clusters lead to more efficient liver uptake, thus resulting in higher iron accumulation relative to the smaller MBICs or Feridex. Further investigation into the dose-dependent contrast signals, and quantification of the tissue iron content of these clusters will enable a better understanding of the in vivo relaxivities. However, it is clear that the MBIClusters are potent MRI contrast agents in vivo as well as in vitro.
Fig. 8.
In vivo MR images of mice before and after i.v. injection of a) MBIClusters, b) Feridex and c) MBICs at an Fe dose of 0.28 mg/kg (arrow indicates liver)
Fig. 9.
Comparison of % signal drop in mouse livers after i.v. administration of contrast agents.
MBIClusters as potential nanocarriers for delivering cationic drugs
Gentamicin, an aminoglycoside antibiotic, was selected as a model drug for these studies due to its highly polar and positively-charged structure to demonstrate that the MBIClusters may be suitable as imageable depot systems for therapeutic agents. Simple mixing of the drug solution with the clusters in phosphate buffer was sufficient to incorporate the drug molecules into the anionic cores (Figure 1). The amount of charged gentamicin was based on a 1:1 equivalence ratio of cations to anions assuming that all of the anions were free to complex with the drug (and that none were deactivated through adsorption on the magnetite). The fluorescence assay showed that 95% of the charged gentamicin had been encapsulated in the clusters, corresponding to a high drug content of 38 wt%. This remarkable loading of gentamicin is attributed to cooperative interactions between the multi-cationic drug (5 ammonium ions in its molecular structure) and the anionic polymeric cores.
Upon gentamicin encapsulation, the physicochemical properties of the MBIClusters changed. The intensity average diameters decreased from 174 to 150 nm as the polyelectrolyte polymers formed complexes with the drug. Moreover, the zeta potentials of the gentamicin-loaded clusters dramatically decreased from −56 to −2 mV, indicating that the multi-cationic drug had effectively localized the charges in the cluster cores. The r2’s and r1’s of the clusters remained high but almost constant with versus without the hydrophilic drug (Figure 10), even though the cluster size decreased upon drug incorporation. The fact that high concentrations of drug molecules did not detract from the MRI relaxivities reinforces the promise of using hydrophilic MBIClusters for dual delivery and imaging. These novel nanocarriers can also potentially offer an efficient vehicle for loading other cationic drugs into the formulation.
Fig. 10.
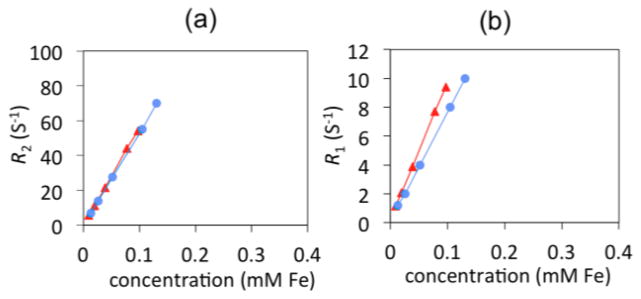
a) Transverse relaxivities (r2) of MBIClusters (534 s−1mMFe−1, circles) versus gentamicin loaded MBIClusters (555 s−1mMFe−1, triangles) b) longitudinal relaxivities (r1) of MBIClusters (75 s−1mMFe−1, circles) versus gentamicin loaded-MBIClusters (95 s−1mMFe−1, triangles).
Conclusions
A series of MBIClusters with hydrophilic polymer spacing between magnetite nanoparticles within the clusters have been prepared, and they have extremely high MRI sensitivity. The average cluster sizes were controlled by adjustments in the reactant concentrations in the crosslinking (clustering) step, and their sizes directly relate to high relaxivities. We posit that the hydrophilic space within these clusters plays a strong role in enhancing field gradients to diffusing water molecules, thus leading to the large increases in relaxivities. Owing to their charged, nanogel-like network, we demonstrated that these clusters could be effective nanocarriers for oppositely charged cargo. The prominences in MRI relaxivities and high drug encapsulation efficiency warrant further exploration in using these MBIClusters as potential dual ultrasensitive contrast agents for molecular imaging combined with therapeutic capacities.
Supplementary Material
Acknowledgments
The authors are grateful for the financial support from NSF under Contract DMR-0805179 and from the Institute for Critical Technologies and Applied Sciences at Virginia Tech. This work was also partially supported by the Intramural Research Program (IRP) at NINDS/NIH.
Footnotes
Electronic Supplementary Information (ESI) available: Details regarding characterization of the block copolymers and relaxivities of the MBICs and MBIClusters are available in the supplementary information. See DOI: 10.1039/b000000x/
References
- 1.Bengele HH, Palmacci S, Rogers J, Jung CW, Crenshaw J, Josephson L. Magn Reson Imaging. 1994;12(3):433. doi: 10.1016/0730-725x(94)92537-2. [DOI] [PubMed] [Google Scholar]
- 2.Stark DD, Weissleder R, Elizondo G, Hahn PF, Saini S, Todd LE, Wittenberg J, Ferucci JT. Radiology. 1988;168(2):297. doi: 10.1148/radiology.168.2.3393649. [DOI] [PubMed] [Google Scholar]
- 3.Weissleder R, Hahn PF, Stark DD, Elizondo G, Saini S, Todd LE, Wittenberg J, Ferucci JT. Radiology. 1988;169(2):399. doi: 10.1148/radiology.169.2.3174987. [DOI] [PubMed] [Google Scholar]
- 4.Das M, Mishra D, Maiti TK, Basak A, Pramanik P. Nanotechnology. 2008;19:415101. doi: 10.1088/0957-4484/19/41/415101. [DOI] [PubMed] [Google Scholar]
- 5.Kamat M, El-Boubbou K, Zhu DC, Lansdell T, Lu X, Li W, Huang X. Bioconjugate Chem. 2010;21:2128. doi: 10.1021/bc100354m. [DOI] [PubMed] [Google Scholar]
- 6.Mohapatra S, Mallick SK, Maiti TK, Ghosh SK, Pramanik P. Nanotechnology. 2007;18:385102. [Google Scholar]
- 7.Shilnyy A, Munnier E, Herve K, Souce M, Benoit R, Cohen-Jonathan S, Limelette P, Saboungi M-L, Dubois P, Chourpa I. J Phys Chem C. 2010;114:5850. [Google Scholar]
- 8.Singh A, Dilnawaz F, Mewar S, Sharma U, Jagannathan NR, Sahoo SK. Appl Mater Interfaces. 2011;3:842. doi: 10.1021/am101196v. [DOI] [PubMed] [Google Scholar]
- 9.Arai T, Kofidis T, Bulte JWM, de Bruin J, Venook RD, Berry GJ, McConnell MV, Quertermous T, Robbins RC, Yang PC. Magn Reson Med. 2006;55:203. doi: 10.1002/mrm.20702. [DOI] [PubMed] [Google Scholar]
- 10.Cohen ME, Muja N, Fainstein N, Bulte JWM, Ben-Hur T. J Neurosci Res. 2010;88:936. doi: 10.1002/jnr.22277. [DOI] [PMC free article] [PubMed] [Google Scholar]
- 11.de Vries IJM, Lesterhuis WJ, Barentsz JO, Verdijk P, van Krieken JH, Boerman OC, Oyen WJG, Bonenkamp JJ, Boezeman JB, Adema GJ, Bulte JWM, Scheenen TWJ, Punt CJA, Heerschap A, Figdor CG. Nat Biotechnol. 2005;23(11):1407. doi: 10.1038/nbt1154. [DOI] [PubMed] [Google Scholar]
- 12.Sadek H, Latif S, Collins R, Garry MG, Garry DJ. Regen Med. 2008;3(6):807. doi: 10.2217/17460751.3.6.807. [DOI] [PubMed] [Google Scholar]
- 13.Shapiro EM, Sharer K, Skrtic S, Koretsky AP. Magn Reson Med. 2006;55:242. doi: 10.1002/mrm.20718. [DOI] [PubMed] [Google Scholar]
- 14.Shapiro EM, Skrtic S, Koretsky AP. Magn Reson Med. 2005;53:329. doi: 10.1002/mrm.20342. [DOI] [PubMed] [Google Scholar]
- 15.Bulte JWM, Kraitchman DL. Curr Pharm Biotechno. 2004;5:567. doi: 10.2174/1389201043376526. [DOI] [PubMed] [Google Scholar]
- 16.Foster-Gareau P, Heyn C, Alejski A, Rutt BK. Magn Reson Med. 2003;49:968. doi: 10.1002/mrm.10417. [DOI] [PubMed] [Google Scholar]
- 17.Hinds KA, Hill JM, Shapiro EM, Laukkanen MO, Silva AC, Combs CA, Varney TR, Balaban RS, Koretsky AP, Dunbar CE. Blood. 2003;102:867. doi: 10.1182/blood-2002-12-3669. [DOI] [PubMed] [Google Scholar]
- 18.Shapiro EM, Skrtic S, Sharer K, Hill JM, Dunbar CE, Koretsky AP. P Natl Acad Sci USA. 2004;101(30):10901. doi: 10.1073/pnas.0403918101. [DOI] [PMC free article] [PubMed] [Google Scholar]
- 19.Stroh A, Faber C, Neuberger T, Lorenz P, Sieland K, Jakob PM, Webb A, Pilgrimm H, Schober R, Pohl EE, Zimmer C. NeuroImage. 2005;24:635. doi: 10.1016/j.neuroimage.2004.09.014. [DOI] [PubMed] [Google Scholar]
- 20.Wang L, Neoh K-G, Kang E-T, Shuter B, Wang S-C. Biomaterials. 2010;31:3502. doi: 10.1016/j.biomaterials.2010.01.081. [DOI] [PubMed] [Google Scholar]
- 21.Zhang Y, Dodd SJ, Hendrich KS, Williams M, Ho C. Kidney Int. 2000;58:1300. doi: 10.1046/j.1523-1755.2000.00286.x. [DOI] [PubMed] [Google Scholar]
- 22.Talelli M, Rijcken CJF, Lammers T, Seevinck PR, Storm G, van Nostrum CF, Hennick WE. Langmuir. 2009;25:2060. doi: 10.1021/la8036499. [DOI] [PubMed] [Google Scholar]
- 23.Ai H, Flask C, Weinberg B, Shuai X, Pagel MD, Farrell D, Duerk J, Gao J. Adv Mater. 2005;17:1949. [Google Scholar]
- 24.Balasubramaniam S, Pothayee N, Lin Y, Davis RM, Riffle JS, House M, Woodward RC, StPierre TG. Chem Mater. 2011;23(14):3348. [Google Scholar]
- 25.Bennett KM, Shapiro EM, Sotak CH, Koretsky AP. Biophys J. 2008;95:342. doi: 10.1529/biophysj.107.116145. [DOI] [PMC free article] [PubMed] [Google Scholar]
- 26.Carroll MRJ, Huffstetler P, Miles W, Goff JD, Davis RM, Riffle JS, House M, Woodward RC, St Pierre TG. Nanotechnology. 2011;22:325702. doi: 10.1088/0957-4484/22/32/325702. [DOI] [PubMed] [Google Scholar]
- 27.Carroll MRJ, Woodward RC, House MJ, Teoh WY, Amal R, Hanley TL, StPierre TG. Nanotechnology. 2010;21(3):1–035107. doi: 10.1088/0957-4484/21/3/035103. [DOI] [PubMed] [Google Scholar]
- 28.Stephen ZR, Kievit FM, Zhang M. Mater Today. 2011;14(7–8):330. doi: 10.1016/S1369-7021(11)70163-8. [DOI] [PMC free article] [PubMed] [Google Scholar]
- 29.Matsumoto Y, Jasanoff A. Magn Reson Imaging. 2008;26:994. doi: 10.1016/j.mri.2008.01.039. [DOI] [PubMed] [Google Scholar]
- 30.Kessinger CW, Togao O, Khemtong C, Huang G, Takahashi M, Gao J. Theranostics. 2011;1:263. doi: 10.7150/thno/v01p0263. [DOI] [PMC free article] [PubMed] [Google Scholar]
- 31.Pothayee Nikorn, Pothayee Nipon, Jain N, Hu N, Balasubramaniam S, Johnson LM, Davis RM, Sriranganathan N, Riffle JS. Chem Mater. 2012;24(11):2056. [Google Scholar]
- 32.Goff JD, Huffstetler PP, Miles WC, Pothayee N, Reinholz CM, Ball S, Davis RM, Riffle JS. Chem Mater. 2009;21:4784. [Google Scholar]
- 33.Jun YW, Huh YM, Choi JS, Lee JH, Song HT, Kim S, Yoon S, Kim KS, Shin JS, Suh JS, Cheon J. J Am Chem Soc. 2005;127(16):5732. doi: 10.1021/ja0422155. [DOI] [PubMed] [Google Scholar]
- 34.Paquet C, de Haan HW, Leek DM, Lin HY, Xiang B, Tian G, Kell A, Simard B. ACS Nano. 2011;5(4):3104. doi: 10.1021/nn2002272. [DOI] [PubMed] [Google Scholar]
- 35.Vuong QL, Berret JF, Fresnais J, Gossuin Y, Sandre O. Adv Healthcare Mater. 2012;1(4):502. doi: 10.1002/adhm.201200078. [DOI] [PubMed] [Google Scholar]
- 36.Vuong QL, Gillis P, Gossuin Y. J Magn Reson. 2011;212:139. doi: 10.1016/j.jmr.2011.06.024. [DOI] [PubMed] [Google Scholar]
- 37.Bjornerud A, Johansson L. NMR Biomed. 2004;17:465. doi: 10.1002/nbm.904. [DOI] [PubMed] [Google Scholar]
- 38.Wang YXJ, Hussain SM, Krestin GP. Eur Radiol. 2001;11:2319. doi: 10.1007/s003300100908. [DOI] [PubMed] [Google Scholar]
- 39.Weissleder R, Bogdanov A, Neuwelt EA, Papisov M. Adv Drug Deliv Rev. 1995;16:321. [Google Scholar]
- 40.Sitharaman B, Kissell KR, Hartman KB, Tran LA, Baikalov A, Russakova I, Sun Y, Khant HA, Ludtke SJ, Chiu W, Laus S, Toth E, Helm L, Merbach AE, Wilson LJ. Chem Commun. 2005;31:3915. doi: 10.1039/b504435a. [DOI] [PubMed] [Google Scholar]
- 41.Zhang J, Fatouros PP, Shu C, Reid J, Owens LS, Cai T, Gibson HW, Long GL, Corwin FD, Chen ZJ, Dorn HC. Bioconj Chem. 2010;21(4):610. doi: 10.1021/bc900375n. [DOI] [PMC free article] [PubMed] [Google Scholar]
- 42.Kellar KE, Fujii DK, Gunther WH, Briley-Saebo K, Bjornerud A, Spiller M, Koening SH. J Magn Reson Imaging. 2000;11(5):488. doi: 10.1002/(sici)1522-2586(200005)11:5<488::aid-jmri4>3.0.co;2-v. [DOI] [PubMed] [Google Scholar]
Associated Data
This section collects any data citations, data availability statements, or supplementary materials included in this article.


