Abstract
BACKGROUND
The purpose of this study was to compare the 2006 and 2010 Crouter algorithms, for the ActiGraph accelerometer, and the NHANES and Matthews cut-points, to indirect calorimetry during a 6-hr free-living measurement period.
METHODS
Twenty-nine participants (mean±SD; age, 38±11.7 yrs; BMI, 25.0±4.6 kg.m−2) were monitored for 6-hrs while at work or during their leisure time. Physical activity (PA) data was collected using an ActiGraph GT1M and energy expenditure (METs) was measured using a Cosmed K4b2. ActiGraph prediction equations were compared to the Cosmed for METs and time spent in sedentary behaviors, light PA (LPA), moderate PA (MPA) and vigorous PA (VPA).
RESULTS
The 2010 Crouter algorithm overestimated time spent in LPA, MPA, and VPA by 9.0%-44.5% and underestimated sedentary time by 20.8%. The NHANES cut-points overestimated sedentary time and LPA by 8.3%-9.9% and underestimated MPA and VPA by 50.4%-56.7%. The Matthews cut-points overestimated sedentary time (9.9%) and MPA (33.4%) and underestimated LPA (25.7%) and VPA (50.1%). The 2006 Crouter algorithm was within 1.8% of measured sedentary time, however, mean errors ranged from 34.4%-163.1% for LPA, MPA, and VPA.
CONCLUSION
Of the ActiGraph prediction methods examined, none of them was clearly superior for estimating free-living PA compared to indirect calorimetry.
Keywords: Motion Sensor, Accelerometry, Oxygen Consumption, Activity Counts Variability, Objective Monitors
INTRODUCTION
The use of accelerometers for the measurement of physical activity (PA) has potential advantages over self-report measures such as the ability to track intensity, duration, and frequency of free-living PA, without relying on participants to recall their activities. In addition, accelerometers allow researchers to obtain objective estimates of energy expenditure (EE) and time spent in light PA [LPA; <3 metabolic equivalents (METs)], moderate PA (MPA; 3-5.99 METs), and vigorous PA (VPA; >6 METs) with minimal subject burden.
Currently the ActiGraph accelerometer (formerly Manufacturing Technology Incorporated ActiGraph and Computer Science Applications Inc) is the most widely used for PA research, and there are numerous equations and cut-points that can be used to convert the accelerometer count values to EE or estimates of time spent in LPA, MPA, and VPA. In 2008, Troiano and colleagues developed an inactivity threshold (100 counts per minute)1 and cut-points for MPA (2020 counts per minute)2 and VPA (5999 counts per minute).2 Subsequently, these cut-points were used to establish the prevalence of U.S. adults meeting the national PA recommendation2 as well as use in numerous other studies examining PA outcomes from ActiGraph data collected using 1-min epochs.3-9 A limitation of the MPA and VPA cut-points, developed by Troiano and colleagues, was that they were based on a weighted average of four different calibration studies which only used walking and running, and studies that included lifestyle PA were omited.1, 2 Acknowledging this limitation, Matthews developed MPA (760 counts.min−1) and VPA (5725 counts.min−1) cut-points utilizing calibrations studies utilizing both walking and running as well as lifestyle PA.10, 11 Although the Matthews and NHANES cut-points are widely used, there have been no studies examining the validity of these cut-points, using indirect calorimetry.
Over the past several years, there have been new statistical models to predict EE with the ActiGraph such as a 2-regression model (2-RM)12, 13 or artificial neural networks.14 These methods are reportedly more accurate than the single regression equations traditionally used, at least for structured activity bouts lasting 7-10 minutes.13, 14 In 2006 Crouter and colleagues developed a 2-RM, which examines the variability in accelerometer counts to determine if the activity being performed is part of a walking/running bout or intermittent lifestyle bout and uses a separate regression line for each form of activity.13 However, Kuffel et al.15 showed that the 2006 Crouter algorithm misclassifies walking/running bouts as intermittent lifestyle activity, when they start in the middle of a minute on the ActiGraph clock. This, in turn, results in a significant overestimation of EE. Thus, in 2010 Crouter and colleagues revised the 2006 Crouter algorithm so that each 10-s epoch is examined to determine whether it falls within a continuous walking/running bout lasting one minute or longer.12
Most accelerometer prediction equations are calibrated and validated on structured activities, and it is not fully understood how this translates into estimates of EE or time spent in physical activity intensity categories during free-living activity. Thus, the purpose of this study was to compare the 2006 Crouter algorithm13 and the refined (2010) Crouter algorithm12 to indirect calorimetry in a free-living environment, over a 6-hour measurement period. A secondary purpose was to compare the accuracy of the NHANES cut-points2 against the 2006 and 2010 Crouter algorithms for estimating sedentary behaviors, LPA, MPA, and VPA, using the same dataset.
METHODS
Participants
To examine the validity of the ActiGraph prediction equations, 12 males and 17 females from Cornell University and the surrounding community volunteered to participate in a 6-hour free-living study. The procedures were reviewed and approved by the Institutional Review Boards at Cornell University and The University of Tennessee, Knoxville before the start of the study. Prior to beginning the study, each participant signed a written informed consent and completed a Physical Activity Readiness Questionnaire. Participants were excluded from the study if they had any contraindications to exercise. The physical characteristics of the participants are shown in table 1.
Table 1.
Physical characteristics of the participants in the 6-hr free-living study (mean ± SD (range)).
| Variable | Male (N=12) | Female (N=17) | All Participants (N=29) |
|---|---|---|---|
| 26 ± 4.9 (23 – 54) | 25 ± 4.6 (20 – 55) | 25 ± 4.6 (20 – 55) | |
| Height (cm) | 180.4 ± 9.1 (159.8 – 193.5) | 162.4 ± 6.7 (153.1 – 172.9) | 169.8 ± 11.9 (153.1 – 193.5) |
| Body Mass (kg) | 83.0 ± 16.4 (52.6 – 122.3) | 64.8 ± 9.9 (45.4 – 85.7) | 72.3 ± 15.6 (45.4 – 122.3) |
| BMI (kg·m−2) | 25.5 ± 4.9 (20.6 – 37.4) | 24.7 ± 4.6 (19.4 – 36.3) | 25.0 ± 4.6 (19.4 – 37.4) |
BMI=Body Mass Index
Procedures
Prior to testing, participants had their height and weight measured (in light clothing, without shoes) using a stadiometer and a physician's scale, respectively. The participant was then fitted with a portable metabolic measurement system (Cosmed K4b2, Cosmed, S.r.l., Italy) and an ActiGraph GT1M accelerometer. Breath-by-breath oxygen uptake (VO2) and accelerometer data were collected simultaneously for a 5-6 hour period except for an intermittent (10-15 minutes) break every two hours to change the battery of the Cosmed system and to allow the participant to drink water if needed. Twenty-three participants were measured while they were at work and nine participants were measured during their leisure time outside of the working day. Three participants completed both conditions.
During all free-living measurements an investigator followed the participants to monitor their activity, but did not influence the activities performed or communicate with the participant, except when changing the battery pack. General types of activities performed during the free-living measurement included; sedentary behaviors (e.g., seated office work, reading, playing computer games, driving a vehicle), manual labor (e.g., dairy plant workers, lifting and carrying boxes), activities of daily living (e.g., household cleaning, yard work, grocery shopping), and recreational activities (e.g., playing golf, step aerobics, walking).
Indirect Calorimetry
. The Cosmed K4b2 is a lightweight device that has been shown to be valid for measuring VO2 and VCO2 compared to the Douglas Bag method during cycle ergometry.16 Prior to each test, the oxygen and carbon dioxide analyzers and the flow turbine were calibrated according to the manufacturer's instructions, which consists of a room air calibration, gas calibration, volume calibration, and a delay calibration. During each test, a gel-seal was used to help prevent air leaks from the facemask. Data from the Cosmed were stored in memory and downloaded to a laptop computer at the completion of each test.
ActiGraph GT1M
The ActiGraph GT1M (ActiGraph, Pensacola, Florida) is a small (3.8 x 3.7 x 1.8 cm) lightweight (27 g) uniaxial accelerometer. The ActiGraph GT1M accurately measures accelerations in the range of 0.05 to 2 g. The acceleration signals are sampled at 30 Hz and digitized with a 12-bit analog/digital converter, and a microcontroller then numerically integrates the signal. The signal is subjected to a band-pass filter that markedly attenuates signals outside of the 0.25-2.5 Hz range. The ActiGraph GT1M was initialized using 1-s epochs and synchronized with a digital clock, so the start time could be synchronized with the Cosmed K4b2. During the testing, it was attached to a nylon belt and positioned on the right hip at the anterior axillary line and at the completion of each test the data were downloaded to a laptop computer.
Data Analysis
Breath-by-breath data were collected by the Cosmed K4b2, which were averaged over a 1-min period. For each minute of measurement, the VO2 (ml.min−1) was converted to METs (1 MET = 3.5 ml.kg−1.min−1). For all analyses with the Cosmed MET data, sedentary behaviors were defined as less than 1.5 METs, LPA 1.5-2.9 METs, MPA 3-5.9 METs, and VPA greater than or equal to 6.0 METs.
The ActiGraph data were converted to 10-sec and 1-min epochs so that METs and time spent in sedentary behaviors, LPA, MPA, and VPA could be estimated using the 2006 Crouter algorithm13 and 2010 Crouter algorithm.12 We also examined time spent in sedentary behaviors, LPA, MPA, and VPA using the cut-points proposed by Matthews10, 11 and those used for the analysis of the accelerometer data collected in NHANES.2 Table 2 shows the ActiGraph prediction models and cut-points of the various equations compared in this study.
Table 2.
ActiGraph prediction models and cut-points.
| Cut-Points (Lower-bound) |
|||||
|---|---|---|---|---|---|
| Reference | Prediction Equation | Sedentary | Light | Moderate | Vigorous |
| 2006 Crouter algorithm (13) | Walk/run equation: 2.379833*[exp(0.00013529*cnts·min−1) | ≤ 50 cnts·min−1 | 51 | 1588 | 6774 |
| Lifestyle equation: 2.330519+(0.001646*cnts·min−1)-[1.2017×10⁻⁷*(cnts·min−1)2]+[3.3779×10⁻¹²*(cnts·min−1)3] | ≤ 50 cnts·min−1 | 51 | 388 | 2826 | |
| 2010 Crouter algorithm (12) | Walk/run equation: 2.294275*[exp(0.00084679*cnts·10 sec−1)] | ≤ 8 cnts·10 sec−1 | 8 | 297 | 1126 |
| Lifestyle equation: 0.749395+[0.716431*(Ln(cnts·10 sec−1)]-[0.179874*(Ln(cnts·10 sec−1))2]+[0.033173*(Ln(cnts·10 sec−1))3] | ≤ 8 cnts·10 sec−1 | 8 | 61 | 445 | |
| NHANES (1, 2) | NA | ≤ 100 cnts·min−1 | 100 | 2020 | 5999 |
| Matthews (1, 10, 11) | NA | ≤ 100 cnts·min−1 | 100 | 760 | 5725 |
NA=not applicable; exp=exponent; cnts=counts; Ln=natural log.
Statistical Analyses
Statistical analyses were carried out using SPSS version 17.0 for windows (SPSS Inc., Chicago, IL). For all analyses, an alpha level of 0.05 was used to indicate statistical significance. All values are reported as mean ± standard deviation (SD).
Pairwise comparisons with Bonferroni adjustments were used to compare actual (Cosmed K4b2) and predicted (2006 Crouter algorithm, 2010 Crouter algorithm, Matthews cut-points and NHANES cut-points) METs and time spent in sedentary behaviors, LPA, MPA, and VPA.
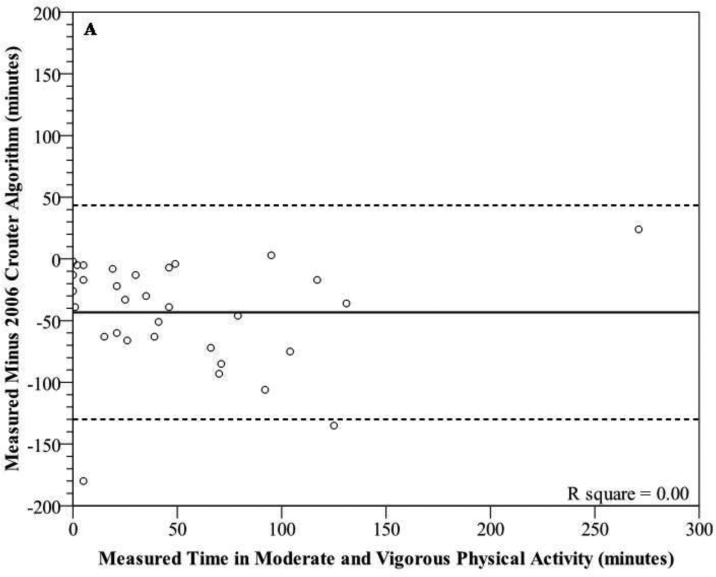
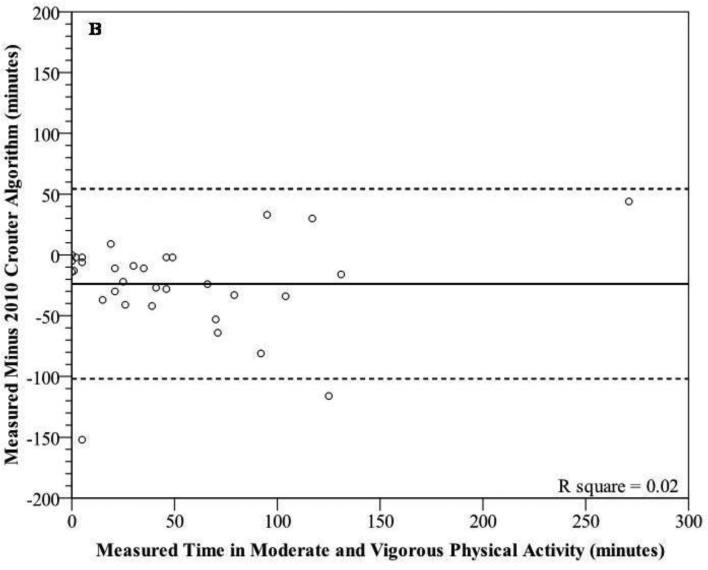
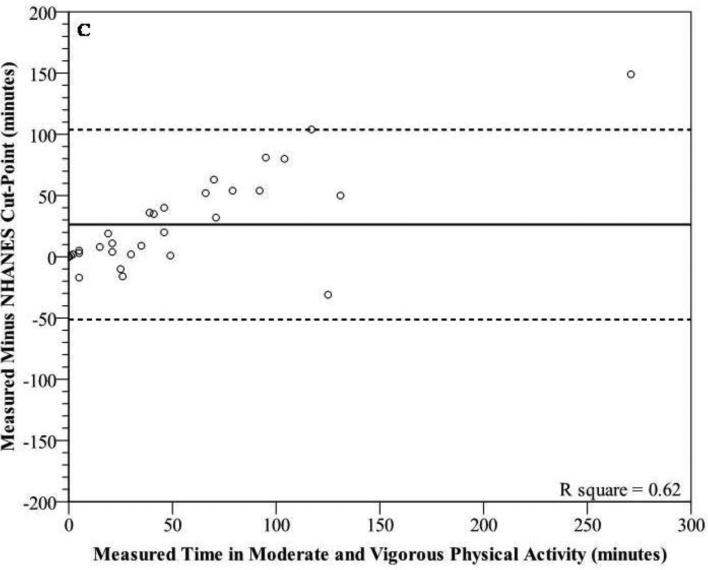
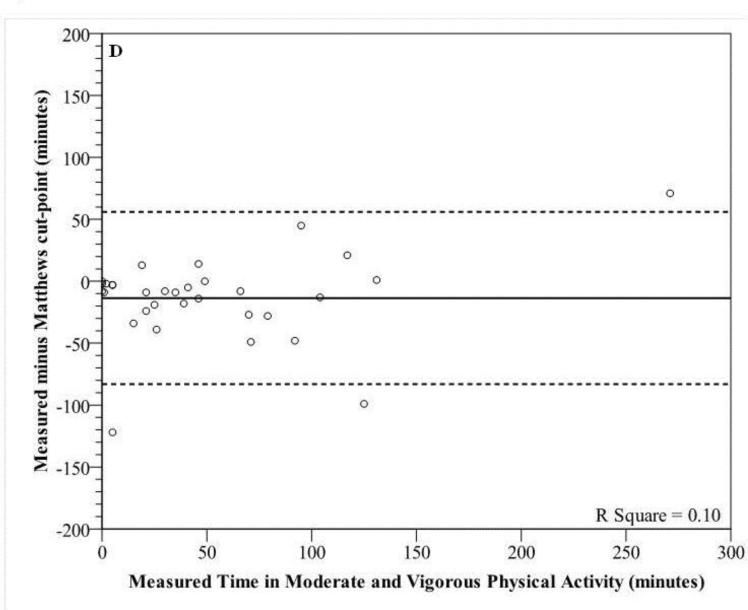
Modified Bland-Altman Plots were used to graphically show the variability in individual error scores (Cosmed minus predicted) for sedentary behaviors and moderate and vigorous PA (MVPA) during the 6 hour measurement period.17 Since many researchers are interested in MVPA time, we chose to use this for the Bland-Altman plot rather than just MPA alone. In addition, since the inactivity threshold (<100 counts.min−1) is the same for the NHANES and Matthews cut-points we only showed the NHANES data for sedentary time. This allowed for the mean error score and 95% prediction interval (95% PI) to be shown. Prediction equations that display a tight prediction interval around zero are deemed more accurate. Data points below zero signify an overestimation, while points above zero signify an underestimation.
RESULTS
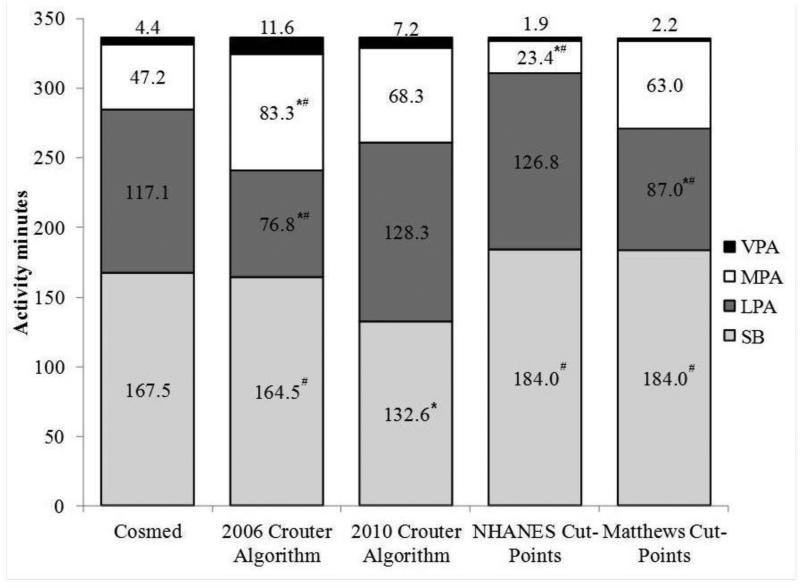
On average, participants were monitored for 300.7±0.8 minutes. Mean measured and predicted time spent in sedentary behaviors, LPA, MPA, and VPA during the 6-hr measurement are shown in figure 1.
Figure 1.
Distribution of average time spent in sedentary behaviors (SB), light physical activity (LPA), moderate physical activity (MPA) and vigorous physical activity (VPA) during the 6-hr measurement period for the Cosmed K4b2 and each prediction equation. *significantly different from Cosmed METs; #significantly different from 2010 Crouter algorithm (P<0.05).
Mean EE (METs)
The mean measured METs by the Cosmed during the 6-hr measurement was 1.90±0.68 METs. The 2010 Crouter algorithm predicted a mean MET value of 2.08±0.77 METs, which was not significantly different from the measured METs (P<0.05). The 2006 Crouter algorithm predicted a mean MET value of 2.32±0.84 METs, which was significantly higher than measured METs and the 2010 Crouter algorithm (P<0.05).
2010 Crouter algorithm
The 2010 Crouter algorithm significantly underestimated the measured time in sedentary behaviors by 34.9 min (20.8%; P<0.05). The 2010 Crouter algorithm overestimated measured time spent in LPA, MPA, and VPA by 9.5%, 44.5%, and 62.4%, respectively (P>0.05).
2006 Crouter algorithm
There was no difference between the 2006 Crouter algorithm and measured time in sedentary behaviors (1.8% lower) or VPA (163.1% higher) (P>0.05). The 2006 Crouter algorithm significantly underestimated time spent in LPA by 40.3 min (34.4%) and significantly overestimated measured time in MPA by 36.1 min (76.5%; P<0.05). In addition, there were significant differences between the 2006 and 2010 Crouter algorithms for time spent in sedentary behaviors, LPA, and MPA (P<0.05).
NHANES cut-points
The NHANES cut-points overestimated measured time in sedentary behaviors and LPA by 9.9% and 8.3%, respectively and underestimated measured time spent in VPA by 56.7% (P>0.05). For MPA, the NHANES cut-point significantly underestimated measured time in MPA by 23.8 min (50.4%; P<0.05). In addition, there were significant differences between the NHANES cut-points and 2010 Crouter algorithm for time spent in sedentary behaviors and MPA (P<0.05).
Matthews cut-points
The Matthews cut-points overestimated measured time in sedentary behaviors and MPA by 9.9% and 33.4%, respectively and underestimated measured time spent in VPA by 56.7%, respectively (P>0.05). For LPA, the Matthews cut-point significantly underestimated measured time in LPA by 30.2 min (25.7%; P<0.05). In addition, there were significant differences between the Matthews cut-points and 2010 Crouter algorithm for time spent in sedentary behaviors and LPA (P<0.05).
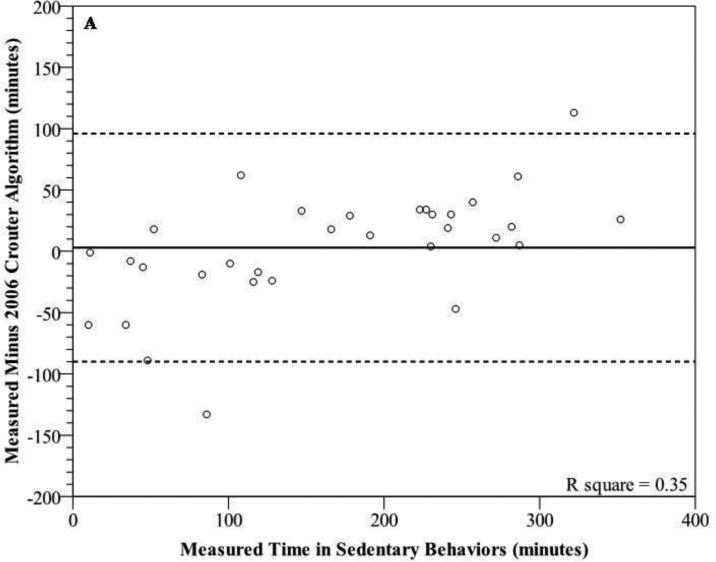
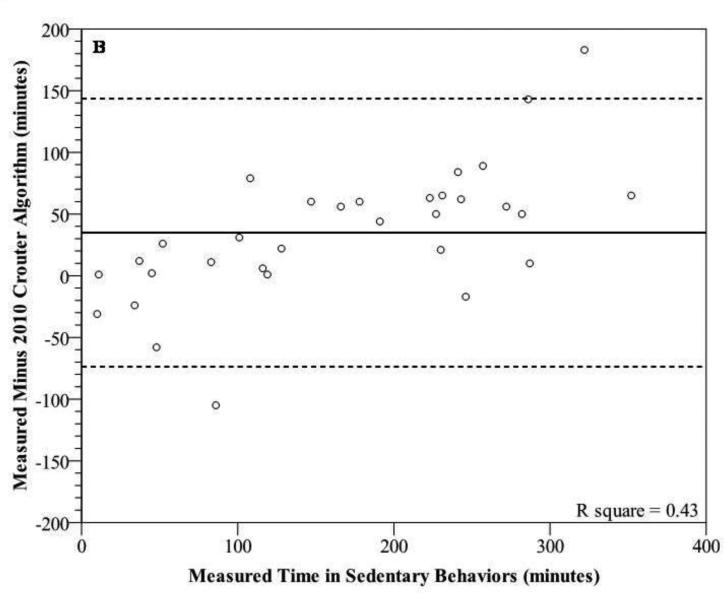
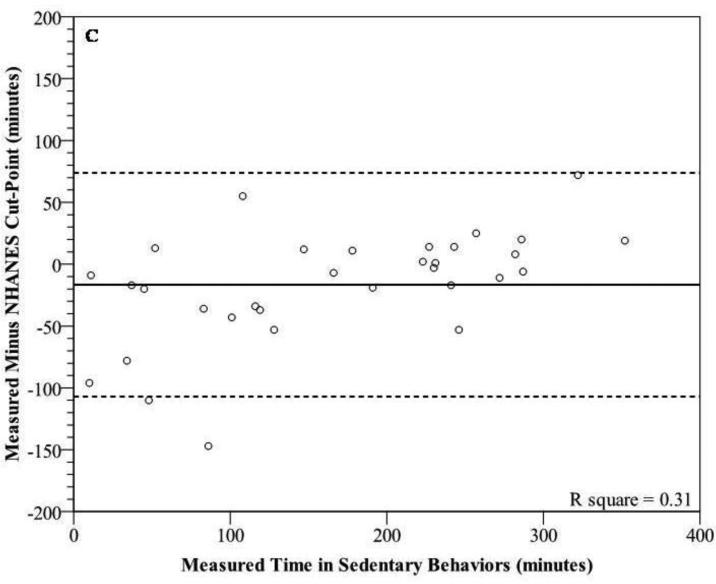
Bland-Altman plots for sedentary behaviors (figure 2a-c) and MVPA (figures 3a-d) show wide individual variation for the different prediction methods. For sedentary behaviors, the 2006 Crouter algorithm had the lowest mean bias, but all three prediction methods had wide individual variation with 95% PIs ranging from ±90.4 to 108.7 minutes. In addition, there were significant trends, showing that as the measured time for sedentary behaviors increased, there was a tendency for the prediction methods to have a greater underestimation (r2 range 0.31-0.43). For time spent in MVPA, the Matthews cut-points had the lowest mean bias, overestimating measured time spent in MVPA by 13.6 min (26.3%). The 2010 Crouter algorithm overestimated measured time spent in MVPA by 23.8 minutes (46%). All four prediction methods had wide individual variation with 95% PIs ranging from ±77.5 to 86.7 minutes, for MVPA. The 2006 and 2010 Crouter algorithms and Matthews cut-points did not have significant trends to have greater under- overestimation errors as measure MVPA time increased, with r2 values of 0.00, 0.02, and 0.10, respectively. However, the NHANES cut-point for MVPA had a significant trend to have a greater underestimation error as the measured time increased (r2=0.62).
Figure 2.
Modified Bland-Altman plots depicting error scores for time in sedentary behaviors [measured (Cosmed K4b2) minus prediction method] for (A) 2006 Crouter algorithm, (B) 2010 algorithm, and (C) NHANES Cut-Point. Matthews cut-point is not included due to it being the same as the NHANES cut-point. The solid line represents the mean bias and the dashed lines represent the 95% prediction interval of the individual observations.
Figure 3.
Modified Bland-Altman plots depicting error scores for time in moderate and vigorous physical activity [measured (Cosmed K4b2) minus prediction method] for (A) 2006 Crouter algorithm, (B) 2010 Crouter algorithm, (C) NHANES Cut-Points, and (D) Matthews Cut-Points. The solid line represents the mean bias and the dashed lines represent the 95% prediction interval of the individual observations.
DISCUSSION
This is the first study to examine the validity of the 2006 and 2010 Crouter algorithms,12, 13 Matthews cut-points,10, 11 and the NHANES cut-points1, 2 for predicting average METs and time spent in various PA intensity categories, in a free-living environment. The primary findings are: 1) The 2010 Crouter algorithm was a significant improvement over the 2006 Crouter algorithm for estimating EE and time spent in LPA, MPA, and VPA; 2) the 2006 Crouter algorithm, using an inactivity threshold of 50 counts per minute, provided the closest estimate to measured sedentary time; 3) the 2010 Crouter algorithm estimates for LPA, MPA, and VPA, the Matthews cut-point estimates for MPA, and VPA, and the NHANES cut-point estimates for LPA and VPA were not significantly different from the measured values, however mean percent errors ranged from 8% to 63%; and 4) there was large individual variation for all prediction methods examined.
Recently, Rothney et al.18 observed that the 2006 Crouter algorithm overestimated measured EE, using a room calorimeter, by 10.2±11.4% and significantly underestimated time in LPA by approximately 25% and overestimated MPA by approximately 75%. This current study also found that the 2006 Crouter algorithm significantly overestimated mean METs and time spent in MPA by 22% and 76.4%, respectively, and significantly underestimated time spent in LPA by 34.4%. In addition, the results from this study demonstrate that the 2010 Crouter algorithm, compared to the 2006 Crouter algorithm, significantly improves the estimate of mean METs and time spent in all activity intensity categories, except sedentary behaviors, during free-living activity. However, while the mean estimates are improved using the 2010 Crouter algorithm, there was only a small improvement in the individual predictions, as indicated by the Bland-Altman plots. For example, the mean error and 95% PI for the 2006 and 2010 Crouter algorithms for MVPA were 43.3±86.7 and 23.8±78.1 min, respectively. Furthermore, the NHANES cut-points had a mean error and 95% PI for MVPA of -26.3±77.5 min. These results are in contrast to previous validation studies on structured physical activity bouts showing that the Crouter algorithms was more accurate than single regression equations on both a group and individual basis.12, 13
This is this first study to report on the validity of the NHANES cut-points used for the analysis of the 2003-2004 NHANES accelerometer data2 or the Matthews cut-points10, 11 during free-living activity using indirect calorimetry. Of particular interest is the accuracy of the MPA cut-points used in the analysis of the ActiGraph data collected in NHANES.2 Based on the results from NHANES 2003-2004, less than 5% of adults meet the CDC/ACSM PA recommendation of accumulating 30 minutes of moderate intensity activity, in bouts of 10 min or more, on most days of the week.2, 19 This is in contrast to self-report PA measures, such as the Behavioral Risk Factor Surveillance Survey (BRFSS), which in 2001 and 2003 estimate the prevalence to be 45-46%.20
The current study showed the NHANES cut-point for the lower bounds of MVPA (i.e. 2020 counts per minute) significantly underestimated measured time in MVPA by 26.3±38.2 minutes (50.9%) during the 6-hr measurement period. This indicates that the NHANES analysis is greatly underestimating the true amount of time the average American is spending in MVPA. For example, based on the 2003-2004 NHANES data, individuals 20-39 years of age accumulated approximately 31.9 minutes of MVPA per day, on average.2 In contrast, Hagstromer et al,5 found that using the same 2003-2004 NHANES data set, individuals 18-39 years of age accumulated approximately 133.5 minutes of MVPA per day when using the Matthews cut-point of 760 counts.min−1, although the prevalence of meeting the PA recommendation were not calculated in this study. However, based on the results of the present study and others5, 21, it seems clear that the true prevalence of those meeting the CDC/ACSM PA recommendation is higher than what has been reported by Troiano et al.2 In all likelihood, it falls somewhere between previous estimates from objective (5%) and subjective (46%) measures. However, since the PA recommendation is based on bouts of MPA lasting at least 10 minutes and we did not obtain a measure of that in the present study, it is difficult to estimate how much higher the PA prevalence value would be.
There is increasing interest in measuring sedentary behaviors due to the potential health consequences of sitting for prolonged periods of time independent of how much MVPA one obtains.22-24 In the current study we examined the use of three inactivity thresholds; 1) 50 counts per minute as proposed in the development of the 2006 Crouter algorithm13; 2) 100 counts per minute as proposed by Matthews et al.1; and 3) 8 counts per 10 seconds, which was proposed in the development of the 2010 Crouter algorithm.12 Based on the results of the current study, using inactivity thresholds of 50 and 100 counts per minute resulted in a 3 minute (1.8%) underestimation and 16.5 minute (9.9%) overestimation, respectively, of sedentary time. Both estimates were not significantly different from the criterion, but there were large individual errors with both inactivity thresholds. The use of 8 counts per 10 sec resulted in a significant underestimation of measured sedentary time by 34.9 minutes (20.8%).
In theory, 50 counts per minute (2006 Crouter algorithm) and 8 counts per 10 sec (50 counts per minute divided by 6) should provide similar results for time in sedentary behaviors, however, what we have found is that there is greater variability in the accelerometer counts when collecting the data in shorter epochs. After further investigation of the current dataset, a cut-point of 25 counts per 10 seconds provided an estimate of sedentary behavior (155.6±79.2) that was within 11.9 minutes (7.1%) of the measured sedentary time. However, changing the inactivity threshold also changed the amount of estimated LPA time by the 2010 Crouter algorithm (table 3). Further investigation is needed to determine the appropriate inactivity thresholds to use with shorter epochs such as 10 sec that maximize the sensitivity and sensitivity for estimating sedentary and LPA.
Table 3.
Mean (s.d.) time (min) spent in sedentary behaviors (SB) and light physical activity (LPA) during the 6-hr measurement period for the Cosmed K4b2, 2010 Crouter algorithm, and 2010 Crouter algorithm using an inactivity threshold of 25 counts per 10 seconds.
| Cosmed METs | 2010 Crouter Algorithm (inactivity threshold 8 counts | 2010 Crouter Algorithm (inactivity threshold 25 counts per 10 | |
|---|---|---|---|
| SB | 167.5 (99.4) | 132.6 (76.1)* | 155.6 (79.2) |
| LPA | 117.1 (74.0) | 128.3 (41.0) | 108.8 (41.0) |
significantly different from Cosmed METs (P<0.05).
Recently Kozey-Keadle and colleagues showed that an inactivity threshold of 150 counts per minute provided the best estimate of sedentary time (mean error 1.8%), while inactivity thresholds of 50 and 100 counts per minute underestimated sedentary time, on average by 15% and 4.9%, respectively.25 This is in contrast to the current study that found 50 counts per minute provided the best estimate of time in sedentary behaviors compared to indirect calorimetry. One difference between the current study and Kozey-Keadle's study is that they used the ActiGraph GT3X, initialized using the low frequency extension and the current study used the ActiGraph GT1M without the low frequency extension. Recently, Rothney et al26 showed that the ActiGraph GT1M gave lower count values than the 7164 at very low frequencies, when they placed them on a mechanical shaker. For this reason, ActiGraph modified their digital bandpass filter by extending it to include lower frequencies (i.e. the “low frequency extension” option that can be enabled on the current GT1M and GT3X models), which is intended to improve the comparability in count values between the different ActiGraph models, as shown by John et al27; however this may be contributing to the differences seen between the studies. Another difference between the studies is that the current study defined sedentary time as a measured MET value less than 1.5 METs, while the study by Kozey-Keadle used direct observation. This difference in methodology may also contribute to some of the difference seen as measurements by indirect calorimetry are influenced by previous activity before becoming sedentary. For example, if an individual is playing basketball and then sits, the oxygen consumption would remain elevated, while direct observation would show the actual sitting time, giving different results.
Development and validation of accelerometer prediction equations can occur under different conditions (e.g. structured activities, free-living conditions, etc) and using different gold standards (e.g. doubly labeled water (DLW), room calorimeter, etc). This can greatly impact the interpretation of the results. In previous studies, we have shown that the use of a 2-regression model vastly improves the mean estimates and individual predictions of EE and time spent in PA intensity categories during structured 10-min bouts, compared to single regression models.12, 13, 28, 29 However, in the current study, during free-living activity the 2010 Crouter algorithm was not a significant improvement for mean estimates or individual predictions of time spent in PA intensity categories compared to the Troiano cut-points. Although DLW is considered the gold standard for measuring EE under free-living conditions, it does not provide information on bouts or intensities of activities performed. Indirect calorimetry is generally chosen to measure EE when duration and intensity are variables of interest. However, a concern with indirect calorimetry is that it may underestimate the total energy cost of free-living activities that have a significant anaerobic contribution. During the development of accelerometer prediction equations, participants generally perform structured activities bouts and sub-maximal, steady state VO2 values are used to reflect the energy cost of the specific activities. However, VO2 on-and off-kinetics can affect the shape of the VO2 versus time relationship. In a free-living environment, indirect calorimetry underestimates the energy cost at the start of an activity bout, and it overestimates the energy cost during the recovery period. While these over and underestimations tend to balance each other out where total energy expenditure is concerned, there can nonetheless be errors in computing the amount of time spent at a specific intensity. Future studies of free-living activity need to examine more closely the choice of validation criteria and perhaps consider the use of direct observation as a criterion. This should allow for a better understanding of when the accelerometer prediction equations work well or when they fail.
In conclusion, previous validation studies using structured bouts of physical activity showed the 2006 and 2010 Crouter algorithms to be more accurate than single regression models for the ActiGraph accelerometer. However, the current study, which examined the prediction equations during unstructured free-living activity, does not fully support those findings. The 2010 Crouter algorithm was a significant improvement over the 2006 Crouter algorithm for estimating EE and time spent in LPA, MPA, and VPA compared to direct calorimetry. The 2010 Crouter algorithm and NHANES cut-points worked reasonably well for estimating LPA, but the 2010 Crouter algorithm overestimated MPA by 44.5% and the NHANES cut-points underestimated MPA by 50.4%. The large underestimation of MPA using the NHANES cut-points has practical importance, since it suggests that the current accelerometer-based prevalence estimates of adults who meet the PA guidelines is an underestimation. Moreover, it does not appear that the 2010 Crouter algorithm would be an improvement given that it overestimated MPA by 44%. Future research needs to investigate newer analytical techniques (e.g. artificial neural networks)14, 18 to determine whether they can improve group and individual estimates of EE and time spent in PA intensity categories, during free-living activity.
ACKNOWLEDGEMENTS
This research was supported by NIH Grant 01R21 CA122430-01. No financial support was received from any of the activity monitor manufacturers, importers, or retailers.
REFERENCES
- 1.Matthews CE, Chen KY, Freedson PS, et al. Amount of time spent in sedentary behaviors in the United States, 2003-2004. Am J Epidemiol. 2008;167:875–881. doi: 10.1093/aje/kwm390. [DOI] [PMC free article] [PubMed] [Google Scholar]
- 2.Troiano RP, Berrigan D, Dodd KW, Masse LC, Tilert T, McDowell M. Physical activity in the United States measured by accelerometer. Med Sci Sports Exerc. 2008;40:181–188. doi: 10.1249/mss.0b013e31815a51b3. [DOI] [PubMed] [Google Scholar]
- 3.Atienza AA, Moser RP, Perna F, et al. Self-Reported and Objectively-Measured Activity Related To Biomarkers Using NHANES. Med Sci Sports Exerc. 2010 doi: 10.1249/MSS.0b013e3181fdfc32. Online first, Oct 15 2010, doi: 10.1249/MSS.0b013e3181fdfc32. [DOI] [PubMed] [Google Scholar]
- 4.Fan AZ, Ham SA, Muppidi SR, Mokdad AH. Validation of reported physical activity for cholesterol control using two different physical activity instruments. Vasc Health Risk Manag. 2009;5:649–661. doi: 10.2147/vhrm.s6164. [DOI] [PMC free article] [PubMed] [Google Scholar]
- 5.Hagstromer M, Troiano RP, Sjostrom M, Berrigan D. Levels and patterns of objectively assessed physical activity--a comparison between Sweden and the United States. Am J Epidemiol. 2010;171:1055–1064. doi: 10.1093/aje/kwq069. [DOI] [PubMed] [Google Scholar]
- 6.Metzger JS, Catellier DJ, Evenson KR, Treuth MS, Rosamond WD, Siega-Riz AM. Patterns of objectively measured physical activity in the United States. Med Sci Sports Exerc. 2008;40:630–638. doi: 10.1249/MSS.0b013e3181620ebc. [DOI] [PubMed] [Google Scholar]
- 7.Metzger JS, Catellier DJ, Evenson KR, Treuth MS, Rosamond WD, Siega-Riz AM. Associations between patterns of objectively measured physical activity and risk factors for the metabolic syndrome. Am J Health Promot. 2010;24:161–169. doi: 10.4278/ajhp.08051151. [DOI] [PMC free article] [PubMed] [Google Scholar]
- 8.Tudor-Locke C, Brashear MM, Johnson WD, Katzmarzyk PT. Accelerometer profiles of physical activity and inactivity in normal weight, overweight, and obese U.S. men and women. Int J Behav Nutr Phys Act. 2010;7:60. doi: 10.1186/1479-5868-7-60. [DOI] [PMC free article] [PubMed] [Google Scholar]
- 9.Tudor-Locke C, Johnson WD, Katzmarzyk PT. Accelerometer-determined steps per day in US adults. Med Sci Sports Exerc. 2009;41:1384–1391. doi: 10.1249/MSS.0b013e318199885c. [DOI] [PubMed] [Google Scholar]
- 10.Matthews CE. Calibration of accelerometer output for adults. Med Sci Sports Exerc. 2005;37:S512–522. doi: 10.1249/01.mss.0000185659.11982.3d. [DOI] [PubMed] [Google Scholar]
- 11.Matthews CE. Physical activity in the United States measured by accelerometer: comment. Med Sci Sports Exerc. 2008;40:1188. doi: 10.1249/MSS.0b013e31817057da. author reply 1189. [DOI] [PubMed] [Google Scholar]
- 12.Crouter SE, Kuffel E, Haas JD, Frongillo EA, Bassett DR., Jr A refined 2-regression model for the ActiGraph accelerometer. Med Sci Sports Exerc. 2010;42:1029–1037. doi: 10.1249/MSS.0b013e3181c37458. [DOI] [PMC free article] [PubMed] [Google Scholar]
- 13.Crouter SE, Clowers KG, Bassett DR., Jr A novel method for using accelerometer data to predict energy expenditure. J Appl Physiol. 2006;100:1324–1331. doi: 10.1152/japplphysiol.00818.2005. [DOI] [PubMed] [Google Scholar]
- 14.Staudenmayer J, Pober D, Crouter S, Bassett D, Freedson P. An artificial neural network to estimate physical activity energy expenditure and identify physical activity type from an accelerometer. J Appl Physiol. 2009;107:1300–1307. doi: 10.1152/japplphysiol.00465.2009. [DOI] [PMC free article] [PubMed] [Google Scholar]
- 15.Kuffel EE, Crouter SE, Haas JD, Frongillo EA, Bassett JR., DR. Validity of estimating minute-by-minute energy expenditure with accelerometry (abstract). Med Sci Sports Exerc. 2008;40:S415. [Google Scholar]
- 16.McLaughlin JE, King GA, Howley ET, Bassett DR, Jr., Ainsworth BE. Validation of the COSMED K4b2 portable metabolic system. Int J Sports Med. 2001;22:280–284. doi: 10.1055/s-2001-13816. [DOI] [PubMed] [Google Scholar]
- 17.Bland JM, Altman DG. Statistical methods for assessing agreement between two methods of clinical measurement. Lancet North Am Ed. 1986;1:307–310. [PubMed] [Google Scholar]
- 18.Rothney MP, Brychta RJ, Meade NN, Chen KY, Buchowski MS. Validation of the ActiGraph Two-Regression Model for Predicting Energy Expenditure. Med Sci Sports Exerc. 2010;42:1785–1792. doi: 10.1249/MSS.0b013e3181d5a984. [DOI] [PMC free article] [PubMed] [Google Scholar]
- 19.Pate RR, Pratt M, Blair SN, et al. Physical activity and public health. A recommendation from the Centers for Disease Control and Prevention and the American College of Sports Medicine. JAMA. 1995;273:402–407. doi: 10.1001/jama.273.5.402. [DOI] [PubMed] [Google Scholar]
- 20.Sapkota S, Bowles HR, Ham SA, Kohl HW. Adult participation in recommended levels of physical activity—United States, 2001 and 2003. MMWR. 2005;54:1208–1212. [PubMed] [Google Scholar]
- 21.Welk GJ, McClain JJ, Eisenmann JC, Wickel EE. Field validation of the MTI Actigraph and BodyMedia armband monitor using the IDEEA monitor. Obesity. 2007;15:918–928. doi: 10.1038/oby.2007.624. [DOI] [PubMed] [Google Scholar]
- 22.Healy GN, Dunstan DW, Salmon J, et al. Breaks in sedentary time: beneficial associations with metabolic risk. Diabetes Care. 2008;31:661–666. doi: 10.2337/dc07-2046. [DOI] [PubMed] [Google Scholar]
- 23.Healy GN, Dunstan DW, Salmon J, Shaw JE, Zimmet PZ, Owen N. Television time and continuous metabolic risk in physically active adults. Med Sci Sports Exerc. 2008;40:639–645. doi: 10.1249/MSS.0b013e3181607421. [DOI] [PubMed] [Google Scholar]
- 24.Katzmarzyk PT, Church TS, Craig CL, Bouchard C. Sitting time and mortality from all causes, cardiovascular disease, and cancer. Med Sci Sports Exerc. 2009;41:998–1005. doi: 10.1249/MSS.0b013e3181930355. [DOI] [PubMed] [Google Scholar]
- 25.Kozey-Keadle S, Libertine A, Lyden K, Staudenmayer J, Freedson P. Validation of Wearable Monitors for Assessing Sedentary Behavior. Med Sci Sports Exerc. 2011 doi: 10.1249/MSS.0b013e31820ce174. Online first, doi:10.1249/MSS.0b013e31820ce174. [DOI] [PubMed] [Google Scholar]
- 26.Rothney MP, Apker GA, Song Y, Chen KY. Comparing the performance of three generations of ActiGraph accelerometers. J Appl Physiol. 2008;105:1091–1097. doi: 10.1152/japplphysiol.90641.2008. [DOI] [PMC free article] [PubMed] [Google Scholar]
- 27.John D, Tyo B, Bassett DR. Comparison of four ActiGraph accelerometers during walking and running. Med Sci Sports Exerc. 42:368–374. doi: 10.1249/MSS.0b013e3181b3af49. [DOI] [PMC free article] [PubMed] [Google Scholar]
- 28.Crouter SE, Bassett DR., Jr A new 2-regression model for the Actical accelerometer. Br J Sports Med. 2008;42:217–224. doi: 10.1136/bjsm.2006.033399. [DOI] [PubMed] [Google Scholar]
- 29.Crouter SE, Horton M, Kennard L, Bassett JR., DR Use of a 2-regression model for estimating energy expenditure in children [abstract]. Med Sci Sports Exerc. 2011:43. doi: 10.1249/MSS.0b013e3182447825. In Press. [DOI] [PMC free article] [PubMed] [Google Scholar]


