Abstract
The effect of the underlying blood vessel on the transient thermal response of the skin surface with and without a melanoma lesion is studied. A 3D computational model of the layers of the skin tissue with cancerous lesion was developed in COMSOL software package. Heat transfer in the skin layers and the lesion is governed by the Pennes bio-heat equation, while the blood vessel is modeled as fully developed pipe flow with constant heat transfer coefficient. The effect of various pertinent parameters, such as diameter of the blood vessel, lateral location of the blood vessel relative to the lesion, flow velocity of the blood, on the skin surface temperature distribution, have been studied in the paper. The results show significant influence of the underlying blood vessel on the temperature of the skin surface and lesion as well as on the surrounding healthy tissue. Thus, a need for development of evaluation criteria for detection of malignant lesions in the presence of blood vessels is is discussed.
1. INTRODUCTION
Melanoma is one of the deadliest forms of skin cancers and is 3rd fastest increasing in mortality rates among all cancers in males in the United States [1]. Early detection plays a very important role in increasing the chances of survival of patients diagnosed with melanoma. The survival rates drop from about 99% for patients diagnosed at an early stage to an alarming 15% for patients with advanced stage melanoma [2]. Thus, new techniques to detect melanoma at an early stage are currently being developed in numerous laboratories and research centers all over the world. Among these, quantitative, non-invasive, in vivo diagnostic tools are of particular interest. The Heat Transfer Lab at the Johns Hopkins University [3] developed a non-invasive optical measurement technique using dynamic (active) IR imaging, combined with theoretical, computational and experimental studies, for the detection of near-surface lesions, with emphasis on early stage melanoma. Dynamic IR imaging involves application of an external heating or cooling load to enhance thermal contrast. When a surface is heated or cooled, perturbations in the thermal properties of the structures located beneath the surface result in identifiable temperature differences on the surface. These provide critical information for identification of the characteristics of these perturbations when compared to information obtained by passive IR imaging. It has been demonstrated experimentally [4] that the difference in thermal responses between healthy tissue and malignant lesion can be used to detect melanoma and the result has been validated with the help of biopsy. However, the existence of blood vessels beneath the skin, which may play a dominant role in the thermal response of the skin, has not been assessed in the previous study. Thus, one of the objectives in the present study is to evaluate the effects of discrete blood vessels on the thermal signature of the melanoma lesion.
Blood vessels have a significant impact on the bioheat transfer in the skin tissue. Localized cooling produced by large blood vessels (diameter larger than 0.2 mm) during hyperthermia treatment motivated the incorporation of large vessel effects into bioheat transfer formulations [5–7]. The thermal significance of large blood vessels was recognized by Creeze and Lagendijk [8] and Kolios et al [9]. Chato [10] investigated the effect of single blood vessel near the skin surface on the temperature distribution of the skin and the heat transfer to the environment. Their results show that this effect increased with the decrease of ratio of the depth to radius and the Biot number. Rawnsley et al [11] evaluated the effects of introduction of discrete blood vessels in the Pennes’ bioheat transfer model [12] and the scalar Keff model. They found that Pennes’ model had a statistically better ability to predict the temperature distribution than the Keff model.
In the current study the effects of discrete blood vessels on the thermal signature of the melanoma lesion are studied by computational modeling, using the Pennes’ bioheat equation. The need for development of evaluation criteria for detection of malignant lesions is also assessed.
2. MODEL DESCRIPTION
2.1 Mathematical model and parameters
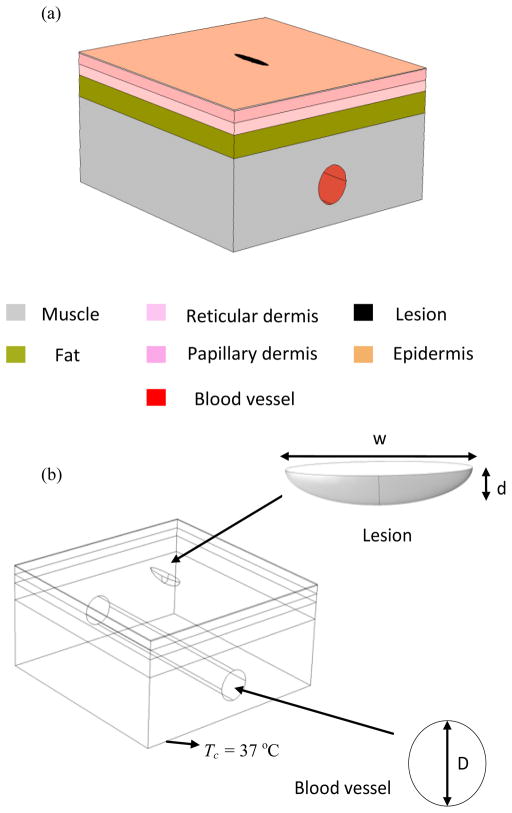
A 3D multilayer skin tissue model is built consisting of five layers, namely epidermis, papillary dermis, reticular dermis, fat layer and muscle (Fig. 1(a)). The lesion is modeled as a semi-ellipsoid with width w and depth d (Fig. 1 (b)). Heat transfer in the skin tissue and lesion is modeled using the Pennes bioheat equation, which is a form of the transient heat conduction equation given by:
| (1) |
where ρ, c, T, k, ωb and Q denote the tissue density, specific heat of the tissue, local tissue temperature, thermal conductivity, blood perfusion rate and metabolic heat generation rate in the tissue respectively and ρb, cb, Tb denote the density, specific heat and temperature of the blood. n denotes the specific skin layer. The mathematical model consists of the set of partial differential equations of the form of Eq. 1, one for each tissue layer and one for the lesion. This set of equations is solved simultaneously for a set of boundary and interfacial conditions.
FIGURE 1.
SCHEMATIC OF THE COMPUTATIONAL MODEL WITH LESION AND BLOOD VESSEL
The thermophysical properties, such as thermal conductivity (k), specific heat (c), density (ρ), and metabolic heat generation (Q), and thicknesses (p) for each of the skin layers are summarized in Table 1[13–16]. As concluded in a prior study [17], a malignant lesion is characterized by its increased metabolic activity and blood perfusion, and thus may cause an increase in the local skin temperature [18]. Thus, in the current model, the lesion is represented as a region of increased metabolic heat generation and blood perfusion. Based on previous studies [17, 19–20], the blood perfusion is taken five times larger, and the metabolic heat generation is taken ten times larger than in normal skin tissue. The properties of blood are set as follows: density ρb = 1060 kg m−3 [21], specific heat Cb = 3770 J kg−1K−1 [13], and the blood temperature is Tb = 37 °C [13].
TABLE 1.
THERMOPHYSICAL PROPERTIES OF SKIN LAYERS & LESION
| Layer | Thickness (mm) | Specific heat (J/kg.K) | Density (kg/m3) | Thermal conductivity (W/m.K) | Perfusion rate (10−3) (1/s) | Metabolic heat rate (W/m3) |
|---|---|---|---|---|---|---|
| Epidermis | 0.1 | 3589 | 1200 | 0.235 | 0 | 0 |
| Papillary dermis | 0.8 | 3300 | 1200 | 0.445 | 0.18 | 368.1 |
| Reticular dermis | 0.8 | 3300 | 1200 | 0.445 | 1.26 | 368.1 |
| Fat | 2 | 2674 | 1000 | 0.185 | 0.08 | 368.3 |
| Muscle | 8 | 3600 | 1085 | 0.51 | 2.7 | 684.2 |
| Lesion | - | 3852 | 1030 | 0.558 | 6.3 | 3680 |
The blood vessel is modeled as a tube with fully developed flow conditions and constant heat transfer coefficient. Human blood plasma, the continuous phase of blood, consists of 91% water and the remaining 9% is made up by proteins, inorganic salts and other organic substances [22]. Recent studies also demonstrated that blood plasma is a Newtonian fluid of viscosity 1.2 mPa·s at 37°C [23] and its viscosity is a function of temperature [24]. Thus, in the current study we approximate the blood in the blood vessel with water. The temperature of blood in blood vessel is taken to be 37 °C [13]. The blood vessel considered in the current study is the basilic vein located in the upper arm. The diameter D of basilic vein was found in literature to be varying in the range of 1.9 – 5.1mm [25]. We have taken the mean diameter to be 3.3mm in this study. The depth of the basilic vein d from the skin surface was taken to be 8 mm [26]. The mean blood velocity v was taken as 7.2 cm/s [27].
The computational analysis consists of three phases, initial steady state analysis, cooling of the skin surface, and transient thermal recovery. The steady state analysis consists of computing the steady state temperatures in the computational domain for the skin surface exposed to ambient conditions (Eq. 5). These computed temperatures are used as initial conditions for the cooling phase, which is carried out for 120s (tcooling) by imposing a constant temperature (Tcooling =10 °C) boundary condition on the skin surface. After 120s the cooling is removed, and the skin tissue along with the lesion is allowed to recover and to return to their steady state under ambient conditions.
2.2 Boundary conditions
The width of the model is large enough, such that the thermal effects of the lesion at the lateral boundaries can be neglected. Thus, at the lateral boundaries we have,
| (2) |
where η is direction normal to the surface. The temperature and heat flux continuity at the boundaries of the skin layers are given by:
| (3) |
| (4) |
The lower boundary of the model is assumed to be at constant temperature equal to TC (37 °C) which is the core body temperature. This is justified with the argument that the muscle layer is very near to the body core and is far enough from lesion to have an effect on its temperature. During the steady state and thermal recovery process, the boundary condition for the top boundary, the skin surface, is convection to ambient air. It is written as:
| (5) |
where h = 10 W/m2 K and T∞ = 21 °C. During the cooling process, a constant cooling temperature of Tcooling is applied on the top surface for the duration of tcooling seconds. Thus, the boundary condition is given as,
| (6) |
In the subsequent thermal recovery phase, the corresponding equations for each of the skin layers and lesion are solved numerically by applying the relevant boundary conditions to obtain the temperature distribution using the finite element solver in COMSOL Multiphysics4.2a [28]. The mesh generated is shown in Fig. 2. The mesh is finer on the skin surface and in the vicinity of the lesion, to accurately compute the surface temperature distribution.
FIGURE 2.
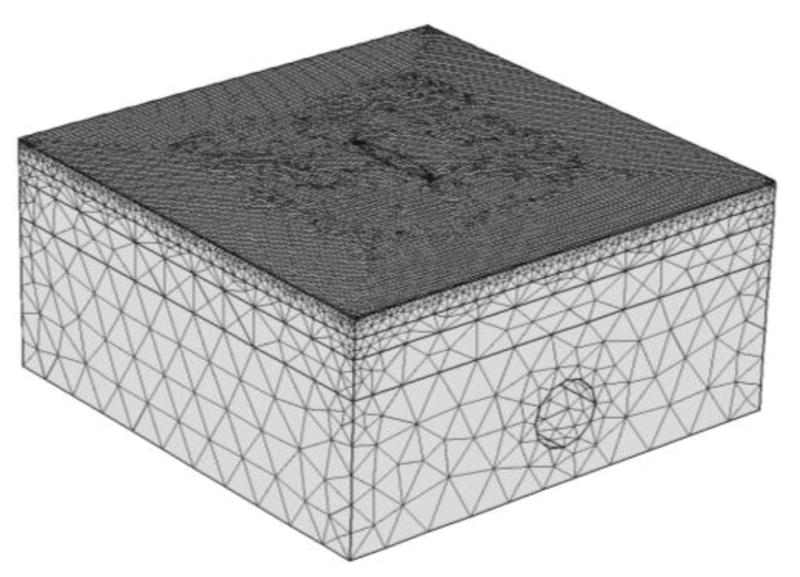
MESH GENERATED USING COMSOL
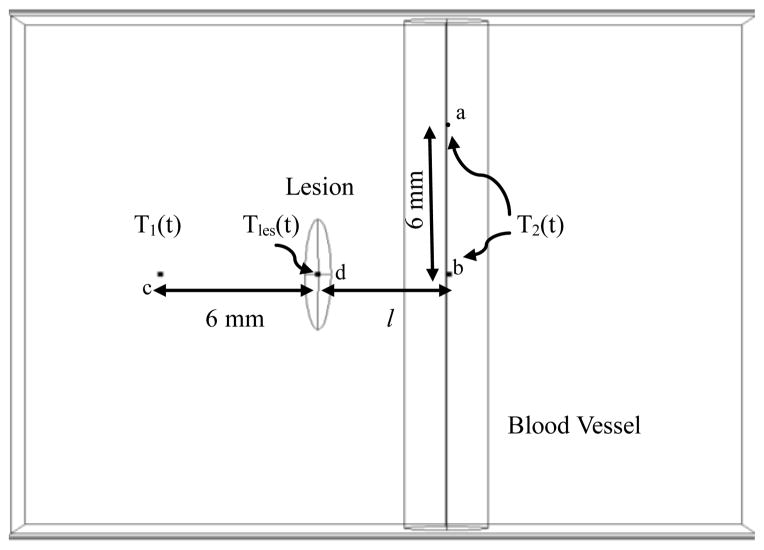
As stated previously, the difference in thermal responses between healthy tissue and malignant lesion is used for detection of melanoma. Hence, in this study, the temperature difference ΔT(t) between the lesion center and the healthy tissue during thermal recovery is computed at different points as shown in Fig. 3. Tles (t), the temperature at lesion center, is computed at point ‘d’. T1 (t), the temperature of a point on the healthy tissue away from the blood vessel, is computed at point ‘c’ located 6 mm from the lesion. T2 (t), the temperature of a point on the healthy tissue above the blood vessel, is computed at point ‘b’. For the case when the lesion is situated on top of the blood vessel, point ‘a’ is used for computing T2 (t). Here, l is the lateral distance of the blood vessel from the center of the lesion. If l = 0 mm, then the lesion is located on top of the blood vessel.
FIGURE 3.
POINTS OF INTEREST FOR COMPUTING TEMPERATURES DURING THERMAL RECOVERY
3. RESULTS AND DISCUSSION
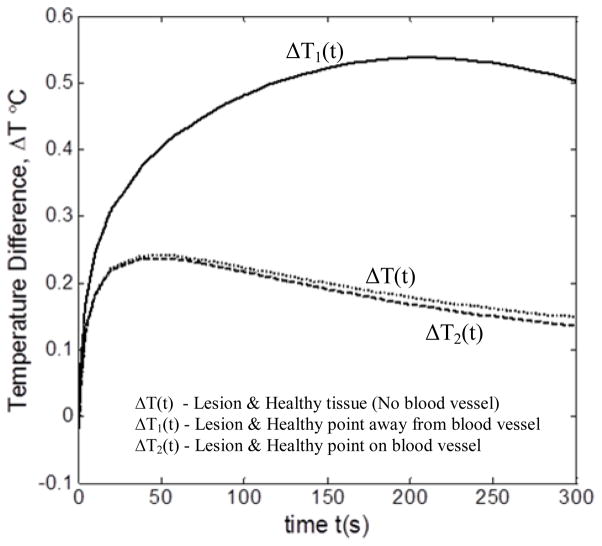
The prime point of interest in the present study is the effect of blood vessel on the thermal signature of lesion. Figure 4 compares the temperature difference between the lesion and the healthy tissue during thermal recovery for two cases: (1) when blood vessel is present and (2) when it is absent. The results were obtained for D = 3.3 mm, v = 7 cm/s, l = 0 mm and d = 8 mm. For the case in which the blood vessel is absent, temperature difference ΔT(t) was computed between the center of the lesion and a point on the healthy tissue located 6 mm away from the lesion. For the other case, the lesion center and two healthy tissue points, one located on the blood vessel and one 6 mm away from the blood vessel, are considered.
FIGURE 4.
TEMPERATURE DIFFERENCE ΔT (t) BETWEEN LESION & HEALTHY TISSUE DURING THERMAL RECOVERY
It can clearly be seen from the figure that the blood vessel has a marked effect on the temperature difference between lesion and healthy tissue during thermal recovery. For example, the maximum temperature difference between lesion and healthy tissue away from blood vessel (ΔT1(t)) was 0.55°C for blood vessel case, whereas it was 0.22°C when blood vessel was absent (ΔT(t)). This is because the perfused heat from the blood vessel increases the temperature of the skin surface above it, thereby increasing the temperature of the lesion. Hence, maximum temperature difference is obtained for lesion and unaffected healthy tissue away from the blood vessel. It can also be noticed that there is not much difference between the temperature difference profiles for the no blood vessel case (ΔT(t)) and for the case where both lesion and healthy tissue point are on top blood vessel (ΔT1(t)). The reason for this is the perfused heat from the blood vessel equally affects the healthy tissue and lesion above it. Thus, the presence of blood vessel clearly affects the skin surface temperature above the lesion and healthy tissue. Hence, the effect of various parameters on the thermal signature of the lesion is studied.
3.1 EFFECT OF BLOOD VESSEL DIAMETER
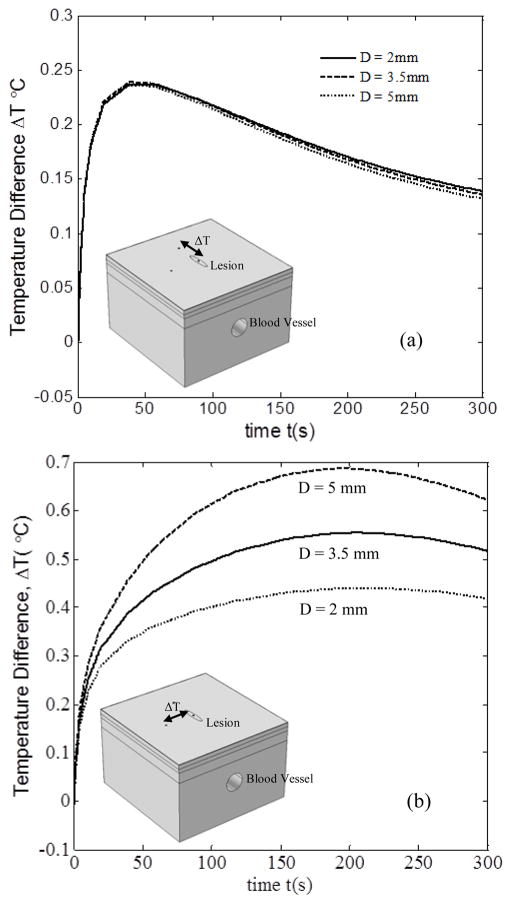
Figure 5 shows the temperature difference profiles between the lesion and the healthy tissue, for three blood vessel diameters, viz., D = 2 mm, D = 3.3 mm and D = 5 mm. The results were obtained for v = 7 cm/s, l = 0 mm and d = 8 mm. Figure 5(a) shows the temperature difference between lesion and healthy tissue above the blood vessel during thermal recovery with change in diameter D. With increase in D from 2mm to 5mm, the change in ΔT(t) was minimal. This indicates that the blood vessel diameter has no evident influence on the temperature distribution. As both the lesion and healthy tissue were on top of the blood vessel, the effect of perfused heat on them was nearly the same regardless of the increase of blood vessel diameter. It is also to be noted that the temperature difference curve firstly increased sharply, and then decreased smoothly. The maximum temperature difference between the two points was about 0.24°C, which was obtained at about 45s after the cooling stress was removed. However, the temperature difference between the lesion point and the healthy tissue 6 mm away from the blood vessel did not follow the same trend, as can be seen in Fig. 5 (b). During thermal recovery, the temperature difference between these two points increased for a longer time, and nearly kept constant for about 120s.Then it decreased slowly. This means that the existence of the blood vessel pays a significant role in the thermal recovery of the lesion and the normal tissue adjunct to the blood vessel. Moreover, it is evident that with the increase in blood vessel diameter, the temperature difference followed a monotonic increase. This may be attributed to that the heat exchange between the tissue and the blood vessel increased significantly as the vessel diameter increased. For example, the maximum difference can be up to 0.68°C for the case with diameter of 5mm. However, the maximum value for the case with diameter of 2mm is 0.41°C.
FIGURE 5.
EFFECT OF BLOOD VESSEL DIAMETER ON ΔT BETWEEN THE LESION POINT AND HEALTHY TISSUE POINT, (a) ATOP THE BLOOD VESSEL, (b) AWAY FROM THE BLOOD VESSEL
By comparing Fig. 5 (a) and Fig. 5 (b), it can be seen that the blood vessel has a significant effect on the temperature difference distribution between healthy tissue and the lesion, which is consistent with the results of Deng and Liu [19]. The existence of the blood vessel can induce a nearly 0.3°C difference. Therefore, it is essential to consider the blood vessel effect as it may yield false positive results in melanoma diagnosis.
3.2 EFFECT OF BLOOD FLOW VELOCITY
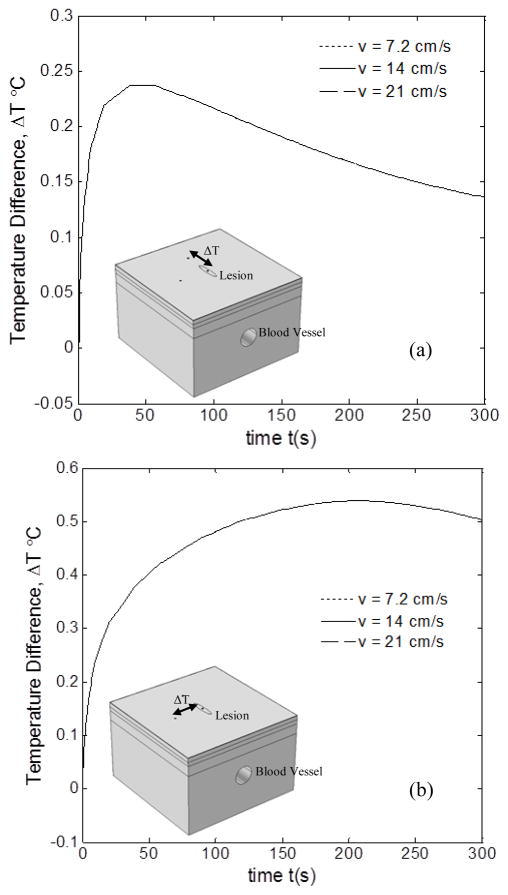
Figure 6 shows the temperature difference profiles between the lesion and the healthy tissue, for three blood flow velocities, viz., v = 7.2 cm/s, v = 14 cm/s and v = 21 cm/s. The results were obtained for D = 3.3 mm, l = 0 mm and d = 8 mm. Figure 6(a) shows the temperature difference between lesion and healthy tissue above the blood vessel during thermal recovery with change in blood flow velocity v. It can clearly be observed that the change in blood flow velocity has no significant effect whatsoever on the temperature difference between lesion and healthy tissue on top of the blood vessel. Even for the case of temperature difference between lesion and healthy tissue away from blood vessel, there is no effect, as seen in Fig. 6(b). Thus, the temperature difference kept unchanged with the increase of the blood flow velocity, which was true for both healthy tissue points regardless of their different location. The reason for this is that with increased blood flow velocity, the heat exchange between the blood and tissue increased and its effect on the temperature distribution of the lesion and healthy tissue was nearly the same. Also, the maximum temperature difference between lesion and healthy tissue on the blood vessel was about 0.24°C, whereas it was about 0.51°C for the case of healthy tissue 6mm away from the blood vessel. This again clearly shows the effect of blood vessel on the thermal signature of both the lesion and healthy tissue similar to the trend followed in Fig. 5. This again reiterates the fact that the effect of blood vessel cannot be neglected in the thermal analysis of lesion.
FIGURE 6.
EFFECT OF BLOOD FLOW VELOCITY ON ΔT BETWEEN THE LESION POINT AND HEALTHY TISSUE POINT, (a) ATOP THE BLOOD VESSEL, (b) AWAY FROM THE BLOOD VESSEL
3.3 EFFECT OF LATERAL LOCATION OF BLOOD VESSEL
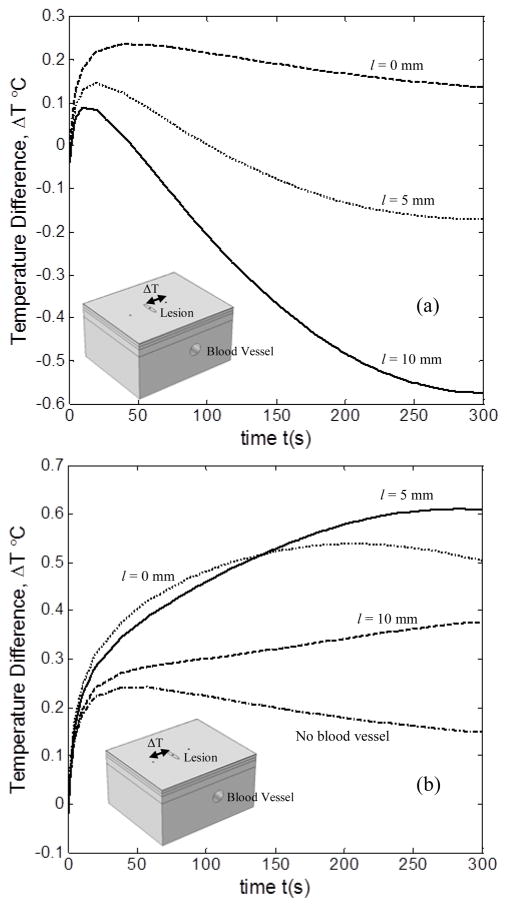
Figure 7 shows the temperature difference profiles between the lesion and the healthy tissue, for three different blood vessel locations relative to the lesion, namely, l = 0 mm, l = 5 mm and l = 10 mm. The results were obtained for D = 3.3 mm, v = 7 cm/s and d = 8 mm. Figure 7(a) shows the profiles for temperature difference between lesion and healthy tissue on top of blood vessel for different locations of the blood vessel. It can be observed that as the lateral distance between the lesion and blood vessel increases from l = 0 mm to l = 10 mm, the maximum temperature difference drops from 0.22°C to 0.08°C. This is in view of decreased heat perfusion from the blood vessel to lesion due to increased distance between the lesion and blood vessel. Also, for l = 10 mm, as the lesion and healthy tissue recover to steady state, it can be seen that the healthy tissue is at a higher temperature than the lesion. This shows that a superficial blood vessel can generate a higher thermal signature than a malignant lesion. This can lead to diagnosing false negatives if the effect of blood vessel is not considered.
FIGURE 7.
VARIATION IN ΔT BETWEEN THE LESION POINT AND THE HEALTHY TISSUE POINT, (a) ATOP THE BLOOD VESSEL, (b) AWAY FROM THE BLOOD VESSEL WITH CHANGE IN LOCATION OF BLOOD VESSEL
The effect of change in lateral location of the blood vessel on the temperature difference between the lesion and healthy tissue away from the blood vessel can be seen in Fig. 7 (b). As can be observed from the graph, as l increases from 0 mm to 5 mm, the temperature difference increased from a maximum of 0.52°C to 0.61°C. This explains that the blood vessel is not having an effect on the healthy tissue but it is having an effect on lesion thereby increasing the temperature difference. Now, as l increases from 5mm to 10mm, we can see that the temperature difference suddenly falls down to a maximum of 0.37 °C, lesser than for the case when l = 0 mm. This shows that the effect of blood vessel on the lesion has reduced, thereby decreasing the temperature difference. Thus, when we compare the temperature difference for the case where there is no blood vessel, we can see that as l increases beyond 10mm, it tends to approach the no blood vessel case. Therefore, we can find a threshold lateral distance after which the blood vessel will have no effect on the lesion. This would be a very useful parameter as it would help us to determine when the effect of blood vessel needs to be considered and when to be neglected.
4. CONCLUSIONS
The effect of blood vessel on the transient thermal response of melanoma lesion and healthy tissue was studied. It can clearly be seen that the relative location of lesion, healthy tissue and blood vessel has a significant effect on the temperature difference between malignant lesion and healthy tissue. Thus, false positives may be reported if location of healthy point is not carefully considered. The effect of blood flow velocity, diameter of blood vessel and location of blood vessel with respect to lesion on the temperature difference, ΔT, was also studied. It was shown that blood flow velocity has no effect on ΔT and the change in blood vessel diameter has a significant effect ΔT between the lesion and healthy tissue away from the blood vessel.
The location of blood vessel with respect to the lesion plays a major role on the temperature difference ΔT between the lesion and healthy tissue. It has been shown that there exists a threshold distance after which the blood vessel has no effect on the temperatures of the lesion and healthy tissue. Future scope of work includes determining this threshold distance and studying the effect of depth of blood vessel from the skin surface on the surface temperature distribution.
References
- 1.Siegel R, Ward E, Brawley O. Cancer Statistics, 2011. CA: A Cancer Journal for Clinicians. 2011;61(4):212–236. doi: 10.3322/caac.20121. [DOI] [PubMed] [Google Scholar]
- 2.Balch CM, Buzaid AC, Soong SJ. Final Version of the American Joint Committee on Cancer Staging System for Cutaneous Melanoma. Journal of Clinical Oncology: Official Journal of the American Society of Clinical Oncology. 2001;19(16):3635–3648. doi: 10.1200/JCO.2001.19.16.3635. [DOI] [PubMed] [Google Scholar]
- 3.Pirtini Çetingül M, Herman C. Quantification of the Thermal Signature of a Melanoma Lesion. International Journal of Thermal Sciences. 2011;50(4):421–431. [Google Scholar]
- 4.Cetingul MP, Herman C. The Assessment of Melanoma Risk using the Dynamic Infrared Imaging Technique. Journal of Thermal Science and Engineering Applications. 2011;3(3):031006–9. [Google Scholar]
- 5.Roemer RB. Optimal Power Deposition in Hyperthermia. I. the Treatment Goal: The Ideal Temperature Distribution: The Role of Large Blood Vessels. Int J Hyperthermia. 1991;7(2):317–341. doi: 10.3109/02656739109004999. [DOI] [PubMed] [Google Scholar]
- 6.Lemons DE, Chien S, Crawshaw LI. Significance of Vessel Size and Type in Vascular Heat Transfer. The American Journal of Physiology. 1987;253(1 Pt 2):R128–35. doi: 10.1152/ajpregu.1987.253.1.R128. [DOI] [PubMed] [Google Scholar]
- 7.Levin W, Sherar MD, Cooper B. Effect of Vascular Occlusion on Tumour Temperatures during Superficial Hyperthermia. International Journal of Hyperthermia: The Official Journal of European Society for Hyperthermic Oncology, North American Hyperthermia Group. 1994;10(4):495–505. doi: 10.3109/02656739409009353. [DOI] [PubMed] [Google Scholar]
- 8.Crezee J, Lagendijk JJ. Experimental Verification of Bioheat Transfer Theories: Measurement of Temperature Profiles Around Large Artificial Vessels in Perfused Tissue. Physics in Medicine and Biology. 1990;35(7):905–923. doi: 10.1088/0031-9155/35/7/007. [DOI] [PubMed] [Google Scholar]
- 9.Kolios MC, Sherar MD, Hunt JW. Blood Flow Cooling and Ultrasonic Lesion Formation. Medical Physics. 1996;23(7):1287–1298. doi: 10.1118/1.597694. [DOI] [PubMed] [Google Scholar]
- 10.Chato JC. Heat Transfer to Blood Vessels. Journal of Biomechanical Engineering. 1980;102(2):110–118. doi: 10.1115/1.3138205. [DOI] [PubMed] [Google Scholar]
- 11.Rawnsley RJ, Roemer RB, Dutton AW. The Simulation of Discrete Vessel Effects in Experimental Hyperthermia. Journal of Biomechanical Engineering. 1994;116(3):256–262. doi: 10.1115/1.2895728. [DOI] [PubMed] [Google Scholar]
- 12.Pennes HH. Analysis of Tissue and Arterial Blood Temperatures in the Resting Human Forearm. Journal of Applied Physiology. 1948;1(2):93–122. doi: 10.1152/jappl.1948.1.2.93. [DOI] [PubMed] [Google Scholar]
- 13.Torvi DA, Dale JD. A Finite Element Model of Skin Subjected to a Flash Fire. Journal of Biomechanical Engineering. 1994;116(3):250–255. doi: 10.1115/1.2895727. [DOI] [PubMed] [Google Scholar]
- 14.Ahuja AS, Prasad KN, Hendee WR. Thermal Conductivity and Diffusivity of Neuroblastoma Tumor. Medical Physics. 1978;5(5):418–421. doi: 10.1118/1.594434. [DOI] [PubMed] [Google Scholar]
- 15.Wilson SB, Spence VA. A Tissue Heat Transfer Model for Relating Dynamic Skin Temperature Changes to Physiological Parameters. Physics in Medicine and Biology. 1988;33(8):895–912. doi: 10.1088/0031-9155/33/8/001. [DOI] [PubMed] [Google Scholar]
- 16.Werner J, Buse M. Temperature Profiles with Respect to Inhomogeneity and Geometry of the Human Body. Journal of Applied Physiology (Bethesda, Md: 1985) 1988;65(3):1110–1118. doi: 10.1152/jappl.1988.65.3.1110. [DOI] [PubMed] [Google Scholar]
- 17.Song CW, Lokshina A, Rhee JG. Implication of Blood Flow in Hyperthermic Treatment of Tumors. IEEE Transactions on Bio-Medical Engineering. 1984;31(1):9–16. doi: 10.1109/TBME.1984.325364. [DOI] [PubMed] [Google Scholar]
- 18.Draper JW, Boag JW. Skin Temperature Distributions Over Veins and Tumours. Physics in Medicine and Biology. 1971;16(4):645–654. doi: 10.1088/0031-9155/16/4/008. [DOI] [PubMed] [Google Scholar]
- 19.Deng ZS, Liu J. Mathematical Modeling of Temperature Mapping Over Skin Surface and its Implementation in Thermal Disease Diagnostics. Computers in Biology and Medicine. 2004;34(6):495–521. doi: 10.1016/S0010-4825(03)00086-6. [DOI] [PubMed] [Google Scholar]
- 20.Pardasani KR, Adlakha N. Exact solution to a heat flow problem in peripheral tissue layers with a solid tumor in the dermis. Indian J Prue Appl Math. 1991;22:679–687. [Google Scholar]
- 21.Duck FA. Physical Properties of Tissue: A Comprehensive Reference Book. London: Academic; 1990. [Google Scholar]
- 22.Mazumdar JN. Biofluid mechanics. World Scientific; 1998. [Google Scholar]
- 23.Pal R. Rheology of Concentrated Suspensions of Deformable Elastic Particles such as Human Erythrocytes. Journal of Biomechanics. 2003;36(7):981–989. doi: 10.1016/s0021-9290(03)00067-8. [DOI] [PubMed] [Google Scholar]
- 24.De Gruttola S, Boomsma K, Poulikakos D. Computational Simulation of a Non-Newtonian Model of the Blood Separation Process. Artificial Organs. 2005;29(12):949–959. doi: 10.1111/j.1525-1594.2005.00164.x. [DOI] [PubMed] [Google Scholar]
- 25.Baptista-Silva JCC, Dias AL, Cricenti SV. Anatomy of the Basilic Vein in the Arm and its Importance for Surgery. Brazilian Journal of Morphological Sciences. 2003;20(3):171–175. [Google Scholar]
- 26.Ferreira MS, Yanagihara JI. A Heat Transfer Model of the Human Upper Limbs. International Communications in Heat and Mass Transfer. 2012;39(2):196–203. [Google Scholar]
- 27.Ooue A, Ichinose-Kuwahara T, Shamsuddin A. Changes in Blood Flow in a Conduit Artery and Superficial Vein of the Upper Arm during Passive Heating in Humans. European Journal of Applied Physiology. 2007;101(1):97–103. doi: 10.1007/s00421-007-0478-8. [DOI] [PubMed] [Google Scholar]
- 28.Comsol Multiphysics, 2011, Version.


