

Abstract
Background
Despite the great advances in genomic technology observed in several crop species, the availability of molecular tools such as microsatellite markers has been limited in melon (Cucumis melo L.) and cucurbit species. The development of microsatellite markers will have a major impact on genetic analysis and breeding of melon, especially on the generation of marker saturated genetic maps and implementation of marker assisted breeding programs. Genomic microsatellite enriched libraries can be an efficient alternative for marker development in such species.
Results
Seven hundred clones containing microsatellite sequences from a Tsp-AG/TC microsatellite enriched library were identified and one-hundred and forty-four primer pairs designed and synthesized. When 67 microsatellite markers were tested on a panel of melon and other cucurbit accessions, 65 revealed DNA polymorphisms among the melon accessions. For some cucurbit species, such as Cucumis sativus, up to 50% of the melon microsatellite markers could be readily used for DNA polymophism assessment, representing a significant reduction of marker development costs. A random sample of 25 microsatellite markers was extracted from the new microsatellite marker set and characterized on 40 accessions of melon, generating an allelic frequency database for the species. The average expected heterozygosity was 0.52, varying from 0.45 to 0.70, indicating that a small set of selected markers should be sufficient to solve questions regarding genotype identity and variety protection. Genetic distances based on microsatellite polymorphism were congruent with data obtained from RAPD marker analysis. Mapping analysis was initiated with 55 newly developed markers and most primers showed segregation according to Mendelian expectations. Linkage analysis detected linkage between 56% of the markers, distributed in nine linkage groups.
Conclusions
Genomic library microsatellite enrichment is an efficient procedure for marker development in melon. One-hundred and forty-four new markers were developed from Tsp-AG/TC genomic library. This is the first reported attempt of successfully using enriched library for microsatellite marker development in the species. A sample of the microsatellite markers tested proved efficient for genetic analysis of melon, including genetic distance estimates and identity tests. Linkage analysis indicated that the markers developed are dispersed throughout the genome and should be very useful for genetic analysis of melon.
Background
The Cucurbitaceae family includes several species of cultivated plants of great economic importance, such as watermelon (Citrullus lanatus L.), squash (Cucurbita maxima L.), melon (Cucumis melo L.) and cucumber (Cucumis sativus L.). The morphological variation observed in germplasm accessions of melon and other cucurbit species is enormous. Gene flow between cultigenes is facilitated by the allogamous habit of the species [1]. Difficulties concerning intraspecific botanical classification in C. melo, based mainly on morphological characters, have been addressed in the last 40 years [2-4]. Cultivated melon morphotypes are usually classified in three major groups: reticulatus, cantaloupensis and inodorus [3,4]. More recently, the reticulatus group has been suggested to be part of the cantaloupensis group [1]. Wild type melons are classified in the flexuosus, momordica, conomon, dudaim and chito groups [4].
Melon varieties that belong to the cantaloupensis or reticulatus groups are the most cultivated in the United States, usually called "muskmelon" or "cantaloupe", producing aromatic fruits with a netted or ribbed coat and a sweet orange flesh. However, the yellow melons of "Valenciano" type are the most important in the Brazilian [5] and other markets. In European countries it is the second most commercialized type of melon [6]. Valenciano melons are classified in the inodorus group, showing non-smelling fruits with a smooth or wrinkled rind and white or green sweet flesh. Fresh melon production is important for internal market consumption in Brazil, but a significant percentage of the production is exported to other countries [7-9]. Melon is actually one of the most important agronomic products of Northeastern Brazil, where soil and climate conditions are suitable for commercial production. Fruit quality, especially flavor, is among the most valued commercial traits demanding further improvement [8]. The development of Valenciano melon varieties with improved fruit quality could be accelerated with the use of genomic technology. This would include, for example, molecular mapping of genomic regions associated with fruit quality control and, eventually, marker assisted selection.
Molecular markers have been widely used in genetic analysis and breeding of plant species, with a multitude of applications [10]. Among the various types of molecular markers available, microsatellites have received greater attention recently, especially for breeding purposes. Microsatellite markers, also known as simple sequence repeats or SSRs [11,12], are clusters of short (usually 2 to 6) tandemly repeated nucleotide bases distributed throughout the genome. Microsatellite markers distinguish themselves as co-dominant, multiallelic, highly polymorphic genetic markers, requiring small amounts of DNA for straightforward PCR and gel electrophoresis analysis. Its main disadvantage is the high cost of the initial investment necessary for marker development [13]. The development of microsatellite markers can be based on DNA sequence information deposited in databases, or it could be based on the screening of genomic DNA libraries specifically constructed for the discovery of repeated sequences in the genome. The use of genomic libraries enriched for microsatellite sequences is a strategy devised to decrease the cost of marker development while increasing the opportunity for marker discovery [14].
The actual use of microsatellite markers in melon genetic analysis has been very limited. Only about 70 microsatellite markers have been described in the literature so far [15,16] and just a few used in linkage analysis. These markers were integrated in genetic maps built with morphological, isoenzimatic and other molecular markers such as RFLP (Restriction Fragment Length Polymorphisms), AFLP (Amplified Fragment Length Polymorphisms) and RAPD (Random Amplified Polymorphic DNA [16-28]. There is, therefore, great need to discover and develop more microsatellite markers for genetic and linkage analysis of melon.
The main objectives of this work were to develop new microsatellite markers for melon based on a genomic DNA library enriched for microsatellite sequences and test their usefulness: (a) in genetic linkage analysis; (b) to determine genetic distances between varieties of Valenciano melons and (c) as molecular markers in other cucurbit species.
Results and Discussion
Genomic library enriched for microsatellite sequences
A Tsp-AG/TC genomic library was constructed and a total of 700 positive colonies were identified as a result of the hybridization of 1600 clones with (AG/TC)13 probes, most of them containing microsatellite repeat sequences. Anchored-PCR reactions confirmed microsatellite presence in 450 of the 700 clones and allowed the identification of the size, orientation and position of microsatellite sequences in these clones. This information was important for selecting the clones to be sequenced, reducing costs and time. Knowledge of the DNA sequences flanking the microsatellite region allowed for primer design and synthesis. A set of 237 primer pairs was initially developed based on information generated by the anchored-PCR approach and one hundred and forty-four primer pairs were synthesized (additional file 1). Fifty-nine of these markers had perfect AG or TC repeats (41%), 68 had complex repeats (47%) and 17 had compound repeats (12%) (additional file 1). A greater amount of perfect repeats was detected in this sample compared to what was observed for the 40 melon microsatellite markers already published, which reported 34% of perfect repeats, 24% of compound repeats and 42% of complex repeats [16]. The number of repeat units observed in the new microsatellite markers varied from 3 to 40 (additional file 1), while in the markers already published the observed range was 7–15 (dinucleotides) and 5–10 (trinucleotides) [15,16].
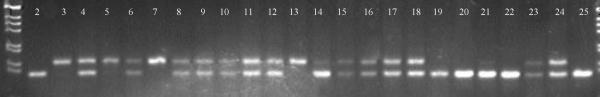
Sixty-seven out of 144 primer pairs were immediately selected for genetic tests since their PCR conditions did not require further adjustments. The sixty-seven markers were tested on a panel of 11 varieties of six cucurbit species (C. melo, Citrullus lanatus, Cucurbita maxima, C. moschata, C. pepo and Cucumis sativus). Sixty-five markers detected DNA polymorphism between the five melon accessions analyzed (Figure 1).
Figure 1.

Microsatellite amplification products submitted to polyacrylamide gel (PAGE) electrophoresis and visualized by silver nitrate staining. From left to right: Lanes 1 and 13: ladder 10 bp; Lanes 2 to 7: melon accessions CNPH 82015, CNPH 84201, CNPH 03971, CNPH 84177 and CNPH 85205; Lanes 8 to 12: Citrullus lanatus (Crimson Sweet), Cucurbita maxima (Exposição) (no amplification), C. moschata (Menina Brasileira), C. pepo (Caserta) and Cucumis sativus (Caipira). Arrows indicate ladder fragments of 120 and 140 bp.
Marker transferability to other cucurbit species
Thirty-three of the 67 new melon microsatellite markers tested on the cucurbit panel generated PCR products with sample DNA from cucumber (Cucumis sativus), 16 with watermelon DNA (Citrullus lanatus), 11 with Cucurbita moschata DNA and a smaller amount (8 primer pairs) with C. maxima and Cucurbita pepo DNA. Previously reported estimates of microsatellite marker transferability from melon to cucumber were similar to these results [16]. It seems, therefore, that the level of microsatellite marker transferability in the genus Cucumis resembles what is observed in other intragenus comparisons, such as Glycine, where up to 65% of the microsatellite markers developed for G. max could be transferred to other Glycine species [29]. This, of course, results in a rapid dissemination of marker use and facilitates studies on mapping and comparative genetics. Likewise, the use of melon microsatellite markers for DNA polymorphism assessment in cucurbit species represents a significant reduction of marker development costs and a shortcut to in-depth genetic analysis of these species.
Six markers (CMBR18, CMBR22, CMBR23, CMBR48, CMBR56, CMBR82) produced PCR products with sample DNA from all seven species. These sequences were compared with DNA sequences deposited at Genbank [30] and marker CMBR48 showed very significant homology with chloroplastic 16S ribosomal RNA gene sequences. This could explain the high level of transferability of this marker and, as expected, DNA polymorphism was not detected at this marker locus on melon accessions and other cucurbit species. On the other hand, three of the microsatellite markers detected in all six cucurbit species (CMBR18, CMBR56 and CMBR23) showed polymorphism between Cucumis melo accessions. The nature of these marker loci is not known at this point. The data indicates, however, that a larger and more diverse sample of each cucurbit species should be considered for microsatellite polymorphism analysis and marker transferability.
Genetic diversity analysis with microsatellite markers
A set of 25 microsatellite markers (Table 2) was selected at random to perform a diversity study of 40 accessions of melon. Without exception, the PCR products for the new markers had the expected fragment size when tested on DNA from accession AF 686. Allele number per locus varied from two (CMBR107, CMBR44, CMBR5, CMBR71) to six (CMBR20 and CMBR39). Expected heterozygosity varied from 0.45 (CMBR100) to 0.70 (CMBR25) (Table 2). The mean expected heterozygosity for these selected microsatellite markers was 0.52. Observations with six microsatellite markers [15] reported the number of alleles per locus varying from 3–5 and observed heterozygosity ranging from 0.49 to 0.75 (mean 0.61). Another study with 38 microsatellite markers detected 2–6 alleles per locus and observed heterozygosity ranging from 0.26–0.79 [16]. The number of alleles and observed heterozygosity estimated here are smaller than expected for an allogamous species such as melon. This is obviously related to the genetic relationships of the melon samples chosen for the study. Rather than selecting a very diverse germplasm for the analysis, a sample composed mostly of Valenciano accessions collected throughout Brazil, representing the commercial varieties planted in the country, predominated in the study. This sample represents, therefore, a small subset of the melon genetic pool, which could certainly explain the relatively lower than expected heterozygosity estimates. It should also be noted that endogamy depression is not significant in the cucurbit family [1,31-33]. Populations in cucurbits are generally derived from seeds obtained from one or few fruits in small populations, not only at farms but also in the wild, favoring endogamy [34].
Table 2.
Allele frequency database, expected heterozigosity (He), observed heterozygosity (Ho) and polymorphic information content (PIC) estimates for a random set of 25 microsatellite markers analyzed with a sample of 40 C. melo accessions.
| Locus | Allele (bp) | Frequency | He | Ho | PIC | Locus | Allele (bp) | Frequency | He | Ho | PIC |
| CMBR1 | 140 | 0.03 | 0.53 | 0.27 | 0.47 | CMBR33 | 180 | 0.15 | 0.65 | 0.22 | 0.57 |
| 150 | 0.20 | 150 | 0.03 | ||||||||
| 160 | 0.12 | 160 | 0.39 | ||||||||
| 130 | 0.65 | CMBR39 | 150 | 0.03 | 0.60 | 0.00 | 0.52 | ||||
| CMBR100 | 110 | 0.10 | 0.45 | 0.10 | 0.42 | 160 | 0.03 | ||||
| 130 | 0.05 | 190 | 0.03 | ||||||||
| 140 | 0.13 | 170 | 0.49 | ||||||||
| 120 | 0.73 | 165 | 0.03 | ||||||||
| CMBR107 | 170 | 0.53 | 0.51 | 0.18 | 0.37 | 180 | 0.41 | ||||
| 180 | 0.47 | CMBR42 | 110 | 0.11 | 0.44 | 0.00 | 0.40 | ||||
| CMBR108 | 160 | 0.03 | 0.30 | 0.06 | 0.28 | 150 | 0.14 | ||||
| 200 | 0.03 | 160 | 0.73 | ||||||||
| 170 | 0.11 | 100 | 0.03 | ||||||||
| 180 | 0.83 | CMBR43 | 230 | 0.08 | 0.68 | 0.22 | 0.65 | ||||
| CMBR14 | 130 | 0.39 | 0.53 | 0.39 | 0.42 | 280 | 0.03 | ||||
| 140 | 0.04 | 240 | 0.25 | ||||||||
| 150 | 0.57 | 290 | 0.15 | ||||||||
| CMBR18 | 160 | 0.03 | 0.33 | 0.06 | 0.29 | 250 | 0.49 | ||||
| 170 | 0.17 | CMBR44 | 100 | 0.35 | 0.46 | 0.13 | 0.35 | ||||
| 150 | 0.81 | 110 | 0.65 | ||||||||
| CMBR19 | 180 | 0.05 | 0.48 | 0.08 | 0.44 | CMBR5 | 170 | 0.58 | 0.49 | 0.40 | 0.37 |
| 150 | 0.01 | 180 | 0.43 | ||||||||
| 160 | 0.05 | CMBR56 | 180 | 0.01 | 0.36 | 0.08 | 0.31 | ||||
| 110 | 0.18 | 210 | 0.03 | ||||||||
| 170 | 0.70 | 170 | 0.18 | ||||||||
| CMBR20 | 150 | 0.08 | 0.50 | 0.05 | 0.46 | 150 | 0.78 | ||||
| 180 | 0.01 | CMBR64 | 130 | 0.05 | 0.53 | 0.06 | 0.48 | ||||
| 140 | 0.01 | 140 | 0.16 | ||||||||
| 110 | 0.15 | 150 | 0.13 | ||||||||
| 160 | 0.69 | 160 | 0.66 | ||||||||
| 170 | 0.05 | CMBR7 | 90 | 0.10 | 0.54 | 0.46 | 0.49 | ||||
| CMBR22 | 170 | 0.23 | 0.59 | 0.15 | 0.52 | 80 | 0.06 | ||||
| 160 | 0.04 | 100 | 0.19 | ||||||||
| 150 | 0.14 | 110 | 0.64 | ||||||||
| 180 | 0.59 | CMBR70 | 200 | 0.15 | 0.46 | 0.00 | 0.41 | ||||
| CMBR24 | 160 | 0.23 | 0.55 | 0.11 | 0.49 | 150 | 0.10 | ||||
| 140 | 0.03 | 190 | 0.03 | ||||||||
| 170 | 0.12 | CMBR71 | 100 | 0.65 | 0.46 | 0.05 | 0.35 | ||||
| 180 | 0.62 | 110 | 0.35 | ||||||||
| CMBR25 | 150 | 0.12 | 0.70 | 0.08 | 0.63 | CMBR73 | 110 | 0.19 | 0.61 | 0.50 | 0.53 |
| 160 | 0.13 | 100 | 0.28 | ||||||||
| 170 | 0.39 | 120 | 0.54 | ||||||||
| 180 | 0.36 | CMBR89 | 120 | 0.06 | 0.63 | 0.00 | 0.56 | ||||
| CMBR27 | 240 | 0.01 | 0.55 | 0.40 | 0.45 | 130 | 0.51 | ||||
| 260 | 0.05 | 150 | 0.11 | ||||||||
| 250 | 0.38 | 140 | 0.31 | ||||||||
| 270 | 0.56 |
Polymorphism Information Content (PIC) was estimated for the 25 markers (Table 2), with values ranging from 0.28 (CMBR100) to 0.65 (CMBR43). A group of these markers could certainly be selected for DNA fingerprinting purposes, including applications such as for identity tests, analysis of seed contamination in commercial seed production and variety protection. Based on the estimates of PIC and He (expected heterozygosity), ten of such markers were chosen and studied on 40 melon accessions (markers CMBR7, CMBR22, CMBR24, CMBR25, CMBR27, CMBR33, CMBR39, CMBR43, CMBR73, CMBR89). The probability of identical genotypes was estimated as 2.0 × 10⁻⁷, based on the allelic frequency database constructed (Table 2). This suggests that DNA profiles based on a panel of selected microsatellite markers could be efficiently used to differentiate melon individuals and accessions.
Genetic distance estimates between the melon accessions
DNA polymorphism detected by 25 microsatellite markers allowed genetic distance estimates and clustering of the accessions into two major groups (Figure 2). The first group (Group 1) included mainly inodorus and cantaloupensis/reticulatus cultivated accessions, which clustered with melon accessions that seem to be derived from crosses between these two types. These accessions were classified as "intermediate" since they show morphological traits peculiar to both types. When morphological information was not available, the accession was classified as an "unknown" type. The second group (Group 2) included a conomon accession, one cantaloupensis accession (W6) and also "intermediate" type accessions (Figure 2). A separation of cultivated melon types, such as inodorus and cantaloupensis/reticulatus, from non-cultivated types, such as conomon, was also observed in other melon studies based on DNA polymorphism [20,16]. Here, it was observed that in the group composed mostly of cultivated types (Group 1), the cantaloupensis/reticulatus accessions (CNPH 85205, CNPH 84201, CNPH 00884, CNPH 00885, CNPH 00853, CNPH 83062, CNPH 83102) can be easily separated from the inodorus accessions (Figure 2). Differentiation of some cultivated accessions into cantaloupensis and reticulatus groups is not always detected by DNA polymorphism analysis [20,16]. On the other hand, separation of climacteric accessions (cantaloupensis and reticulatus) from non-climacteric (inodorus) is usually consistent in studies based on different types of molecular markers [35]. Together these data seems to support the classification of cultivated melon in only two types, inodorus and cantaloupensis, as already proposed [1]. Discrepancies between morphological classification and clustering based on DNA polymorphism could reflect recent genetic breeding, which probably combined germplasm of different origins [20,16]. A very obvious example is the classification of Galia varieties (cantaloupensis), clustering in different subgroups. Most pedigrees of Galia varieties report parents classified in different melon types, both in breeding programs of the public and private sectors.
Figure 2.
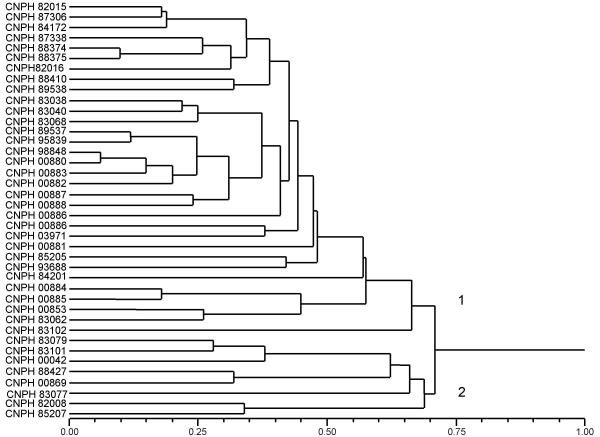
Dendrogram resulting from microsatellite based genetic distance analysis of 40 accessions of melon (C. melo), estimated by shared allele distance in pairwise comparisons. Cluster analysis used the neighbor joining method.
The majority of the melon accessions included in this study was previously classified as inodorus (Table 1). Exceptions are CNPH 00884, CNPH 00885, CNPH 83102 and CNPH 84201 (cantaloupensis), seven other accessions that seem to be derived from germplasm combinations of two or more melon types and three accessions for which morphological data was not available (CNPH 88498, CNPH 89538 and CNPH 93688). Although there is no information about botanical types of CNPH 89538 and CNPH 93688, it seemed very clear from the microsatellite marker analysis that they could be classified as inodorus.
Table 1.
Melon accessions used on microsatellite and RAPD based genetic distance analysis
| Germplasm Bank Number | Common Name | Country | Type | Marker Analysis |
| CNPH 82015 | Amarelo | Brazil | inodorus | RAPD/microsatellite |
| CNPH 83038 | Valência | USA | inodorus | RAPD/microsatellite |
| CNPH 83040 | Napoletano | - | inodorus | RAPD/microsatellite |
| CNPH 83068 | Progênie Valência | Brazil | inodorus | RAPD/microsatellite |
| CNPH 83077 | USDA 164320 | Índia | intermediate * | RAPD/microsatellite |
| CNPH 83079 | USDA 255478 | Korea | intermediate | RAPD/microsatellite |
| CNPH 83101 | Golden Charm | USA | intermediate | RAPD/microsatellite |
| CNPH 83102 | Farmies Yellow | USA | cantaloupensis | RAPD/microsatellite |
| CNPH 84172 | Valenciano | Spain | inodorus | RAPD/microsatellite |
| CNPH 84201 | B633.3 | France | cantaloupensis | RAPD/microsatellite |
| CNPH 87306 | Amarelo | Brazil | inodorus | RAPD/microsatellite |
| CNPH 87338 | Eldorado 300 | Brazil | inodorus | RAPD/microsatellite |
| CNPH 88374 | Valenciano Verde Redondo | Brazil | inodorus | RAPD/microsatellite |
| CNPH 88375 | Valenciano Verde Elíptico | Brazil | inodorus | RAPD/microsatellite |
| CNPH 88410 | Progênie Valência | Brazil | inodorus | RAPD/microsatellite |
| CNPH 88427 | Elizabeth 239 | Japan | intermediate | RAPD/microsatellite |
| CNPH 89538 | CNPH 89538 | Brazil | unknown** | RAPD/microsatellite |
| CNPH 88498 | Hoon | Portugal | unknown | RAPD/microsatellite |
| CNPH 89537 | Panaú Amarelo | Brazil | inodorus | RAPD/microsatellite |
| CNPH 95839 | Amarelo | Brazil | inodorus | RAPD/microsatellite |
| CNPH 98848 | Amarelo Polpa Branca | USA | inodorus | RAPD/microsatellite |
| CNPH 00880 | AF 682 | Brazil | inodorus | RAPD/microsatellite |
| CNPH 00881 | AF 646 | Brazil | inodorus | RAPD/microsatellite |
| CNPH 00882 | Rochedo | Brazil | inodorus | RAPD/microsatellite |
| CNPH 00883 | Gold Mine | Brazil | inodorus | RAPD/microsatellite |
| CNPH 00884 | Hi-Mark | Brazil | cantaloupensis | RAPD/microsatellite |
| CNPH 00885 | Mission | Brazil | cantaloupensis | RAPD/microsatellite |
| CNPH 00886 | Yellow King | Brazil | inodorus | RAPD/microsatellite |
| CNPH 00887 | Yellow Queen | Brazil | inodorus | RAPD/microsatellite |
| CNPH 00883 | Gold Pride | Brazil | inodorus | RAPD/microsatellite |
| CNPH 03971 | Galileo | Brazil | cantaloupensis | microsatellite |
| CNPH 00042 | Conomon | USA | conomon | microsatellite |
| CNPH 82016 | Hales Best Jumbo | - | intermediate | microsatellite |
| CNPH 85205 | Early Down Rockmelon | Australia | cantaloupensis | microsatellite |
| CNPH 93688 | CNPH 93-688 | - | unknown | microsatellite |
| CNPH 00853 | Gália F1 | Brazil | cantaloupensis | microsatellite |
| CNPH 83062 | WMR-29 | USA | intermediate | microsatellite |
| CNPH 00869 | Elizabeth PMR | Japan | intermediate | microsatellite |
| CNPH 82008 | W6 | USA | cantaloupensis | microsatellite |
| CNPH 85207 | Rockmelon Gulf Coast H91/L1 | Australia | intermediate | microsatellite |
* accession presenting characteristics of both types, inodorus and cantaloupensis ** morphological information not available
Thirty of the 40 melon accessions analyzed with SSR markers were also evaluated with RAPD markers (Figure 3). A -0.70 correlation coefficient was estimated between matrices generated by microsatellite (Figure 4) and RAPD (Figure 5) markers using the Mantel Test (t = - 5.0, P = 0.01). Correlations between matrices generated by RAPD and microsatellite markers on other species such as soybean, Elymus and wheat were very similar to the values obtained here [36-38]. RAPD analysis also splits the melon accessions into two major groups, one comprising inodorus and cantaloupensis/reticulatus melons and the other formed by accessions CNPH 83077, CNPH 83079 and CNPH 83101, which clustered with the conomon accession (CNPH 00042) in the previous SSR analysis. The accessions CNPH 89538 and CNPH 93688, for which no morphological information was available, were also classified as inodorus based on the RAPD marker analysis.
Figure 3.
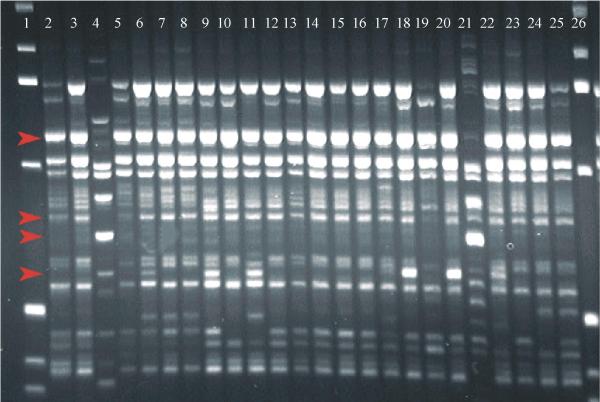
RAPD amplification products submitted to agarose gel electrophoresis and visualized by ethidium bromide staining under UV light. From left to right: Lanes 1 and 26: ladder 1 Kb; Lanes 2 to 27: melon accessions in the order of appearance on Table 1. Arrows indicate polymorphic markers used for analysis.
Figure 4.
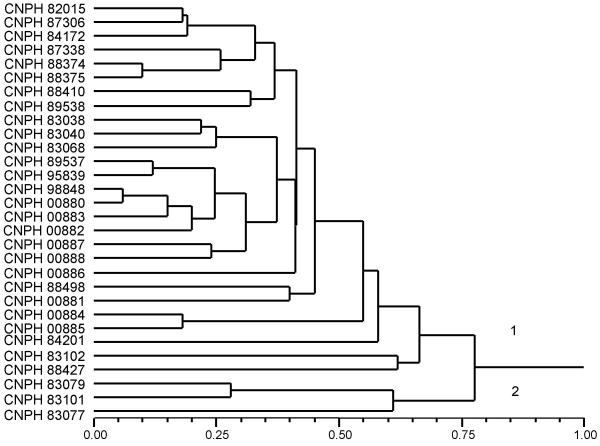
Dendrogram resulting from microsatellite based genetic distance analysis of 30 accessions of melon (C. melo), estimated by shared allele distance in pairwise comparisons. Cluster analysis used the neighbor joining method.
Figure 5.
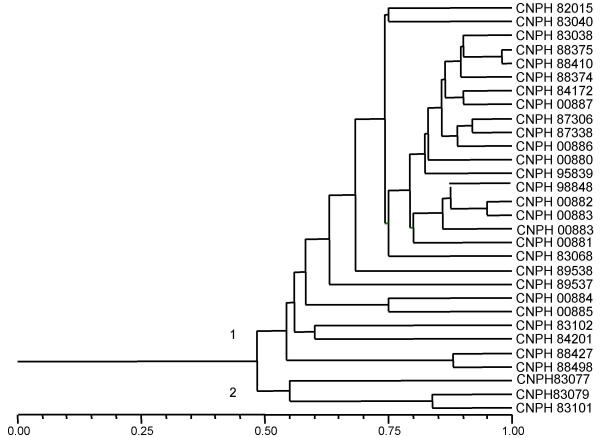
Dendrogram resulting from RAPD based genetic distance analysis of 30 accessions of melon (C. melo), estimated with the DICE genetic similarity coefficient. Cluster analysis was performed using the UPGMA algorithm.
Linkage analysis of microsatellite marker loci
An F2 progeny of 93 individuals derived from a cross between the lines CNPH 82015 and CNPH 84201 was used for linkage analysis of 55 microsatellite markers. Most primers showed segregation according to Mendelian expectations (Figure 6). Only 5% of the primers (CMBR53, CMBR70 and CMBR147) presented segregation distortion (p < 0.001). Distortion can be caused by male and/or female gamete abortion, selective fertilization of specific gametic genotypes or abortion of zygotes and embryos during development [39]. In all three loci that showed distortion, the F2 genotypes were not distributed according to Hardy-Weinberg Equilibrium proportions, indicating that the nature of distortion is zygotic. The three loci are not linked, though, suggesting that if the distortion observed has a genetic basis, it is not caused by just one deleterious locus in the genome. It should be remarked that some level of distortion is usually expected in intraspecific crossings [40], and especially in interspecific crosses [39]. Possible causes of zygotic distortion include the deleterious effect of reproduction related genes that map in the genome region where the marker locus is located. Since in the three loci the genotype in excess was always heterozygote, hybrid vigor could potentially explain the observed zygotic distortion, such as observed in alfalfa [41] and potato [42].
Figure 6.
Segregation pattern of marker BRC83 based on polyacrylamide gel electrophoresis of PCR products using an F2 population derived from the cross between accessions CNPH 82015 and CNPH 84201. Lanes 1 and 26: 1 Kb marker; Lanes 2–4: CNPH 82015, CNPH 84201 and F1 hybrid; lanes 5–25: sample of the F2 population.
Linkage analysis of microsatellite marker loci of C. melo detected linkage associations (Figure 7). Thirty-one microsatellite markers covering 583.6 cM were assembled into nine linkage groups. Although preliminary, genome coverage represents approximately 50% of the expected genome size (cM) of melon [23]. Twenty-four microsatellite markers did not show significant linkage disequilibrium with any of the markers tested. The data indicates that the microsatellite markers analyzed are distributed throughout the genome of C. melo. New markers from the Tsp-AG/TC genomic library are currently being tested in the segregating population aiming for the construction of a saturated genetic map based on microsatellite markers.
Figure 7.

Partial microsatellite linkage map of C. melo. Fifty-five microsatellite markers were tested for linkage and thirty-one were assembled into nine linkage groups, which covered 583.6 cM of the melon genome. Map distances in cM are indicated on the left side of linkage groups and locus names are on the right. Underlined markers along linkage groups show segregation distortion
Conclusions
Genomic library microsatellite enrichment is an efficient procedure for marker development in melon. One hundred and forty-four new markers were developed from Tsp-AG/TC genomic library. This is the first reported attempt of successfully using enriched libraries for microsatellite marker development in the species. A sample of the microsatellite markers tested proved efficient for genetic analysis of melon, including genetic distance estimates and potential identity tests. Linkage analysis indicates that the markers developed are dispersed throughout the melon genome and are suitable for mapping purposes. The level of polymorphism observed at marker loci and genome coverage observed so far suggest that the microsatellite markers developed should be very useful for genetic analysis of melon.
Methods
Development of genomic library enriched for hypervariable sequences
Genomic DNA was extracted from fresh leaves of seedlings of the melon commercial hybrid AF 686 (Sakata Seed Company, Brazil) using the CTAB method [43] with some modifications [10]. Enzymatic DNA digestions with Tsp 509 I, Sau III and Mse I were performed in order to select the enzyme yielding the greatest amount of fragments in the range of 300 to 800 bp. The Tsp 509 I and Mse I fragment profiles were selected and the digestion products separated in 3.5% agarose gel [44,45]. Fragments between 300 and 800 bp were recovered in DEAE-cellulose NA-45 membrane [13]. These selected fragments were precipitated in saline solution and linked to adaptors containing complementary sequences to the enzyme restriction site. The enrichment of the library with microsatellite sequences was performed through ligation of fragments to biotinilated oligonucleotides. The biotinilated fragments were then hybrized with (AG)13 probes to develop the genomic library based on Tsp 509 I derived fragments selected with probes (AG)13. Fragments potentially containing microsatellite sequences were recovered with magnetic beads [13]. Enrichment control was performed through PCR using primers complementary to the target site of the restriction enzyme. Southern Blot confirmed preferential recovery of fragments containing microsatellite regions. Fragments containing microsatellite sequences were cloned on pGEMT™ plasmids and used to transform XL1Blue E. coli cells (Promega, Madison, WI) through thermic shock [45], resulting in melon genomic library Tsp-AG/TC.
Selection and identification of positive clones
Clones of the genomic library containing microsatellite insertions were identified by Southern hybridization [46]. Positive clones were selected by orientation, size and position inside the plasmid insert using the anchored-PCR approach [13]. Plasmid DNA of selected clones was extracted and prepared for sequencing.
DNA sequencing and primer design
Sequencing reactions were performed with "Dye-Terminator" and "Big-Dye" kits (Applied Biosystems, Foster City, CA) using an Applied Biosystems 377 DNA sequencer. Specific primer pairs, unique and complementary to microsatellite flanking regions, were designed using the software PRIMER v.3.0 [46]. Primer designing considered restrictive parameters for primer auto-annealing, G+C content of ~50% and annealing temperature for PCR reactions in the 55–60°C range.
Characterization and transferability of newly developed microsatellite markers
Primer pairs were synthesized and tested on three melon accessions (CNPH 82015, CNPH 84201 and CNPH 83102). The expected size of fragments resulting from amplification was observed on 3.5% agarose gel and, whenever necessary, adjustments on annealing temperature were performed. Sixty-seven out of 144 primer pairs were immediately selected for genetic tests since their PCR conditions did not require further adjustments. The sixty-seven markers were tested on a panel of 11 varieties of six cucurbit species (C. melo, Citrullus lanatus, Cucurbita maxima, C. moschata, C. pepo and Cucumis sativus), which included five accessions of melon. Sixty-five markers detected DNA polymorphism between the five melon accessions analyzed (Figure 1). The experiment was also repeated in polyacrylamide gel electrophoresis (PAGE) followed by silver nitrate staining, confirming the agarose results. PCR and electrophoresis conditions were the same as described below.
Microsatellite marker data analysis
Forty melon accessions (Table 1) were selected for genetic analysis using a random sample of 25 microsatellite markers extracted from the new microsatellite marker set (Table 2). One individual per accession was used in the analysis. The melon accessions used were mostly commercial Valenciano varieties planted in different areas of Brazil. This sample includes most of the commercial varieties planted in the country. For marker genotyping, young leaves of the 40 melon accessions were used for DNA extraction [10]. Microsatellite loci were genotyped using 13 μl PCR reactions containing DMSO 5%, dNTP 0.25 mM, primer pair 0.3 μM, Tris HCl 10 mM (pH 9.0), MgCl2 1.5 mM, Taq-polymerase 1 U plus 7.5 ng of DNA template. Thermic variation cycles were 94°C for 4 min, 30 cycles of 94°C for 1 min, 50–58°C (depending on the primer) for 1 min, 72°C for 1 min and an extension final step of 72°C for 7 min. PCR was performed on a MJ Research thermocycler PTC 100. Amplification products were submitted to polyacrylamide gel containing polyacrylamide 4% and urea 7 M in TBE 1X on a GIBCO/BRL S42 model electrophoresis apparatus (Promega, Madison, WI). Gel dimensions were 20 cm × 34 cm × 0.4 mm. Electrophoresis was performed at 45-watt constant power and band visualization obtained by silver nitrate staining [48]. Alleles at marker loci were detected in base pairs. All analyzed microsatellite loci contained dinucleotide repetitive sequences. In addition to the ladder of known fragment sizes used to size alleles, the most frequent allele of a locus was used as a reference to adjust fragment size of the other alleles in the same locus.
Allele frequencies across loci were estimated using the software GDA-Genetic Data Analysis [49]. An allele frequency database for the 25 microsatellite loci genotyped on 40 varieties of melon was then constructed. Observed (Ho) and expected (He) heterozygosities as well as genetic parameters such as the size range and number of alleles per locus were estimated for each microsatellite locus (additional file 1) using the GDA software [49]. The percentage of observed heterozygosity was calculated as the ratio between heterozygote individual genotypes and the total number of analyzed genotypes for each locus. Expected heterozygosity was estimated based on the probability that two individuals taken at random from a given sample would have different alleles at a locus [50]. The arithmetic mean of the expected heterozygosity of multiple loci is defined as Hav = Hn / n where n is the total number of loci. The Polymorphism Information Content (PIC) was also estimated as the probability that an individual is informative with respect to the segregation of its inherited alleles [51].
A set of 10 new microsatellite loci (CMBR7, CMBR22, CMBR24, CMBR25, CMBR27, CMBR33, CMBR39, CMBR43, CMBR73, CMBR89) was selected to estimate the potential of these markers for line identification and variety protection in melon. The probability of identical genotypes [52], defined as PI = ∑ pi4 + ∑(2pipj)2 was estimated for the selected loci individually, and later, for all 10 loci as a whole.
Genetic distance analysis with microsatellite markers
Genetic distance estimates between the 40 melon accessions were performed with microsatellite and RAPD markers. One individual per accession was used on genotyping experiments. Microsatellite genotyping followed the procedures described above. RAPD genotyping was based on data from an initial screening of eighty oligonucleotide primers (Operon Technologies, USA) tested on three melon accessions (CNPH 82015, CNPH 83038, CNPH 83040). Thirty-five oligonucleotide primers were selected. Primer sequences are available upon request. DNA amplifications were performed by PCR in 13 μl reaction volume containing 1.04 μg/μl purified BSA, 0.20 mM each dNTP, 0.5 μM primer, 10 mM Tris HCl (pH 9,0), 1.5 mM MgCl2, 50 mM KCl, 1 U Taq-polymerase and 7.5 ng of extracted melon DNA [10]. Amplification conditions were 40 cycles of 94°C for 1 min, 35°C for 1 min, 35°C for 1 min, 72°C for 2 min and an extension final step of 72°C for 5 min. Amplification products were separated on horizontal 1.5% agarose gel stained with ethidium bromide. Electrophoresis was performed at 100 volts constant power during 4–5 hours [10].
Genetic distances among melon accessions based on microsatellite marker polymorphism were estimated by shared allele distance in pairwise comparisons. The estimates are based on the sum of the proportion of common alleles between two melon accessions examined across loci (PS) divided by twice the number of tested loci [53,54]. Genetic distances were obtained by the parameter [-ln (PS)] using the Genetic Distance Calculator [55]. The diagonal matrix was then submitted to cluster analysis using the neighbor joining method and a genetic distance dendrogram built using the software NTSYS 2.02 g [56]. RAPD marker polymorphism was used to calculate pairwise distances among melon accessions with the DICE genetic similarity coefficient [57]. Cluster analysis was performed using the UPGMA method (NTSYS software) [56,58]. The correspondence between distance and similarity matrices based on microsatellite and RAPD markers was evaluated through the correlation coefficient estimated by the MXCOMP procedure of NTSYS software [56]. The program plots one matrix against the other, element by element, ignoring diagonal values and estimating the product moment correlation (r) between two matrices. Statistical significance was declared based on a t-test, comparing the observed Z value with its permutational distribution [56,59].
Linkage mapping analysis
An F2 progeny of 93 individuals derived from a cross between the lines CNPH 82015 and CNPH 84201 was used for linkage analysis of 55 microsatellite markers reported here (additional file 1). Deviations from the expected Mendelian segregation ratios were calculated based on chi-square contingency tables. Marker loci eventually showing segregation distortion were further analyzed for the nature of distortion, if gametic or zygotic, based on two additional chi-square conditional [39]: (a) one testing the hypothesis p=q by the formula Chi-square (GL = 1) = [(2np - n)2 + (2nq - n)2]/n [where p (A) = (AA + AB/2)/n and q (B) = (BB + AB/2)/n and n = total number of individuals] and (b) a second testing if genotypes are distributed as expected frequencies by Hardy-Weinberg equilibrium: Chi-square = + [(AB - 2npq)2]/ 2npq + [(BB - nq2)2]/ nq2. The relationships of these two tests allows for the classification of distortion as gametic or zygotic [39]. Linkage analysis was performed using the program Mapmaker v 2.0 [60]. Only markers with 81 or more scored F2 individuals were considered for analysis. A minimum LOD score of 4.0 and a maximum recombination frequency of 0.35 were used to group the microsatellite markers into potential linkage groups. Three-point and multipoint analyses were performed to find the most probable locus order within eventual linkage groups observed. The final locus order of each linkage group was tested by removing one locus at a time and checking for inconsistencies. Double crossover events were examined, and the original scores re-checked before a final linkage group order was assigned. Recombination frequencies were corrected based on Haldane's map distance function as executed by Mapmaker.
Authors' contributions
PSR developed the microsatellite markers, the segregation population, carried out microsatellite analysis and drafted the manuscript. TCLL and RLT carried out the RAPD study and GSCB participated in RAPD data analysis and development of microsatellite markers. JAB helped on interpretation of RAPD and SSR diversity analysis data. MEF conceived the study, participated in its design and coordination, checked the data and reviewed the manuscript. All authors read and approved the final manuscript.
Supplementary Material
Repeat number and type, primer sequence, annealing temperature and expected fragment size of 144 new melon microsatellite markers. This table describes the repeat number and type, primer sequence, annealing temperature and expected fragment size of 144 new microsatellite markers developed from a Tsp AG/TC enriched genomic library.
Acknowledgments
Acknowledgements
This research is part of PhD thesis of Patricia Silva Ritschel and was partially supported by Avança Brasil and Prodetab (number 030-02/01) projects.
Contributor Information
Patricia Silva Ritschel, Email: patricia@cnph.embrapa.br.
Tulio Cesar de Lima Lins, Email: tuliocesar@ambr.com.br.
Rodrigo Lourenço Tristan, Email: tristan@lge.ibi.unicamp.br.
Gláucia Salles Cortopassi Buso, Email: buso@cenargen.embrapa.br.
José Amauri Buso, Email: jose.buso@embrapa.br.
Márcio Elias Ferreira, Email: ferreira@cenargen.embrapa.br.
References
- Robinson RW, Decker-Walters DS. Cucurbits. New York: CAB International; 1997. [Google Scholar]
- Whitaker TW, Davis GN. Cucurbits: botany, cultivation and utilization. New York: Interscience Publications; 1962. [Google Scholar]
- Munger HM, Robinson RW. Nomenclature of Cucumis melo L. Cucurbit Genetics Cooperation Reports. 1991;14:43–44. [Google Scholar]
- Pitrat M, Hanelt K, Hammer K. Some comments on intraspecific classification of cultivars of melon. Acta Horticulturae. 2000;510:29–36. [Google Scholar]
- Pedrosa JF. Fitotecnia da cultura do melão. Petrolina-PE: Embrapa-Semi-Árido, Brazil; 1999. [Google Scholar]
- Araújo JLP. Mercado de melão na Europa http://www.cpatsa.embrapa.Br/artigos/melaonaeuropa.html
- PROFRUTAS . Ações Básicas para o Desenvolvimento da Agricultura Irrigada no Rio Grande do Norte. Mossoró-RN, Brazil; 1996. [Google Scholar]
- Dias R, de CS. A Cadeia Produtiva do Melão na Região Nordeste. Petrolina-PE: Embrapa Semi-Árido, Brazil; 1997. [Google Scholar]
- Gomes RS. Unexpected Growth and Unintended Spillover: The Making of the Melon Industry in Mossoró-Assú, Northeast Brazil. Massachusetts: Massachusetts Institute of Technology, USA; 1999. [Google Scholar]
- Ferreira ME, Grattapaglia D. Introdução ao uso de marcadores moleculares em análise genética. Brasília-DF: Embrapa Recursos Genéticos e Biotecnologia, Brazil; 1998. [Google Scholar]
- Litt M, Luty JA. A hypervariable microsatellite revealed by in vitro amplification of a dinucleotide repeat within the cardiac muscle actin gene. Am J Hum Genet. 1989;44:397–401. [PMC free article] [PubMed] [Google Scholar]
- Weber JL, May P. Abundant class of human DNA polymorphisms which can be typed using the polymerase chain reaction. Am J Hum Gene. 1989;44:388–396. [PMC free article] [PubMed] [Google Scholar]
- Rafalski JA, Vogel JM, Morgante M, Powell W, Andre C, Tingey SV. Generating and using DNA markers in plants. In: New York: Academic Press Inc, editor. In Nonmammalian Genomic Analysis: A practical guide. 1. Birren B, Lai E; 1996. pp. 73–134. [Google Scholar]
- Kandpal RP, Kandpal G, Weissman SM. Construction of libraries enriched for sequence repeats and jumping clones and hybridization selection for region-specific markers. Proc Natl Acad Sci USA. 1994;91:88–92. doi: 10.1073/pnas.91.1.88. [DOI] [PMC free article] [PubMed] [Google Scholar]
- Katzir N, Danin-Poleg Y, Tzuri G, Karchi Z, Lavi U, Cregan PB. Length polymorphism and homologies of microsatellites in several Cucurbitaceae species. Theor Appl Genet. 1996;93:1282–1290. doi: 10.1007/s001220050367. [DOI] [PubMed] [Google Scholar]
- Danin-Poleg Y, Reis N, Tzuri G, Katzir N. Development and characterization of microsatellite markers in Cucumis. Theor Appl Genet. 2001;102:61–72. doi: 10.1007/s001220051618. [DOI] [Google Scholar]
- Neuhausen SL. Evaluation of restriction fragment length polymorphism in Cucumis melo. Theor Appl Genet. 1992;83:379–384. doi: 10.1007/BF00224286. [DOI] [PubMed] [Google Scholar]
- Garcia E, Jamilena M, Alvarez JI., Arnedo T, Oliver JL, Lozano R. Genetic relationships among melon breeding lines revealed by DNA markers and agronomic traits. Theor Appl Genet. 1998;96:878–885. doi: 10.1007/s001220050815. [DOI] [Google Scholar]
- Staub JE, Danin-Poleg Y, Fazio G, Horejsi T, Reis N, Katzir N. Comparative analysis of cultivated melon groups (Cucumis melo L.) using random amplified polymorphic DNA and simple sequence repeat markers. Euphytica. 2000;115:225–241. doi: 10.1023/A:1004054014174. [DOI] [Google Scholar]
- Staub JE, Meglic V, McCreight JD. Inheritance and linkage relationships of melon (Cucumis melo L.) isoenzymes. J Am Soc Hortic Sci. 1998;123:264–272. [Google Scholar]
- Baudracco-Arnas S, Pitrat M. A genetic map of melon (Cucumis melo L.) with RFLP, RAPD, isozyme, disease resistance and morphological markers. Theor Appl Genet. 1996;93:57–64. doi: 10.1007/s001220050247. [DOI] [PubMed] [Google Scholar]
- Wang YH, Thomas CE, Dean RA. A genetic map of melon (Cucumis melo L) based on amplified fragment length polymorphism (AFLP) markers. Theor Appl Genet. 1997;95:791–797. doi: 10.1007/s001220050627. [DOI] [Google Scholar]
- Oliver M, Garcia-Mas J, Cardús M, Pueyo N, López-Sesé AI, Arroyo M, Gómez-Paniagua H, Arús P, de Vicente MC. Construction of a reference linkage map of melon. Genome. 2001;44:836–845. doi: 10.1139/gen-44-5-836. [DOI] [PubMed] [Google Scholar]
- Périn C, Hagen LS, Giovinazzo N, Besombess D, Dogimont C, Pitrat M. Genetic control of fruit shape acts prior to anthesis in melon (Cucumis melo L) Molecular Genetics and Genomics. 2002;266:933–941. doi: 10.1007/s00438-001-0612-y. [DOI] [PubMed] [Google Scholar]
- Danin-Poleg Y, Reis N, Baudracco-Arnas S, Pitrat M, Staub JE, Oliver M, Arus P, deVicente CM, Katzir N. Simple Sequence repeats in Cucumis mapping and map merging. Genome. 2000;43:963–974. doi: 10.1139/gen-43-6-963. [DOI] [PubMed] [Google Scholar]
- Danin-Poleg Y, Tadmor Y, Tzuri G, Reis N, Hirschberg J, Katzir N. Construction of a genetic map of melon with molecular markers and horticultural traits, and localization of genes associated with ZYMV resistance. Euphytica. 2002;125:373–384. doi: 10.1023/A:1016021926815. [DOI] [Google Scholar]
- Périn C, Hagen LS, De Conto V, Katzir N, Danin-Poleg Y, Portnoy V, Baudracco-Arnas S, Chadoeuf J, Dogimont C, Pitrat M. A reference map of Cucumis melo based on two recombinant inbred line populations. Theor Appl Genet. 2002;104:1017–1034. doi: 10.1007/s00122-002-0864-x. [DOI] [PubMed] [Google Scholar]
- Silberstein L, Kovalski I, Brotman Y, Perin C, Dogimont C, Pitrat M, Klingler J, Thompson G, Portnoy V, Katzir N, Perl-Treves R. Linkage map of Cucumis melo including phenotypic traits and sequence-characterized genes. Genome. 2003;46:761–73. doi: 10.1139/g03-060. [DOI] [PubMed] [Google Scholar]
- Peakall R, Gilmore S, Keys W, Morgante M, Rafalski A. Cross-species amplification of soybean (Glycine max) simple sequence repeats (SSRs) within the genus and other legume genera: implications for the transferability of SSRs. Plants Mol Biol Evol. 1998;15:1275–87. doi: 10.1093/oxfordjournals.molbev.a025856. [DOI] [PubMed] [Google Scholar]
- National Center for Biotechnology Information http://www.ncbi.nlm.nih.gov
- Tatlioglu TP. Cucumber. In: Kaloo G, Bergh BO, editor. In Genetic Improvement of Vegetable Crops. 1. New York: Pergamon Press; 1992. pp. 197–234. [Google Scholar]
- McCreight JD, Nerson H, Grumet R. Melon. In: Kaloo G, Bergh BO, editor. In Genetic Improvement of Vegetable Crops. 1. New York: Pergamon Press; 1992. pp. 267–294. [Google Scholar]
- Fehét T. Watermelon. In: Kaloo G, Bergh BO, editor. In Genetic Improvement of Vegetable Crops. 1. New York: Pergamon Press; 1992. pp. 295–314. [Google Scholar]
- Allard RW. Princípios do melhoramento genético de plantas. Rio de Janeiro-RJ: USAID. 1971.
- Zheng XY, Wolff DW. Ethylene production, shelf-life and evidence of RFLP polymorphisms linked to ethylene genes in melon (Cucumis melo L.) Theor Appl Genet. 2000;101:613–624. doi: 10.1007/s001220051523. [DOI] [Google Scholar]
- Powell W, Morgante M, André C, Hanafey M, Vogel J, Tingey S, Rafalski A. The comparison of RFLP, RAPD, AFLP and SSR (microsatellite) markers for germplasm analysis. Molecular Breeding. 1996;2:225–228. [Google Scholar]
- Sun GL, Salomon B, von Bothmer R. Analysis of tetraploid Elymus species using wheat microsatellite markers and RAPD markers. Genome. 1997;40:806–841. doi: 10.1139/g97-804. [DOI] [PubMed] [Google Scholar]
- Guadagnuolo R, Bianchi DS, Felber F. Specific genetic markers for wheat, spelt, and tour wild relatives: comparisons of isozymes, RAPDs, and wheat microsatellites. Genome. 2001;44:610–621. doi: 10.1139/gen-44-4-610. [DOI] [PubMed] [Google Scholar]
- Lorieux M, Perrier X, Goffinet B, Lanaud C, González de León D. Maximum-likelihood models for mapping genetic markers showing segregation distortion. 2. F2 populations. Theor Appl Genet. 1995;90:81–89. doi: 10.1007/BF00220999. [DOI] [PubMed] [Google Scholar]
- Jenczewski E, Gherardi M, Bonnin I, Prosperi JM, Olivieri I, Huguet T. Insight on segregation distortions in two intraspecífic crosses between annual species of Medicago (Leguminosae) Theor Appl Genet. 1997;94:682–691. doi: 10.1007/s001220050466. [DOI] [Google Scholar]
- Diwan N, Bouton JH, Kochert G, Cregan PB. Mapping of simple sequence repeat (SSR) DNA markers in diploid and tetraploid alfafa. Theor Appl Genet. 2000;101:165–172. doi: 10.1007/s001220051465. [DOI] [Google Scholar]
- Bonierbale MW, Plaisted RL, Tanksley SD. RFLP maps based on common set of clones reveal modes of chromosomal evolutions in potato and tomato. Genetics. 1988;120:1095–1103. doi: 10.1093/genetics/120.4.1095. [DOI] [PMC free article] [PubMed] [Google Scholar]
- Murray M, Thompson WF. Rapid isolation of high-molecular weight plant DNA. Nucleic Acid Research. 1980;8:4321–4325. doi: 10.1093/nar/8.19.4321. [DOI] [PMC free article] [PubMed] [Google Scholar]
- Ritschel PS, Buso GSC, Buso JA, Ferreira ME. Development of hypervariable molecular markers for the melon genome [abstract] Congresso Nacional de Genética. 2001. p. 47.
- Ritschel PS, Buso GSC, Buso JA, Ferreira ME. Towards the development of microssatellite marker based genetic map of melon (Cucumis melo) [abstract] International Conference on the Status of Animal and microbe genomes. 2002;10:129. [Google Scholar]
- Sambrook J, Fritsch EF, Maniatis T. Molecular Cloning: a Laboratory Manual. New York: Cold spring Habor. 1989.
- PRIMER v.3.0 http://http\\www.genome.wi.mit.edu
- Bassam BJ, Caetano-Anollés G, Gressholf PM. Fast and sensitive silver staining in polyacrylamide gels. Analytical biochemistry. 1991;196:80–83. doi: 10.1016/0003-2697(91)90120-i. [DOI] [PubMed] [Google Scholar]
- Lewis PO, Zaykin D. Genetic Data Analysis: Computer program for the analysis of allelic data. Version 1.0 (d16c) http://lewis.eeb.uconn.edu/lewishome/software.htm
- Nei M. Molecular Evolutionary Genetics. New York: Columbia Univ Press. 1987.
- Botstein D, White RL, Skolnick M, Davis RW. Construction of a genetic linkage map in man using restriction fragment polymorphisms. Am J Hum Genet. 1980;32:314–331. [PMC free article] [PubMed] [Google Scholar]
- Sefc KM, Regner F, Turetschek E, Glössl J, Steinkellner H. Identification of microsatellite sequences in Vitis riparia and their applicability for genotyping of different Vitis species. Genome. 1999;42:367–373. doi: 10.1139/gen-42-3-367. [DOI] [PubMed] [Google Scholar]
- Bowcock AM, Ruiz-Linhares A, Tomfohrde J, Minch E, Kidd JR, Cavalli-Sforza LL. High resolution of human evolutionary trees with polymorphic microsatellites. Nature. 1994;368:455–457. doi: 10.1038/368455a0. [DOI] [PubMed] [Google Scholar]
- Goldstein DB, Ruiz Linares A, Cavalli-Sforza LL, Feldman MW. Genetic absolute dating based on microsatellite and the origin of modern humans. Proc Natl Acad Sci USA. 1995;92:6723–6727. doi: 10.1073/pnas.92.15.6723. [DOI] [PMC free article] [PubMed] [Google Scholar]
- Genetic Distance Calculator http://www2.biology.ualberta.ca/jbrzusto/sharedst.php
- Rohlf FJ. NTSYS-PC: numerical taxonomy and multivariate analysis system – version 1.7. New York: Exeter Software. 1992.
- Dice LR. Measures of the amount of ecologic association between species. Ecology. 1945;26:297–302. [Google Scholar]
- Sneath PHA, Sokal RP. Numerical taxonomy. San Francisco: WH Freeman and Company. 1973.
- Manly FJ. Multivariate Statistical Methods. London : Chapman & Hall. 1994.
- Lander EP, Green P, Abrahanson J, Barlow A, Daly MJ, Lincoln SE, Newburg L. MAPMAKER: An interative computer package for constructing primary genetic linkage maps with experimental and natural populations. Genomics. 1987;1:174–181. doi: 10.1016/0888-7543(87)90010-3. [DOI] [PubMed] [Google Scholar]
Associated Data
This section collects any data citations, data availability statements, or supplementary materials included in this article.
Supplementary Materials
Repeat number and type, primer sequence, annealing temperature and expected fragment size of 144 new melon microsatellite markers. This table describes the repeat number and type, primer sequence, annealing temperature and expected fragment size of 144 new microsatellite markers developed from a Tsp AG/TC enriched genomic library.