

Abstract
Purpose
The lipoate derivative CPI-613 is a first-in-class agent that targets mitochondrial metabolism. This study determined the effects of CPI-613 on mitochondrial function and defined the maximally tolerated dose (MTD), pharmacokinetics (PKs), and safety in patients with relapsed or refractory hematologic malignancies.
Experimental Design
Human leukemia cell lines were exposed to CPI-613 and mitochondrial function was assayed. A phase I trial was conducted in which CPI-613 was given as a 2-hour infusion on days 1 and 4 for 3 weeks every 28 days.
Results
CPI-613 inhibited mitochondrial respiration of human leukemia cells consistent with the proposed mechanism of action. In the phase I trial, 26 patients were enrolled. CPI-613 was well tolerated with no marrow suppression observed. When the infusion time was shortened to 1 hour renal failure occurred in 2 patients. At 3780 mg/m2, there were 2 dose-limiting toxicities (DLTs). At a dose of 2940 mg/m2 over 2 hours, no DLTs were observed, establishing this as the MTD. Renal failure occurred in a total of 4 patients and resolved in all but 1, who chose hospice care. CPI-613 has a triphasic elimination with an alpha half-life of ~1.34 hours. Of 21 evaluable, heavily pretreated, patients, 4 achieved an objective response and 2 achieved prolonged stabilization of disease for a clinical benefit rate of 29%. Following drug exposure, gene expression profiles of peripheral blood mononuclear cells from responders demonstrated immune activation.
Conclusion
CPI-613 inhibits mitochondrial function and demonstrates activity in a heavily pretreated cohort of patients.
Introduction
Cancer cells markedly alter the flow of carbon away from the complete oxidation and adenosine triphosphate (ATP) production towards glycolysis and anabolism (as reviewed by Vander Heiden et. al.(1)). This altered carbon metabolism was first described by Otto Warburg(2) and is now considered an emerging hallmark of cancer(3). Increased glycolysis and glucose uptake are widely used markers for PET imaging in oncology. Despite the nearly universal findings of altered metabolism in cancer, therapeutic targeting of metabolism, especially in hematologic malignancies, has been understudied.
Aerobic glycolysis utilized by cancer cells increases lactate production and decreases carbon flow into the mitochondria via the pyruvate dehydrogenase complex (PDH). As opposed to Warburg's initial hypothesis of defective, non-functional mitochondria in cancer, additional studies have shown that cancer cells depend on mitochondrial metabolism for anabolic intermediates, with 10–15% of glucose carbons entering the tricarboxylic acid cycle (TCA) cycle(1). This distribution is thought to represent a balance between the need for anabolic precursors, reducing equivalents in the form of nicotinamide adenine dinucleotide (NADH) and NADPH and ATP in order to maximize cell growth. As a result, despite the fact that ~85% of glucose carbon is excreted as lactate, the generation of acetyl-CoA from pyruvate remains critical to cancer growth. PDH catalyzes the oxidative decarboxylation of pyruvate to acetyl-CoA and is essential for converting glucose carbons into lipids and other TCA cycle intermediates (Figure 1). In addition, cancer cells can utilize glutamine via its conversion to α-ketoglutarate that enters the TCA cycle via α-ketoglutarate dehydrogenase complex (KDH, Figure 1). Inhibition of both PDH and KDH would be predicted to deprive cancer cells of their ability to metabolize carbon via the TCA cycle.
Figure 1.

Overview of carbon metabolism. Shown is a simplified schematic of carbon metabolism with the CPI-613 targets PDH and KDH shown in grey.
Lipoate is an essential cofactor for several mitochondrial enzymes that are key to maintaining TCA cycle intermediates including PDH and KDH. CPI-613 is a novel lipoate derivative that inhibits PDH and KDH(4, 5). It causes hyperphosphorylation of the E1α subunit of PDH, ATP depletion and cell death in malignant but not normal cells(4). Following confirmation of its novel mechanism of action in leukemia cells we tested its safety in a phase I trial for patients with relapsed or refractory hematological malignancies.
Methods
Cell culture
K562 cells were purchased from the ATCC and OCI-AML3 were the kind gift of Dr Mark Minden at University of Toronto. All human cell lines were maintained in RPMI media (Gibco, Carlsbad, CA) supplemented with 10% FBS, penicillin and streptomycin. Cells were grown at 37°C with 5% CO2.
Mitochondrial Respiration Assays
All oxygen consumption assays were performed using the XF24 Extracellular Flux Analyzer (Seahorse Bioscience) as per the manufacturer's instructions. Cells were placed in assay media with the indicated amount of CPI-613 and incubated for 2 hours prior to being placed in the assay. Oligomycin at a final concentration of 1 µM, FCCP at 0.5 µM, and Actinomycin A and Rotenone each at 1 µM were used. All assays were done in triplicate and repeated in three independent experiments.
Western Blots
Samples were lysed in Laemmli buffer, separated by polyacrylamide gel electrophoresis (SDS-PAGE), and transferred to an Immobilon polyvinylidene fluoride membrane (Millipore). Antibodies against adenosine monophosphate-activated protein kinase (AMPK, Cell Signaling, 2532S), phosphorylated AMPK (pAMPK, Cell Signaling, 2532S), Phosphorylated E1α (Cal Biochem, AP1062) and actin (Abcam, ab6276) were used.
Patient Selection
Patients were eligible if they were age 18 or older, had a relapsed or refractory hematologic malignancy having failed or refused standard salvage therapy. All patients were required to have a Karnofsky performance status of ≥70, life expectancy ≥3 months, and could not have any of the following: current CNS disease, active ongoing infection, uncontrolled bleeding diathesis, dyspnea on mild to moderate exertion, clinically significant effusions, QTc interval >470 ms or elevated troponin. All toxicities from previous treatments had to be stable and ≤Grade 1. Laboratory values had to be: AST and ALT ≤3× upper normal limit (UNL), bilirubin ≤1.5× UNL, serum creatinine ≤2.0 mg/dL, INR <1.5 and albumin >2.5 g/dL.
The protocol was approved by the Wake Forest Health Sciences Institutional Review Board and monitored by the Comprehensive Cancer Center's Safety and Toxicity Review Committee. Written and informed consent was obtained for all subjects in accordance with the Declaration of Helsinki. The trial was registered at clinicaltrials.gov (Identifier: NCT01034475).
Treatment Schema
CPI-613 was administered by central line over 2 hours on days 1 and 4 of each week for three consecutive weeks followed by a week of rest. The trial used a 2-stage dose-escalation scheme (single-patient and traditional stages, 1–3–6) as described below.
Single-Patient Dose-Escalation Stage
A single patient was accrued per dose level, starting at 420 mg/m2. Doses were doubled until a toxicity occurred that was attributable to CPI-613 and >Grade 1. Thereafter the traditional dose-escalation stage was triggered.
Traditional Dose-Escalation
All dose escalations were done according to the modified Fibonacci dose-escalation scheme. The number of patients in each cohort was 3, if no DLTs occurred (toxicity ≥ Grade 3 probably or definitely related to CPI-613 that occurred within 28 days of the first dose) dose escalation continued. Once a DLT occurred the cohort was expanded up to a maximum of 6 patients. If there was no DLT in any other patient out of 6 patients, dose escalation continued. If a DLT occurred in 2 patients in the same cohort, CPI-613 dosing stopped immediately and that dose was considered above the MTD.
Continuation of Therapy
Only 1 cycle of therapy was planned, but patients could continue to receive CPI-613 if the treating physician deemed it beneficial.
Toxicity Monitoring
Toxicity was assessed using the NCI Common Terminology Criteria for Adverse Events (CTCAE), Version 3.0.
Intra-patient dose escalation
Intra-patient dose escalation was allowed provided all of the following conditions were met: No toxicity before the next treatment cycle began; the patient still met all eligibility criteria; and the treating physician believed additional benefit could accrue from dose escalation.
Response Criteria
Response was assessed by standard criteria for the respective malignancy. Response and progression for lymphoma patients with evaluable disease were assessed using the criteria proposed by the International Harmonization Project(6). Cutaneous T cell lymphoma was evaluated as per published criteria(7). Patients with multiple myeloma were assessed according to the International Uniform Response Criteria(8). Published criteria were used to assess patients with MDS(9) and AML(10).
Peripheral Blood Mononuclear Cells
Blood samples were collected in 4 mL lavender- top collection tubes as above and subjected to Ficoll gradient sedimentation. The mononuclear cell phase was gently collected, washed with phosphate-buffered saline (PBS), resuspended in RPMI-1640 media with 10% DMSO, and stored at −80°C until use.
Pharmacokinetics
Plasma was assayed for CPI-613 using liquid chromatography/mass spectroscopy/mass spectroscopy. From the assayed results, PKs of plasma CPI-613 levels were derived using PK Solutions 2.0™ software (Pharmacokinetics and Metabolism Software, Montrose, CO). Differences in the mean values among various groups were compared using analysis of variance (ANOVA) statistical modeling.
Gene expression profiling
Expression microarray analysis was performed at the Comprehensive Cancer Center of Wake Forest University Microarray Shared Resource. Total RNA was isolated from peripheral blood mononuclear cells using RiboPure-Blood Kit (Life Technologies (AM1928)). RNA was purified on RNeasy columns (Qiagen) and measured for mass and integrity on an Agilent Bioanalyzer. RNA was amplified and labeled according to the Affymetrix 3’-IVT labeling protocol. cRNA was hybridized to the Affymetrix Gene Atlas U219 Human Genome array strips. Arrays were washed and scanned according to the manufacturer’s instructions. The data has been deposited with the Gene Expression Omnibus (accession number GSE60350).
Statistical Analysis
For the gene expression analysis, differentially expressed genes were identified by univariate T-test (2 sided, unequal variance) and adjusted for multiple testing by the method of Benjamini & Hochberg(11). Adjusted p-values (q-values) were set at a significance threshold of 0.05 for downstream analyses. Statistical enrichment of gene ontology (GO) terms was investigated using the DAVID (Database for Annotation, Visualization, and Integrated Discovery) microarray resource(12, 13). For the mitochondrial function assays means of oxygen consumption rates were compared by a one way ANOVA analysis. Individual means were then compared by Tukey’s test. A p value of less than or equal to 0.05 was considered significant. All error bars shown are standard deviation. Analysis was done using Graph Pad Prism version 5.
Results
CPI-613 inhibits mitochondrial metabolism in leukemia cells
As mentioned in the introduction, CPI-613 leads to increased phosphorylation of the E1 subunit of PDH and inhibits KDH in solid tumor cell lines(4, 5). To determine if CPI-613 directly inhibits mitochondrial metabolism in hematogic malignancies, we treated the human leukemia cell lines K562 and OCI-AML3 with CPI-613 and assessed mitochondrial respiration. CPI-613 exposure resulted in inhibition of maximal mitochondrial respiration in both cell lines (Figure 2A). In order to confirm that CPI-613 caused PDH E1 phosphorylation, we harvested cells following the same CPI-613 exposures and performed Western blots. CPI-613 caused an increase in PDH phosphorylation in a dose dependent manner (Figure 2B). Finally, to confirm that CPI-613 depletes cellular ATP, we assessed the phosphorylation status of adenosine monophosphate-activated protein kinase (AMPK). AMPK is phosphorylated in response to high AMP/ADP ratios in cells as a consequence of ATP depletion. AMPK became phosphorylated in OCI-AML3 cells following CPI-613 exposure (Figure 2C). These data demonstrate that CPI-613 targets mitochondrial metabolism in leukemia cells.
Figure 2.

CPI-613 inhibits mitochondrial respiration. A) Oxygen consumption rates (OCR) are shown for K562 and OCI-AML3 cells treated with CPI-613. Cells were incubated with the indicated concentration of CPI-613 for 2 hours prior to the assay. The electron transport chain uncoupler FCCP was added and OCR was measured in triplicate from 3 separate measurements, repeated in 3 independent experiments. Error bars are the standard deviation. *=p value <0.05. B) PDH phosphorylation is increased by CPI-613. K562 cells were incubated with the indicated amount of CPI-613 as in A and harvested for lysates. Western blots for phospho-E1α were performed. Actin was blotted to serve as a loading control. C) AMPK phosphorylation is increased by CPI-613. OCI-AML3 cells were incubated with the indicated amount of CPI-613 as in A and harvested for lysates. Western blots for phosphorylated AMPK (pAMPK) were performed. Total AMPK (tAMPK) was blotted to serve as a loading control.
Patient Demographics
In order to determine the MTD and safety of CPI-613 in patients with hematologic malignancies, we conducted a phase I study. CPI-613 was infused over 2 hours via a central line on days 1 and 4 of each week for three consecutive weeks with one week of rest (28 day cycles). Central line infusion was chosen as preclinical and phase I studies in solid tumor patients demonstrated pain and inflammation when CPI-613 was given via a peripheral vein. The primary endpoint of the study was to determine the safety and MTD of CPI-613 when administered twice weekly for three consecutive weeks. The secondary endpoints were to determine the PK of CPI-613 following IV administration and observe the anti-cancer effects of CPI-613, if any occur. A total of 26 patients were enrolled on trial. Patient demographics and diagnosis are summarized in Table 1.
Table 1.
Patient Characteristics
| N (%) | ||
|---|---|---|
| Male | 15/26 (58%) | |
| No. Caucasian (%); African American (%) | 24/26 (92%); 2/26 (8%) | |
| Median Age (Range) | 65 (19–81) | |
| Median Overall Survival | 3.6 months | |
| Median Lines of Prior Therapy (Range) | 3 (1–9) | |
| Diagnosis | ||
| Acute Myeloid Leukemia | 11 (42%) | |
| Non-Hodgkin's Lymphoma | 6 (22%) | |
| Multiple Myeloma | 4 (16%) | |
| Myelodysplastic Syndrome | 4 (16%) | |
| Hodgkin’s Lymphoma | 1 (4%) | |
Dose Escalation and Toxicity
After one patient received a dose of 840 mg/m2, a Grade 2 toxicity occurred triggering the standard dose-escalation stage. After four dose escalations (to 2940 mg/m2) with no DLTs observed, the protocol was amended to administer 3000 mg/m2 of CPI-613 over one hour. This was done to increase the Cmax of CPI-613 while maintaining the total dose and further dose escalations were to be done by increasing the infusion time. However, two of three patients in this cohort developed grade 3 acute renal failure and the infusion time was then returned to two hours. At that time a patient from the 2100 mg/m2 cohort who was intra-patient dose escalated to 2940 mg/m2 experienced a grade 3 renal failure and an additional 3 patients were dosed at 2940 mg/m2 infused over 2 hours. When no additional DLTs were observed at the 2940 mg/m2 dose level the dose was escalated to 3780 mg/m2. The third patient in this cohort experienced a DLT (Grade 3 vomiting) and the first patient in the expansion cohort (fourth patient at this dose level) experienced a DLT (Grade 3 acute renal failure), defining this dose as above the MTD. As a total of 6 patients were treated at the 2940 mg/m2 dose this was established as the MTD.
Five patients did not complete the study. One refused, one acquired an infection, and three developed acute kidney failure. Toxicities were otherwise minimal. All toxicities greater than or equal to Grade 2 attributed as probable or definitely related to CPI-613 are summarized in Table 2. All patients who received at least one dose of drug were considered evaluable for toxicity and are included in table 2. All three patients who developed renal failure during the first cycle are included in table 2 as is the patient who experienced renal failure after dose escalation to 2940 mg/m2. Two patients died during the study, attributed to progression of underlying disease. One patient with high-grade MDS received one dose of CPI-613 given over 1 hour, as described above, developed acute renal failure and received no additional therapy. Several weeks later he progressed to AML that was not attributed to CPI-613. No cases of worsening cytopenias were attributed as probably or definitely related to CPI-613, and cytopenias improved on CPI-613 in several patients who did not meet criteria for a response.
Table 2.
All toxicities ≥Grade 2 Attributed as Probable or Definitely Related to CPI-613
| Attribution = Probable + Definite | ||||
|---|---|---|---|---|
| Toxicity | Grade 2 | Grade 3 | Grade 4 | Grade 5 |
| Nausea | 1 | 0 | 0 | 0 |
| Vomiting | 0 | 1 | 0 | 0 |
| Diarrhea | 3 | 0 | 0 | 0 |
| Proteinuria | 1 | 0 | 0 | 0 |
| Renal failure | 0 | 4 | 0 | 0 |
| Hypotension | 1 | 0 | 0 | 0 |
| Calcium, serum-low (hypocalcemia) | 1 | 0 | 0 | 0 |
| Albumin, serum-low (hypoalbuminemia) | 1 | 0 | 0 | 0 |
| Potassium, serum-high (hyperkalemia) | 0 | 1 | 0 | 0 |
| Leukopenia | 0 | 0 | 0 | 0 |
| Anemia | 0 | 0 | 0 | 0 |
| Thrombocytopenia | 0 | 0 | 0 | 0 |
Efficacy
Of the 21 patients who completed the trial, 4 achieved an objective response and 2 others achieved prolonged stabilization of disease for a clinical benefit rate of 29%. Additionally, 2 multiple myeloma patients met criteria for stable disease and 10 patients (48%) received more than one cycle (Supplemental Table 1). Stable disease in the two patients with multiple myeloma was sustained for 2 and 4 cycles respectively. Both patients left study for disease progression as documented by a new plasmacytoma in one patient and an increase in M protein in the other. A response was seen in all three evaluable patients with MDS, one CR as detailed below and the other two achieved prolonged stable disease sustained for 8 and 12 cycles, respectively. One patient with RAEB-2, (high risk by Revised International Prognostic Scoring System [IPSS-R]) showed regression to RAEB-1 after five cycles of CPI-613. After her eighth cycle the patient chose to leave the study for hospice after she suffered a mechanical fall and could no longer ambulate. The other MDS patient had refractory anemia with 5q and 7q minus by FISH (high risk by IPSS-R), discontinued CPI-613 following her twelfth cycle after an increase in her transfusion requirements. One AML patient had stable disease that lasted four cycles but since this is not recognized as a response in AML this patient was not counted as a responder. The four responses better than stable disease are detailed below.
Patient #4 is a 51 year-old male diagnosed with relapsed normal karyotype AML who underwent autologous hematopoietic stem cell transplant (HSCT) while in CR2. Following transplant he remained transfusion dependent for both red blood cells and platelets. Three months post-transplant a bone marrow biopsy demonstrated a hypocellular marrow, no increase in blasts, and 8.5% cells 7q- by FISH. With continued transfusion dependence and cytogenetics characteristic of MDS he met criteria for MDS unclassified and given his history of previous systemic chemotherapy this was consistent with therapy related MDS. At 6 months post-transplant, repeat marrow revealed no increase in blasts but expansion of the 7q- clone to 41% cells. His IPSS-R category calculated at this time was high risk with a predicted overall survival of 1.6 years(14). Following his first cycle of treatment he became transfusion independent. Following 8 cycles he met all criteria for CR3 and has remained on drug for 41 cycles with a sustained pathologic and hematologic complete remission. His 7q minus clone has waxed and waned with a best response of 25% after 29 cycles.
Patient #12 is a 66 year-old female with refractory AML. She received induction with 7+3, then cytoxan-etoposide, then high-dose cytarabine + mitoxantrone + L-asparaginase, then decitabine and finally azacytidine. Pre-trial marrow showed a hypocellular marrow with 9% blasts and 22% immature monocytes (31% blast equivalents). After 2 cycles of CPI-613 a repeat biopsy revealed a hypercellular marrow with no evidence of disease (Morphologically Leukemia Free State, MLFS). Prior to count recovery she was removed from study to undergo a reduced intensity conditioned allogeneic HSCT. She remains alive with no evidence of leukemia.
Patient #14 is a 19 year-old female who was diagnosed with Burkitt’s lymphoma in April 2010. She was treated with chemo-immunotherapy and achieved a remission. She relapsed in December 2010 and after 2 cycles of salvage Hyper CVAD, received a myeloablative allogeneic HSCT. She suffered her second relapse in September 2011 and enrolled on trial. She achieved a radiographic partial response after 3 cycles of therapy that was maintained for 17 cycles (Figure 3). She ultimately went off study to have her residual disease resected and is currently without evidence of disease off all therapy more than 12 months later. The surgical specimen revealed Burkitt's lymphoma with extensive necrosis.
Figure 3.
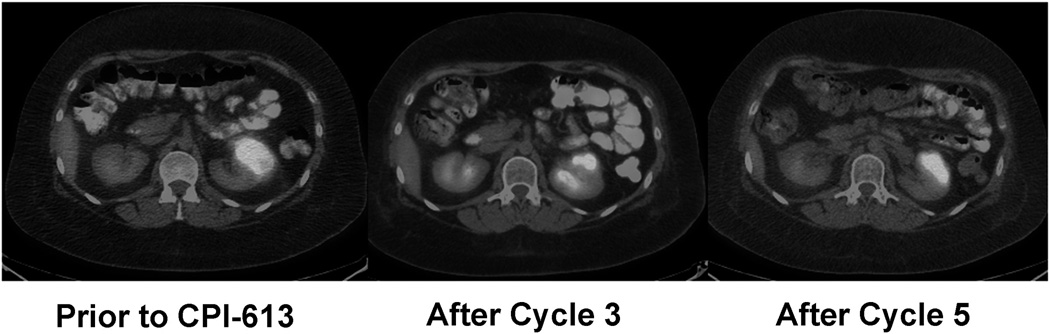
Response in a Burkitt's lymphoma patient. PET/CT images are shown for patient #14 just prior to enrollment and after 3 and 5 cycles as labeled.
Patient #20 is a 52 year-old female diagnosed with CTCL in May 2008. She was treated with oral methotrexate, bexarotene, vorinostat, denileukin diftitox, gemcitabine, pralatrexate, romidepsin, bortezomib, romidepsin again and finally bexarotene again before starting CPI-613. She achieved a partial response sustained now for 25 cycles (Figure 4). After 3 cycles she requested that the week of rest be omitted as she was seeing disease flares during week four when not treatment was administered. She has since received continuous therapy without significant toxicities and no evidence of marrow suppression.
Figure 4.

Response in a CTCL patient. Photographs of representative lesions from patient #20 after 1, 4, or 7 cycles of CPI-613.
Pharmacokinetics
In most patients (23 of 26), there was a rapid decline in plasma levels during the first 8–10 hrs post-administration, followed by low plasma CPI-613 values persisting for several days. Erratic results from 3 patients, comprising the 420 and 840 mg/m2 dose groups, were not included in the analyses. The concentration-time curves associated with all dose levels of CPI-613 were triphasic. The α-phase occurred during the first 6–8 hours post-administration and was associated with a T1/2 of ~1.3 hours. The β-phase occurred from 6–8 hours to 24 hours post-administration and was associated with a modest increase in CPI-613 values. The γ or final phase started from 24 hours until 72 hours, and was associated with a slow decline in CPI-613 values, consistent with its high protein-binding properties (Figure 5A). CPI-613 was not detected prior to the first dose, but baseline levels associated with dose 6 had an overall average value of ~3 µM. The small amount of residual CPI-613 in the plasma lacked significant drug accumulation effects, as concentration-time curves associated with dose 1 were comparable to dose 6 (Figure 5B). As expected in the 3 patients who received CPI-613 over one hour the Cmax was significantly higher than in patients given drug over a 2 hour infusion (Supplemental Figure 1).
Figure 5.

Pharmacokinetics of CPI-613. A) Plasma CPI-613 levels following 2 hour infusion shown in log scale to highlight the triphasic clearance. B) Comparison of day 1 and day 6 plasma levels shown on a linear scale.
Response Signature
To explore the possibility of an effect of CPI-613 on the immune system of patients following treatment we performed an analysis of gene expression profiles of peripheral blood mononuclear cells (PBMCs). We selected the 4 patients with myeloid malignancies who responded to CPI-613 (1 with AML and 3 with MDS) and compared them to 4 patients who did not respond (all with AML). PBMCs were obtained on day 1 of week 4 of cycle 1, after all 6 doses of CPI-613 were administered. Many genes showed differential expression (Supplemental Figure 2). Because no genes achieved statistical significance (q<0.05), a GO enrichment analysis was performed. Only the genes overexpressed in responders resulted in the identification of GO biological process terms after false discovery correction. The top pathways upregulated in responders involved immune regulation including T cell activation, leukocyte activation and regulation of cytokine production (Supplemental Table 2). Multiple upregulated genes (e.g. IFNG, CCL5, CXCR3, CD8A, CD3E and CD3D) are commonly associated with a TH-1 type immune response(15).
Discussion
To our knowledge, this is first report of clinical activity of any agent that targets mitochondrial metabolism in patients with hematologic malignancies. CPI-613 is a lipoate analog that inhibits the mitochondrial enzymes PDH and KDH. When human leukemia cells were exposed to CPI-613 there was a dose dependent decrease in mitochondrial respiration. It also led to increased phosphorylation of PDH and AMPK consistent with inhibition of PDH and energy depletion as would be predicted from the proposed mechanism of action. A more comprehensive study of the metabolic effects of CPI-613 as well as pharmacodynamic analysis of primary patient samples from an ongoing clinical trial is currently underway.
In the phase I study, a total of 26 patients with relapsed or refractory hematological malignancies were enrolled on trial and 21 were evaluable for response. Of these 4 patients achieved an objective response and 2 MDS patients achieved prolonged stabilization of disease for a clinical benefit rate of 29%. These patients were heavily pretreated with a median of 3 previous lines of therapy and older with a median age of 65. The MTD of CPI-613 given twice weekly over 2 hours was determined to be 2940 mg/m2.
CPI-613 was well tolerated with the DLTs of vomiting and acute renal failure. The mechanism behind the acute renal failure is unknown at this time. The clinical and laboratory data were consistent with acute tubular necrosis. In the patients who developed renal failure there was no consistent underlying malignancy as 2 patients had MDS, one had NHL and one had AML. All four patients were 65 years of age or older at the time of renal failure. The renal failure was reversible in three of the four patients with one patient opting for hospice before resolution could be documented. The renal failure was managed conservatively in two of the three patients not opting for hospice with one patient receiving a single hemodialysis treatment. The renal failure duration ranged between 2–3 weeks. In two patients, renal function returned to baseline and in one patient his creatinine remained slightly elevated (1.7–1.8 mg/dL). All current studies have mandated a baseline creatinine of less than 1.5 mg/dL. Aside from renal failure and one case of vomiting no other clinically significant toxicities were observed. No patient had a worsening of any cytopenias attributed as probably or definitely related to CPI-613. Indeed, cytopenias improved in several patients with AML who did not meet criteria for a response. Both patients who have received extended dosing of CPI-613 have not demonstrated any evidence of marrow toxicity after almost two years and over three years on drug respectively.
All three evaluable patients with MDS achieved a response of stable disease or better, suggesting efficacy of CPI-613 against this malignancy. The responses were reminiscent of those seen with the hypomethylating agents(16). The possibility of epigenetic alterations as a mechanism of CPI-613 is supported by the cross talk between mitochondrial metabolism and DNA methylation (reviewed by Martinez-Pastor(17)). DNA methylation requires S-adenosylmethionine (SAM), produced from methionine in an ATP- dependent reaction. ATP depletion is a consequence of CPI-613 exposure (Figure 2A–C) and should deplete cells of SAM as well. Reactions that lead to DNA demethylation utilize α-ketoglutarate(18). CPI-613 inhibition of KDH will result in α-ketoglutarate accumulation that can drive the demethylation reaction. The possibility of CPI-613 induced changes in DNA methylation will need to be directly confirmed and a phase II study of CPI-613 as a monotherapy in patients with MDS having failed first line therapy is currently accruing patients.
The immune signature seen in the PBMCs of patients who responded to CPI-613 was consistent with a TH1 type response. This initial exploratory analysis is suggestive of a role of CPI-613 in increasing the immunogenicity of the tumor cells. Confirming this mechanism is the subject of current ongoing experiments.
Several studies have shown that stimulation of PDH activity causes impairments in cancer cell growth and tumorigenesis(19, 20). Additionally, treatment with the small molecule dichloroacetic acid (DCA) that increases PDH function resulted in several responses in patients with glioblastoma and a case report of a response in a diffuse large B cell lymphoma patient(21, 22). These data have been interpreted to support the view that mitochondrial function is disadvantageous. Contrary to this is the fact that cancer cells depleted of mitochondria display impaired growth and invasiveness and mitochondrial metabolism is required for oncogenic K-Ras transformation(23, 24). Additionally, there are confirmed cases of mitochondrial enzyme mutations causing cancer including mutations in IDH2 in AML(25). There is evidence that some malignancies generate much of their cellular ATP via mitochondrial respiration(26) and all de novo lipid synthesis utilizes mitochondrial derived metabolites(27). The ultimate dependence of any one tumor on mitochondrial metabolism varies by tissue and oncogene involved(28). Therefore it is likely that significant variation in dependence on mitochondrial metabolism exists between tumor types and indeed even between different patients with the same tumor type. Our data support this with several patients even in this heavily pre-teated cohort having dramatic responses. Additional studies to better characterize those tumors most likely to respond is ongoing.
In summary, this reports details the results of a phase I trial of the first-in-class, first-in-man mitochondrial metabolism inhibitor CPI-613. The data demonstrate that agents that target cancer cell mitochondrial metabolism can have clinical activity with acceptable toxicity, and support further studies of CPI-613 in hematological malignancies.
Supplementary Material
Translational Relevance.
Altered mitochondrial metabolism has been recognized in cancer cells for nearly a century but therapies that target it have not been widely developed. CPI-613 is a novel small molecule that targets two key lipoate dependent enzymes necessary for mitochondrial carbon metabolism. When leukemia cells are exposed to CPI-613 their mitochondrial function is impaired and the cells become energy depleted. In patients with advanced hematologic malignancies CPI-613 was well tolerated when administered over a 2 hour infusion. When given above the MTD or over a shortened infusion time, several cases of acute renal failure were seen. Of the 21 patients who received at least one cycle of CPI-613 four had objective responses and another two had prolonged stable disease. These data suggest that agents that target mitochondrial metabolism can be safely administered and have activity in hematologic malignancies. Studies of CPI-613 in myelodysplastic syndrome and acute myeloid leukemia patients are ongoing.
Acknowledgements
The authors would like to acknowledge Karen Klein for help editing the manuscript. TSP is supported by NCI 1K08CA169809, SI and the Microarray Shared Resource are supported by NCI Cancer Center Support Grant (CCSG) P30CA012197. Additional support provided by the Doug Coley Foundation for Leukemia Research, the Frances P. Tutwiler Fund, and The MacKay Foundation for Cancer Research. Cornerstone Pharmaceuticals provided CPI-613 and funded and performed the pharmacokinetic studies. The content is solely the responsibility of the authors and does not necessarily represent the official views of the National Cancer Institute or the National Institutes of Health.
TSP Honoraria, advisory panel member, research support and travel costs from Cornerstone Pharmaceuticals, KL Employee of Cornerstone Pharmaceuticals, JL Employee of Cornerstone Pharmaceuticals, CM Employee of Cornerstone Pharmaceuticals, RR Employee of Cornerstone Pharmaceuticals, ownership interest in Cornerstone Pharmaceuticals, BLP advisory panel member for Cornerstone Pharmaceuticals.
Footnotes
TSP designed the research, analyzed the data and wrote the manuscript. KL analyzed the data, performed research and edited the manuscript. JL analyzed the data, performed research and edited the manuscript. CM analyzed the data, performed research and edited the manuscript. RR analyzed the data, performed research and edited the manuscript. SI analyzed the data. Lance Miller analyzed data and edited the manuscript. KS performed research. DL contributed patients and edited the manuscript. DH contributed patients and edited the manuscript. LE contributed patients and edited the manuscript. RH performed research, collected data. MM Collected data and edited the manuscript. SD Collected data and edited the manuscript. SL Collected data and edited the manuscript. BLP contributed patients, analyzed the data and edited the manuscript.
Conflicts of Interest:
There are no other conflicts to report.
References
- 1.Vander Heiden MG, Cantley LC, Thompson CB. Understanding the Warburg effect: the metabolic requirements of cell proliferation. Science. 2009;324:1029–1033. doi: 10.1126/science.1160809. [DOI] [PMC free article] [PubMed] [Google Scholar]
- 2.Warburg O, Wind F, Negelein E. The Metabolism of Tumors in the Body. J Gen Physiol. 1927;8:519–530. doi: 10.1085/jgp.8.6.519. [DOI] [PMC free article] [PubMed] [Google Scholar]
- 3.Hanahan D, Weinberg RA. Hallmarks of cancer: the next generation. Cell. 2011;144:646–674. doi: 10.1016/j.cell.2011.02.013. [DOI] [PubMed] [Google Scholar]
- 4.Zachar Z, Marecek J, Maturo C, Gupta S, Stuart SD, Howell K, et al. Non-redox-active lipoate derivates disrupt cancer cell mitochondrial metabolism and are potent anticancer agents in vivo. J Mol Med (Berl) 2011;89:1137–1148. doi: 10.1007/s00109-011-0785-8. [DOI] [PubMed] [Google Scholar]
- 5.Stuart SD, Schauble A, Gupta S, Kennedy AD, Keppler BR, Bingham PM, et al. A strategically designed small molecule attacks alpha-ketoglutarate dehydrogenase in tumor cells through a redox process. Cancer Metab. 2014;2:4. doi: 10.1186/2049-3002-2-4. [DOI] [PMC free article] [PubMed] [Google Scholar]
- 6.Cheson BD, Pfistner B, Juweid ME, Gascoyne RD, Specht L, Horning SJ, et al. Revised response criteria for malignant lymphoma. J Clin Oncol. 2007;25:579–586. doi: 10.1200/JCO.2006.09.2403. [DOI] [PubMed] [Google Scholar]
- 7.Olsen EA, Whittaker S, Kim YH, Duvic M, Prince HM, Lessin SR, et al. Clinical end points and response criteria in mycosis fungoides and Sezary syndrome: a consensus statement of the International Society for Cutaneous Lymphomas, the United States Cutaneous Lymphoma Consortium, and the Cutaneous Lymphoma Task Force of the European Organisation for Research and Treatment of Cancer. J Clin Oncol. 2011;29:2598–2607. doi: 10.1200/JCO.2010.32.0630. [DOI] [PMC free article] [PubMed] [Google Scholar]
- 8.Durie BG, Harousseau JL, Miguel JS, Blade J, Barlogie B, Anderson K, et al. International uniform response criteria for multiple myeloma. Leukemia. 2006;20:1467–1473. doi: 10.1038/sj.leu.2404284. [DOI] [PubMed] [Google Scholar]
- 9.Cheson BD, Greenberg PL, Bennett JM, Lowenberg B, Wijermans PW, Nimer SD, et al. Clinical application and proposal for modification of the International Working Group (IWG) response criteria in myelodysplasia. Blood. 2006;108:419–425. doi: 10.1182/blood-2005-10-4149. [DOI] [PubMed] [Google Scholar]
- 10.Dohner H, Estey EH, Amadori S, Appelbaum FR, Buchner T, Burnett AK, et al. Diagnosis and management of acute myeloid leukemia in adults: recommendations from an international expert panel, on behalf of the European LeukemiaNet. Blood. 2010;115:453–474. doi: 10.1182/blood-2009-07-235358. [DOI] [PubMed] [Google Scholar]
- 11.Benjamini Y, Hochberg Y. Controlling the False Discovery Rate - a Practical and Powerful Approach to Multiple Testing. J Roy Stat Soc B Met. 1995;57:289–300. [Google Scholar]
- 12.Dennis G, Jr, Sherman BT, Hosack DA, Yang J, Gao W, Lane HC, et al. DAVID: Database for Annotation, Visualization, and Integrated Discovery. Genome Biol. 2003;4:P3. [PubMed] [Google Scholar]
- 13.Huang DW, Sherman BT, Lempicki RA. Systematic and integrative analysis of large gene lists using DAVID bioinformatics resources. Nat Protoc. 2009;4:44–57. doi: 10.1038/nprot.2008.211. [DOI] [PubMed] [Google Scholar]
- 14.Greenberg PL, Tuechler H, Schanz J, Sanz G, Garcia-Manero G, Sole F, et al. Revised international prognostic scoring system for myelodysplastic syndromes. Blood. 2012;120:2454–2465. doi: 10.1182/blood-2012-03-420489. [DOI] [PMC free article] [PubMed] [Google Scholar]
- 15.Galon J, Angell HK, Bedognetti D, Marincola FM. The continuum of cancer immunosurveillance: prognostic, predictive, and mechanistic signatures. Immunity. 2013;39:11–26. doi: 10.1016/j.immuni.2013.07.008. [DOI] [PubMed] [Google Scholar]
- 16.Fenaux P, Mufti GJ, Hellstrom-Lindberg E, Santini V, Finelli C, Giagounidis A, et al. Efficacy of azacitidine compared with that of conventional care regimens in the treatment of higher-risk myelodysplastic syndromes: a randomised, open-label, phase III study. Lancet Oncol. 2009;10:223–232. doi: 10.1016/S1470-2045(09)70003-8. [DOI] [PMC free article] [PubMed] [Google Scholar]
- 17.Martinez-Pastor B, Cosentino C, Mostoslavsky R. A Tale of Metabolites: The Cross-Talk between Chromatin and Energy Metabolism. Cancer Discovery. 2013;3:497–501. doi: 10.1158/2159-8290.CD-13-0059. [DOI] [PMC free article] [PubMed] [Google Scholar]
- 18.Abdel-Wahab O, Levine RL. Mutations in epigenetic modifiers in the pathogenesis and therapy of acute myeloid leukemia. Blood. 2013;121:3563–3572. doi: 10.1182/blood-2013-01-451781. [DOI] [PMC free article] [PubMed] [Google Scholar]
- 19.Sutendra G, Michelakis ED. Pyruvate dehydrogenase kinase as a novel therapeutic target in oncology. Front Oncol. 2013;3:38. doi: 10.3389/fonc.2013.00038. [DOI] [PMC free article] [PubMed] [Google Scholar]
- 20.McFate T, Mohyeldin A, Lu H, Thakar J, Henriques J, Halim ND, et al. Pyruvate dehydrogenase complex activity controls metabolic and malignant phenotype in cancer cells. J Biol Chem. 2008;283:22700–22708. doi: 10.1074/jbc.M801765200. [DOI] [PMC free article] [PubMed] [Google Scholar]
- 21.Michelakis ED, Sutendra G, Dromparis P, Webster L, Haromy A, Niven E, et al. Metabolic modulation of glioblastoma with dichloroacetate. Sci Transl Med. 2010;2:31ra4. doi: 10.1126/scitranslmed.3000677. [DOI] [PubMed] [Google Scholar]
- 22.Strum SB, Adalsteinsson O, Black RR, Segal D, Peress NL, Waldenfels J. Case report: Sodium dichloroacetate (DCA) inhibition of the "Warburg Effect" in a human cancer patient: complete response in non-Hodgkin's lymphoma after disease progression with rituximab-CHOP. J Bioenerg Biomembr. 2013;45:307–315. doi: 10.1007/s10863-012-9496-2. [DOI] [PubMed] [Google Scholar]
- 23.Cavalli LR, Varella-Garcia M, Liang BC. Diminished tumorigenic phenotype after depletion of mitochondrial DNA. Cell Growth Differ. 1997;8:1189–1198. [PubMed] [Google Scholar]
- 24.Weinberg F, Hamanaka R, Wheaton WW, Weinberg S, Joseph J, Lopez M, et al. Mitochondrial metabolism and ROS generation are essential for Kras-mediated tumorigenicity. Proc Natl Acad Sci U S A. 2010;107:8788–8793. doi: 10.1073/pnas.1003428107. [DOI] [PMC free article] [PubMed] [Google Scholar]
- 25.Wang F, Travins J, DeLaBarre B, Penard-Lacronique V, Schalm S, Hansen E, et al. Targeted inhibition of mutant IDH2 in leukemia cells induces cellular differentiation. Science. 2013;340:622–626. doi: 10.1126/science.1234769. [DOI] [PubMed] [Google Scholar]
- 26.Zu XL, Guppy M. Cancer metabolism: facts, fantasy, and fiction. Biochem Biophys Res Commun. 2004;313:459–465. doi: 10.1016/j.bbrc.2003.11.136. [DOI] [PubMed] [Google Scholar]
- 27.Wallace DC. Mitochondria and cancer. Nat Rev Cancer. 2012;12:685–698. doi: 10.1038/nrc3365. [DOI] [PMC free article] [PubMed] [Google Scholar]
- 28.Yuneva MO, Fan TW, Allen TD, Higashi RM, Ferraris DV, Tsukamoto T, et al. The metabolic profile of tumors depends on both the responsible genetic lesion and tissue type. Cell Metab. 2012;15:157–170. doi: 10.1016/j.cmet.2011.12.015. [DOI] [PMC free article] [PubMed] [Google Scholar]
Associated Data
This section collects any data citations, data availability statements, or supplementary materials included in this article.