Abstract
Ionotropic glutamate receptors are ligand-gated ion channels that mediate excitatory synaptic transmission in the vertebrate brain. To better understand how structural changes gate ion flux across the membrane, we trapped AMPA and kainate receptor subtypes in their major functional states and analyzed the resulting structures using cryo-electron microscopy. We show that transition to the active state involves a corkscrew motion of the receptor assembly, driven by closure of the ligand binding domain. Desensitization is accompanied by disruption of the amino terminal domain tetramer in AMPA, but not kainate receptors, with a 2-fold to 4-fold symmetry transition in the ligand binding domains in both subtypes. The 7.6 Å structure of a desensitized kainate receptor shows how these changes accommodate channel closing. These findings integrate previous physiological, biochemical, and structural analyses of glutamate receptors and provide a molecular explanation for key steps in receptor gating.
Introduction
Ionotropic glutamate receptors (iGluRs) are major mediators of excitatory synaptic transmission in the central nervous system and play a vital role in mediating memory and learning1,2. The AMPA, kainate and NMDA receptor subtypes work by opening a cation-selective pore in response to ligand binding, a key step in intercellular communication in the nervous system. Channel opening is followed by receptor desensitization that closes the channel, with both sets of reactions occurring on a millisecond time scale3. High resolution crystallographic studies of isolated amino terminal domain (ATD) and ligand binding domain (LBD) dimers, coupled with decades of biochemical and functional studies, have provided important insights into the structure and function of these receptor components4,5, while crystallographic analysis of the closed state of a modified form of the AMPA receptor (GluA2cryst) has enabled delineation of domain organization and transmembrane (TM) structure in the context of the tetrameric receptor assembly in an antagonist-bound closed state6.
Understanding the structural basis of the transition from closed to active and desensitized conformations is central to deciphering iGluR function in health and in disease. However, no structures of either active or desensitized conformations have been reported. Given that a number of earlier studies provide hints of extensive conformational variability in closed, active, and desensitized states7–10, including the ability of subunits to move independently during the activation process11, it seems likely that trapping functionally relevant states of native receptors in the context of 3D crystals may be challenging12. Previous structural studies of a full-length kainate receptor (GluK2) at ~ 20 Å resolution using cryo-electron tomography and sub-volume averaging suggested that desensitization involves dramatic structural changes in the LBD, with minimal changes in the ATD13. These findings are in contrast to the extensive quaternary rearrangements of the ATD tetramer assembly observed in earlier single particle negative stain analyses on AMPA receptors at ~ 40 Å resolution7. However, neither of these analyses were at resolutions high enough to provide a molecular interpretation of the underlying domain movements involved. To determine how glutamate receptor ion channels accommodate the structural changes necessary for activation and desensitization, we carried out single particle cryo-electron microscopy (cryo-EM) of both the AMPA receptor GluA2 and the kainate receptor GluK2. By solving structures in multiple conformational states (summarized in Extended Data Table 1a), we address the extent and nature of structural changes that occur in AMPA receptors during activation and desensitization, and compare the results with structural analysis of the GluK2 desensitized state by single particle cryo-EM at ~ 7.6 Å resolution. Our results provide a detailed glimpse into the overall gating cycle of glutamate receptors, an evaluation of the similarities and differences in conformational changes observed in AMPA and kainate receptor families, and a molecular mechanism for the dramatic LBD movements that occur during the receptor gating cycle.
Cryo-EM structure of the GluA2 antagonist-bound closed state
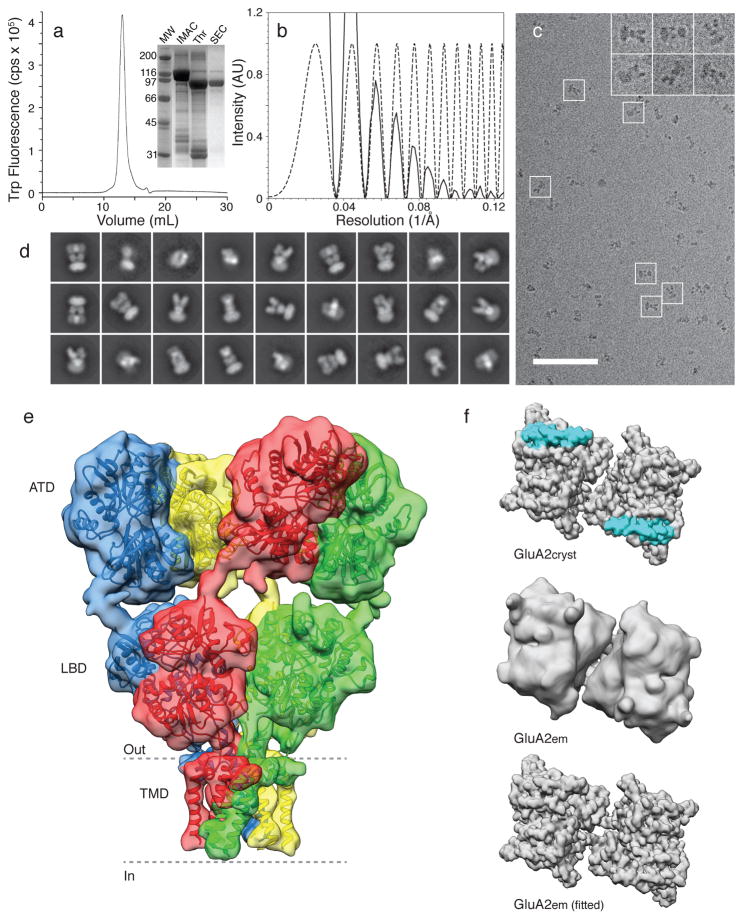
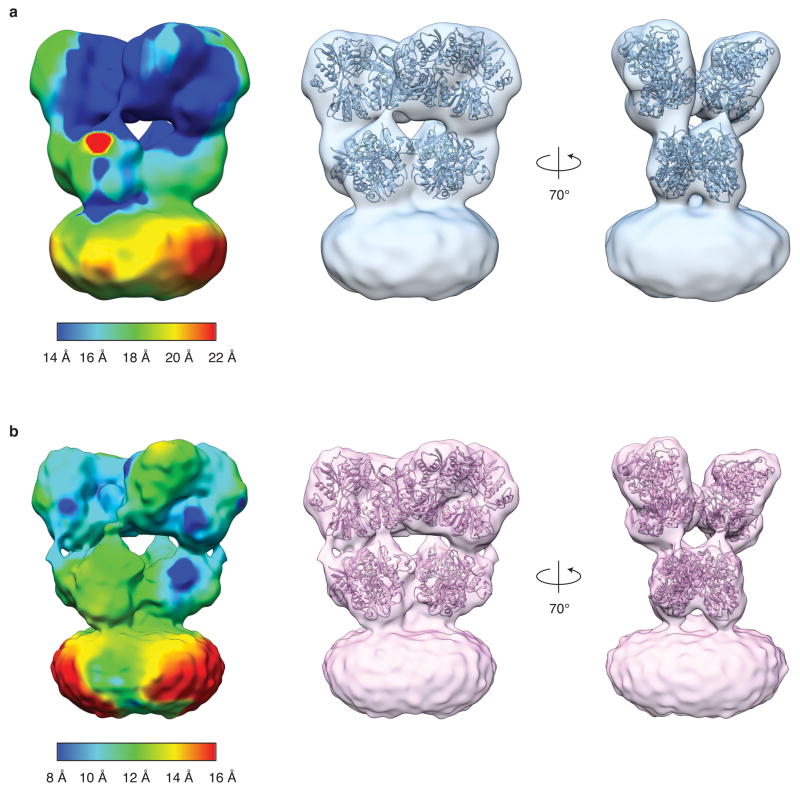
To establish the feasibility of solving iGluR structures with single particle cryo-EM, we first pursued structural studies of fully glycosylated GluA2 with a wild type ATD-LBD linker (referred to as GluA2em) trapped in the closed state with 0.3 mM ZK200775, a high-affinity competitive antagonist14. The 3D structure of GluA2em determined by single particle cryo-EM at a resolution of ~ 10 Å, estimated by the gold standard 0.143 FSC criterion15, demonstrates an overall organization similar to that reported for GluA2cryst (Fig. 1 and Extended Data Fig. 1, 2). The 2-fold symmetric dimer of dimers arrangement of the ATD and LBD, and the domain swap across distal and proximal subunits, are all clearly observed. In the transmembrane domain, similar to the X-ray structure of GluA2cryst6, density for α-helices pre-M1, M1, M3 and M4 are less well-resolved (Extended Data Fig. 2). To obtain a molecular interpretation of the cryo-EM density map, coordinates for two ATD dimers, two LBD dimers and the TM regions derived from GluA2cryst were fit as five independent rigid bodies (Fig. 1). This revealed excellent agreement with the crystal structure, but with an increase in separation between the ATD and LBD, which are ~ 8 Å further apart in GluA2em than in GluA2cryst (Extended Data Fig. 3). We also found a change in angle between LBD dimer pairs, from 139° in GluA2cryst to 144° in GluA2em, and an increase in separation between proximal AC subunits of ~ 5 Å as measured at the top of the LBD in GluA2em. We conclude that deletion of six residues in the ATD-LBD linker, perhaps coupled with crystal packing forces, result in subtle conformational changes, and creation of a buried interface in GluA2cryst that is absent in native AMPA receptors (Fig. 1f).
Figure 1. GluA2 purification imaging and the antagonist-bound closed state structure.
a, FSEC profile for GluA2em showing a monodisperse profile; the inset shows an SDS PAGE gel for pooled fractions following IMAC purification, after thrombin cleavage to remove the GFP fusion protein, and following preparative SEC. b, Representative power spectrum (solid line) overlaid with the computed contrast transfer function (dashed line) for a cryo-EM image (c), with insets highlighting images of individual GluA2 ZK200775 complexes (scale bar 100 nm). d, Representative 2D class averages from the initial classification of 40,709 projection images. e, Isosurface representation of the GluA2 closed state cryo-EM structure at ~ 10 Å resolution segmented to show distal AC (green and blue), and proximal BD (red and yellow) subunits with GluA2cryst (PDB ID: 3KG2) coordinates for the ATD, LBD and TM regions fit separately as rigid bodies; the dashed lines highlight putative membrane boundaries. f, Illustration of the region of the LBD layer that is in close contact with the ATD in GluA2cryst (top panel, cyan shading) that is not observed for GluA2em (LBD layer of experimental cryo-EM density map, and corresponding fits, are shown in the middle and bottom panels, respectively).
Structure of GluA2 in the active state
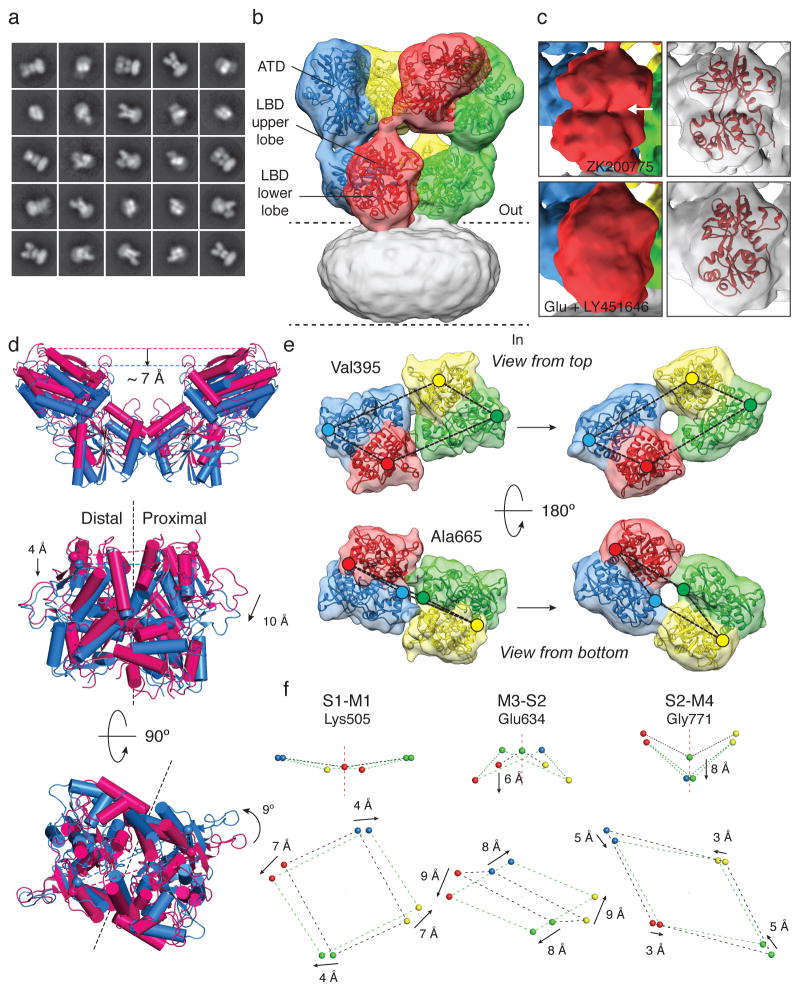
To determine structural changes that occur with transition to the active state, purified GluA2 was pre-mixed with 0.5 mM LY451646, a potent allosteric modulator that prevents entry into the desensitized state16. After equilibration for 30 minutes, a saturating concentration of glutamate (100 mM) was added to activate ion channel gating, followed by immediate plunge freezing. Under these conditions there is very high occupancy of the open state17, and the activation of sub-conductance states which are prominent at low agonist concentrations is reduced18. Analysis of molecular images obtained from AMPA receptors in the active state revealed the presence of well-defined 2D class averages (Fig. 2a), allowing reconstruction of the structure to a resolution of ~ 12 Å with a set of images of similar size and quality to that used to obtain the structure of the closed state (Extended Data Fig. 4). The slightly lower resolution suggests that despite the presence of glutamate at a high concentration, the active state may be more conformationally variable than the closed state, perhaps due to the occurrence of sub-conductance states, or transient excursions to a closed state. Nevertheless, the ATD and LBD domains were fit without ambiguity (Fig. 2b) supported by identification of secondary structure elements (Extended Data Fig. 4). Because ATD and LBD crystal structures provide information at atomic resolution, combining this with the quaternary constraints provided by cryo-EM density maps allows interpretation of structural changes in the full-length receptor at resolutions higher than the nominal resolution of the density map. Although the TMD is not resolved with sufficient detail to allow interpretation of the conformation of TM helices, rigid body fits of ATD dimers and glutamate-bound LBD dimer crystal structures are sufficiently well-constrained by the density map to allow a molecular interpretation of the activation mechanism under conditions where GluA2 has a high open probability (Fig. 2b).
Figure 2. Structural changes accompanying opening of GluA2.
a, Representative 2D class averages of GluA2em in the active state after initial classification of 31,637 projection images. b, GluA2em active state structure shown in isosurface representation, fitted with ATD dimers (PDB ID: 3KG2) and glutamate-bound LBD dimers (PDB ID: 1FTJ) with the transmembrane region covered by micellar density. c, Density maps for a single subunit showing the visible difference between the antagonist-bound open cleft conformation (top) and the glutamate-bound closed cleft conformation (bottom) of the LBD “clamshell”; the right-hand panel shows the corresponding coordinate fits. d, Ribbon and cylinder diagrams for GluA2 coordinates fit to the closed (magenta) and active (blue) states reveal a ~ 7 Å downward displacement of the ATD in the active state (top), with proximal and distal subunit LBD dimer assemblies viewed perpendicular to (middle) and parallel to (bottom) the membrane. Black dashed lines show the approximate planar interface between subunits in the dimer assembly. e, Isosurface views of LBD tetramer region density maps fit with LBD dimers in closed (left) and active (right) states. Colored dots identify the locations of Cα atoms for Val395 (upper lobe) and Ala665 (lower lobe). f, Movement of the S1-M2 linker (Lys505), M3-S2 linker (Glu634), and S2-M4 linker (Gly771) shows how LBD tetramer movements drive channel opening; arrows show the direction of movement from closed to active states.
Comparison of the closed and active state density maps reveals LBD “clamshell” closure (Fig. 2c), as seen for isolated LBD dimers19. Furthermore, a ~ 7 Å vertical contraction of the ATD-LBD assembly is observed, measured as a downwards movement at the top of the ATD tetramer, as well as unanticipated movements in the LBD, in which the dimer pairs rotate about an axis offset from the local axis of 2-fold symmetry (Fig. 2d). The coordinate fits show unambiguous evidence for differential vertical displacement of the proximal A and C subunits, the upper lobes of which move down by ~ 10 Å, as compared to a ~ 4 Å movement of the distal B and D subunits (Fig. 2d). When viewed perpendicular to and into the plane of the membrane, the upper surface of the LBD tetramer assembly rotates counter clockwise, and the lower lobes separate (Fig. 2e). The net result of these movements is a novel corkscrew-like rotation that drives the transition from the closed to the active conformation (Supplementary Movie 1). In contrast to previously reported models for the active state that predicted a substantial decrease in separation of the proximal subunits at the top of the LBD tetramer assembly10,20, we find instead a small increase in proximal subunit separation that accompanies the corkscrew motion, and a 30° increase rather than a decrease10,20 or no change6 in the angle between dimer pairs (Extended Data Table 1b and Supplementary Movie 3).
The off-axis LBD dimer assembly movements described above trigger asymmetric rearrangements of the LBD-TM linkers also not revealed in models generated previously either by replacement of LBD dimers in GluA2cryst with glutamate-bound LBD dimer assemblies6, or by generating tetramer assemblies using crystallographic symmetry operations for LBD dimer structures10,20. The largest conformational change occurs at the end of the M3-S2 linker, for which there is a 33° counter clockwise rotation of the proximal AC subunits, coupled with a clockwise rotation by 20° of the distal BD subunits viewed perpendicular to the plane of the membrane. In addition to the large increase in separation of the M3-S2 linkers within each dimer pair, as first predicted by crystallographic studies on isolated iGluR LBD dimer assemblies19, we find also substantial vertical movements of the M3-S2 and S2-M4 but not S1-M1 linkers, accompanied by a decrease in separation of the AC and BD subunit dimer assemblies for all three sets of linkers (Fig. 2f). For the S1-M1 linker, the dimensions of the twisted parallelepiped connecting the four subunits changes from 30 × 38 Å in the closed state, to 40 × 34 Å in the active state, with minimal vertical movements. For the M3-S2 linker, there is a ~ 6 Å downwards movement of the distal but not proximal subunits, with a change in parallelepiped dimensions from 14 × 40 Å in closed state, to 29 × 36 Å in the active state (Fig. 2f). The S2-M4 linker also undergoes 8 Å and 3 Å downward translations for the proximal and distal subunits, accompanied by a change in parallelepiped dimensions from 40 × 47 Å in closed state, to 38 × 41 Å in the active state. By contrast, in prior models for AMPA receptor active states generated using crystallographic symmetry operations for isolated LBDs10,20, vectors connecting the LBD-ion channel linkers are arranged as planar arrays, without the characteristic twist observed in the activate state EM structure and in the open state model based on GluA2cryst6,12 (see detailed comparison in Extended Data Table 1b and Supplementary Movie 3). Overall, analysis of the GluA2em map reinforces the idea that glutamate triggered movement of the M3-S2 linker unwinds the M3 helix bundle, suggesting how the overall quaternary structural changes enable opening of the ion channel.
GluA2 desensitization mechanism
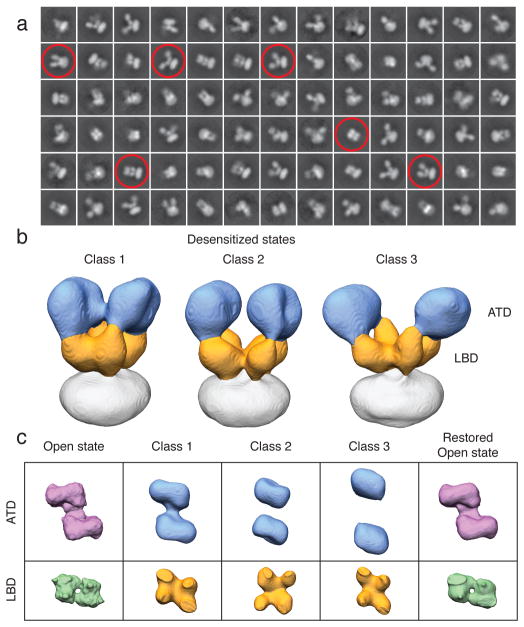
AMPA and kainate receptors exhibit rapid and nearly complete desensitization of ion flux within milliseconds after glutamate binding21. To trap GluA2em in the desensitized state, we incubated the purified protein with 1 mM quisqualate, a full agonist with a Kd of ~ 20 nM and 10-fold higher affinity than glutamate22. Analysis of cryo-electron microscopic images revealed evidence of substantial conformational heterogeneity (Fig. 3a) precluding determination of a single desensitized state 3D structure. Three-dimensional classification enabled separation of three dominant classes at nominal resolutions of 21 Å, 23 Å and 26 Å, with variable degrees of displacement between ATD dimers compared to the closed and active states (Fig. 3b and Extended Data Fig. 5). In all three classes, the LBD layer separates into four lobes of density, with different degrees of separation between the proximal and distal LBD subunits, strikingly different from the “dimer-of-dimers” structure found in the closed and active states. This variability in ATD and LBD conformation is further illustrated in top views that capture the extent of the quaternary structural change in the three desensitized states as compared to the active state (Fig. 3c). It is likely that the three desensitized states are subsets of an even larger spectrum that includes additional weakly populated conformational variants. Nevertheless, our findings establish that desensitization results in separation of the LBD dimers into a quasi 4-fold arrangement, coupled with conformational heterogeneity in the ATD layer not observed for either the closed or active states.
Figure 3. Conformational ensemble of desensitized GluA2.
a, Representative desensitized state GluA2em 2D class averages from initial classification of 35,083 projection images. Selected class-averages that illustrate the range of observed conformations are highlighted. b, Segmented isosurface representations of three distinct desensitized state GluA2em structures, with the ATD and LBD layers identified in blue and orange, respectively. c, Top views of ATD and LBD layers for the three GluA2em desensitized states (middle columns) flanked by those from the active state (left), and restored active state (right).
To determine whether conformational variability observed for quisqualate-GluA2em complexes reflects the properties of functional receptors, we tested whether subsequent addition of 0.5 mM LY451646 to the same preparation used for cryo-EM analysis of the desensitized state would restore a homogeneous active state conformation. Structural analysis at ~ 16 Å resolution of GluA2em receptor suspensions treated this way demonstrates that the active conformation is indeed restored (Fig. 3c and Extended Data Fig. 6). Our experiments thus establish that in the desensitized state, quisqualate-bound GluA2 is fully functional and capable of undergoing conversion to the active state.
GluK2 desensitized state at sub-nanometer resolution
The GluK2 desensitized state map we reported previously, using cryo-electron tomography and sub-volume averaging13, was not at sufficiently high resolution to delineate the structural changes that underlie desensitization. Further, the analysis presented above indicates that obtaining a high-resolution structure of the desensitized state of GluA2 is likely to be technically challenging owing to the intrinsic conformational mobility of the ATD and LBD. GluK2, however, seemed like a more promising candidate given that sub-volume classification of the tomographic data suggested a high degree of conformational homogeneity13, consistent with the 100-fold greater stability of the GluK2 desensitized state revealed by electrophysiological analysis21. We therefore carried out single particle cryo-EM analysis of GluK2 stabilized in the desensitized state by incubation with 2S,4R-4-methylglutamate, a full agonist that binds with 100-fold higher affinity than glutamate23.
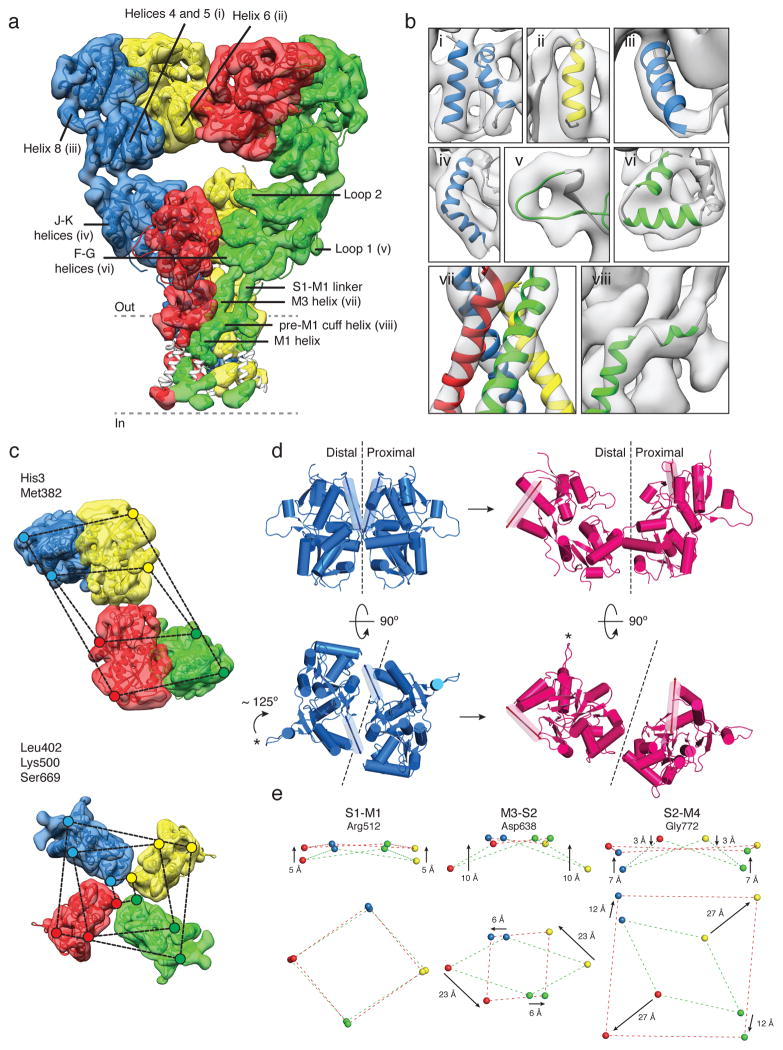
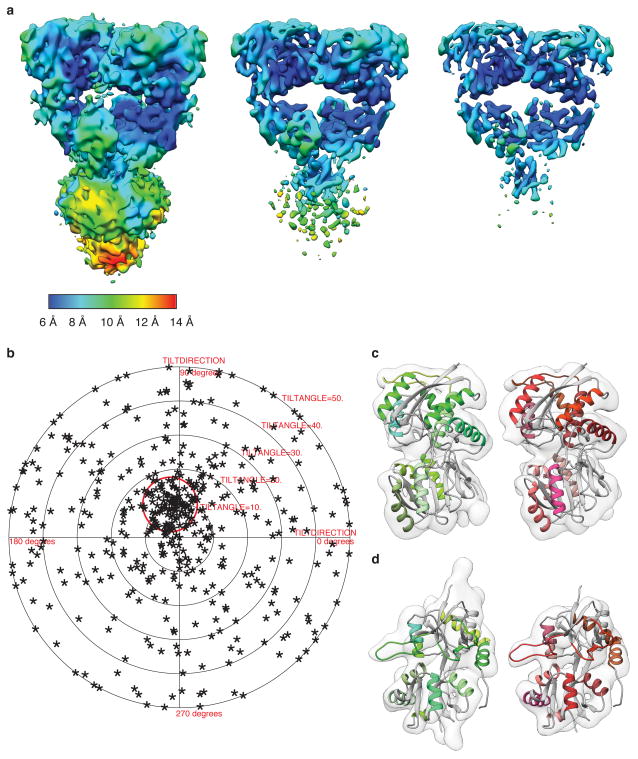
In the structure of the GluK2 desensitized state, determined at ~ 7.6 Å resolution (Fig. 4a, Extended Data Fig. 7 and 8), density was resolved for all α-helices in the ATD and LBD assemblies, and also for the M3 helix bundle, the upper segment of M1 and the pre-M1 cuff helix in the ion channel (Fig. 4b). The density map reveals preservation of 2-fold symmetry in the ATD layer while the LBD layer adopts a quasi 4-fold symmetric arrangement (Fig. 4c). To obtain a molecular model for the desensitized state, we fitted two copies of GluK2 ATD dimer assemblies (PDB ID: 3H6G) and four copies of a GluK2 subunit LBD glutamate complex (PDB ID: 3G3F). The resolution of our map is adequate to unambiguously show that in the desensitized state the ion channel adopts a closed conformation (Fig. 4b, panel vii) in which the M3 helices form a crossed bundle assembly with the pre-M1 helices wrapped around the outside of the channel, similar to that seen for GluA2cryst in its antagonist-bound closed state.
Figure 4. GluK2 receptor desensitization.
a, GluK2 desensitized state density map at ~ 7.6 Å resolution, segmented and colored to show four receptor subunits, fit with coordinates for GluK2 ATD dimers (PDB ID: 3H6G) and glutamate-bound GluK2 LBD monomers (PDB ID: 3G3F). The GluA2cryst TM domain was fit as a rigid body. Portions of TM helices where density was only weakly resolved are shown in white. b, Close-up views of selected regions of the density map labeled in (a). c, Top views of density maps for ATD (upper panel) and LBD (lower panel) layers. Colored dots connected by dashed lines identify the locations of His3 and Met382 at the top and base of the ATD, with the progressively smaller parallelograms for Leu402, Lys500 and Ser669 indicating the top, middle and base of the LBD. d, Structural changes in an LBD dimer assembly underlying the transition from the active (blue) to desensitized (magenta) states presented as side (upper panel) and top (lower panel) views. α-helix J, highlighted as a transparent cylinder, and loop 1, marked by an asterisk illustrate the magnitude of LBD rotation with desensitization. Dashed lines show the approximate location of the planar interface between subunits in the domain dimer. e, Movement of the S1-M2 linker (Arg512), M3-S2 linker (Asp638), and S2-M4 linker (Gly772) indicate how LBD tetramer movements drive channel closure; arrows show the direction of movement from active to desensitized states.
To describe the nature and extent of the conformational changes that occur in the transition from the active to desensitized conformations, we constructed a homology model for the GluK2 active state based on the cryo-EM structure of the GluA2 active state. Comparison of subunit orientations in ligand binding domain dimer assemblies for the GluK2 active state (Fig. 4d left) with those in the desensitized state (Fig. 4d right), reveals that the distal subunits swing clockwise by ~ 125° in the horizontal plane, while the proximal subunits rotate by only ~ 13°. In the vertical plane the distal and proximal subunits tilt 11° and 6° away from the global axis of symmetry. As a result, in the GluK2 desensitized state the LBD layer resembles an inverted pyramid in which the four subunits are arranged with quasi 4-fold symmetry. The ATD-LBD linkers which mediate the 2-fold to 4-fold symmetry transition easily support these large movements, with less than a 1 Å increase in distance between the Ca atoms of Met 382 and Leu 402 which connect the ATD and LBD for the A and C subunits, and a 5–6 Å decrease in separation for the B and D subunits. Rupture of LBD dimer assemblies, in which the distance between the Lys 500 Ca atoms at the location of a conserved intermolecular salt bridge in the upper lobe increases by 40 Å in the desensitized state, is in good agreement with both surface accessibility measurements in GluA224, and the effect on the kinetics of desensitization of mutations that alter the Kd for the GluK2 LBD dimer assembly25,26.
Visualization of the probable trajectory of the distal subunit along the arc that it sweeps to transition from the active to desensitized states (Supplementary Movie 2) suggests an explanation both for the previously reported crystal structures of cross-linked GluA2 dimers24, and for the heterogeneous conformations observed for the GluA2 desensitized state (Fig. 3). Superposition of a proximal subunit of the GluK2 desensitized state tetramer with the proximal subunit from each of the three GluA2 disulfide cross linked dimer assemblies (previously proposed to represent the desensitized conformation24) suggests that that these crystallized conformations are structural intermediates where further movement is prevented by disulfide cross links. Taken together, these observations reinforce the idea that AMPA and kainate receptors desensitize by a conserved mechanism. Notably, due to the substantial reorganization of the LBD, residues in α-helix G, but from different subunit combinations, are in close proximity in both closed and desensitized states, providing an explanation for recent biochemical cross-linking studies on GluA2 that failed to detect state dependent trapping at these positions10.
How does this rearrangement of the LBD impact the ion channel? In both the desensitized state and the antagonist-bound state the ion channel has a closed conformation. However, in the desensitized state the linkers connecting the LBD to the channel adopt ~ 4-fold symmetric arrangements, with changes in dimensions of the parallelograms formed by the S1-M1, M3-S2 and S2-M4 linkers from 41 × 25 Å, 43 × 15 Å, and 46 × 36 Å in the active state, to nearly symmetric values of 34 × 37 Å, 24 × 26 Å and 60 × 56 Å, respectively, in the desensitized state (Fig. 4e). Most notably, the origin of rotation for the four subunits in the transition from the active to desensitized state is located close to the S1-M1 linker, such that the M3-S2 and S2-M4 linkers rotate clockwise around S1-M1, with a much larger radial sweep for the distal versus proximal subunits. In the vertical plane, the three TM linkers for the distal subunits move upwards by 5, 10 and 7 Å (Fig. 4e) relieving the downwards movements that occur in the transition from the closed to the active state (Fig. 2f). However, in the desensitized state the linkers adapt a planar arrangement, strikingly different from the closed state in which the TM linkers form twisted parallelepipeds6. Despite these large movements, measurement of the change in distance between the Ca atoms of Arg512 and Val521, Val630 and Asp638, and Gly772 and Val786, reveals that in the desensitized state the S1-M1, M3-S2 and S2-M4 linkers increase in length by only 4–5 Å for the proximal A/C subunits, while for the distal B/D subunits the M3-S2 and S2-M4 linker length decreases by 3 Å.
Molecular mechanism of receptor gating
AMPA and kainate receptors are widely regarded as functionally and structurally related families. Our study exploited the availability of unique AMPA receptor allosteric modulators to trap GluA2 in the active state, while the greater thermodynamic stability of the GluK2 desensitized state yielded a higher resolution structure than could be achieved for GluA2em. Based on the similarity observed in the LBD layer in the desensitized states of both GluA2em and GluK2, we conclude that transition to quasi 4-fold symmetry in the LBD layer is a key structural signature of desensitization in these iGluR families. Based on these similarities, we propose a unified description of the structural changes that occur during the gating cycle of receptors in the iGluR family (Fig. 5). Several lines of evidence justify this approach: after genetic removal of the ATD, both GluA2 and GluK2 display gating properties that are similar to those of the parent receptors27–29, with activation and desensitization on the millisecond time scale, indicating that the conformational change underlying activation and desensitization occurs primarily in the LBD and ion channel assemblies, independent of conformational variability in the ATD. Consistent with this observation, numerous crystallographic studies of soluble GluA2 and GluK2 LBDs have established essentially identical sets of structures and extents of movement for complexes with agonists and antagonists30. In the ion channel domain, GluA2 and GluK2 share 73% amino acid sequence similarity, and exhibit common functional properties including prominent sub-conductance states1, similar relative permeability to sodium and calcium ions31, and channel block by cytoplasmic polyamines32.
Figure 5. Unified view of glutamate receptor gating cycle.
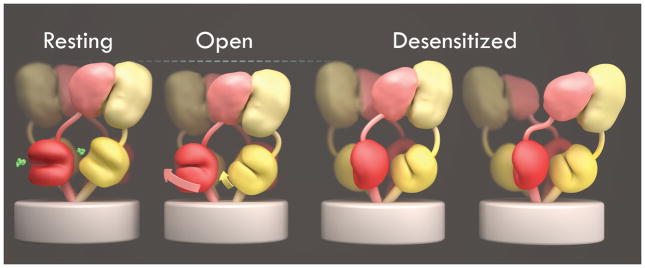
a, Schematic summary of global conformational changes highlighting domain movements with channel opening and closure during the receptor gating cycle. The dashed lines over the open state indicate the shortening as a result of the corkscrew rotation that opens the channel. The differences observed between desensitized states of GluK2 and GluA2 are illustrated as variations of a common theme in which the LBD layer shifts to 4-fold symmetry with or without separation of the ATD dimer pairs.
Binding of glutamate triggers both clamshell closure and a rotation of LBD dimer assemblies; this necessitates compensatory movement elsewhere in the protein. As a result, the upper lobes of the LBD pull “down” the ATD layer, while the lower lobes of the LBD exert both lateral and upward forces to open the channel. Strain in the open state is released by transition to a desensitized state in which the channel closes with the LBD remaining in the closed-cleft, glutamate-bound conformation. How does the receptor, in its desensitized state, simultaneously accommodate both a closed cleft, which introduces molecular tension, and a closed channel, which requires release of tension? We answer this puzzle by showing that in the desensitized state, the LBD layer undergoes a dramatic rearrangement featuring a 2-fold to 4-fold symmetry change. The resulting 4-fold symmetry in the LBD layer matches that of the ion channel in its non-conducting state, and thereby permits the channel to adopt a low energy conformation. In this way, ligand dissociation kinetics are decoupled from channel activation and deactivation.
It is notable that while both AMPA and kainate receptors adopt 4-fold symmetry in their desensitized LBD layers, AMPA receptor desensitization also causes a disruption of the ATD layer. This result can be understood by considering symmetry mismatch within the receptor, and changes in symmetry during the gating cycle. In the closed and open states, both the ATD and LBD layers have 2-fold symmetry. The strain resulting from agonist binding to the LBD is centered near the LBD-TM interface and is sufficient to open the channel. In the desensitization step, the LBD layer shifts from 2-fold to 4-fold symmetry, matching the 4-fold symmetry of the ion channel; the strain in the receptor now shifts to the 2-fold symmetric ATD. In GluK2, the ATD assembly appears to be able to withstand this strain, possibly relieving it by a drawbridge-like tilting at the ATD tetramer interface. However, in GluA2, this symmetry mismatch places sufficient strain on the ATD layer to disrupt the tetramer interface. This hypothesis is supported by measurements of subunit interactions by analytical centrifugation for isolated ATDs that reveal much weaker interactions of GluA2 ATD dimers than GluK2 ATD dimers33–35.
A central value of single particle cryo-EM methods used here is that they enable definition of functionally important large scale receptor structural changes without the constraints introduced by disulfide cross links or crystal lattice contacts, and lay the foundation for screening potential receptor-drug interactions. At the same time, the need to use detergents36 or amphipols37,38 to stabilize membrane proteins for structural analysis has the potential to disrupt functionally important protein-lipid interactions39,40. Whether this impacts ligand gated ion channel structures is an important area for future research. Other challenging problems include obtaining a structural understanding of how glutamate receptor activation, at lower agonist concentrations than used in the present study, leads to sub-conductance states18. In addition, it will be important to explore central mechanistic questions such as how individual LBDs move independently during the activation process11, how gating occurs in heteromeric iGluR assemblies such as NMDA receptors, and whether the extent of cleft closure, which varies for partial agonists, has any consequence on either open state or desensitized state structures41,42.
Methods
Protein expression, purification and conformational trapping
The rat GluA2flip subunit cDNA sequence (P42262) including the native signal peptide was cloned into the pFastBac1 vector for baculovirus expression in Sf9 insect cells. The GluA2em construct contained the R586Q and C589A point mutations and was truncated at K826 to improved yield and tetramer stability. GluA2em differs from GluA2cryst by restoration to the wild type sequence of six residues in the ATD-LBD linker, 4 N-linked glycosylation sites, and four residues in loop 1 of the LBD. Likewise, the full-length rat GluK2 subunit cDNA sequence (P42260) including the native signal peptide and the carboxy terminal domain was cloned into the pFastBac1 vector; the construct was RNA edited at position 536 (I to V) and had two mutations (C545V (M1) and C564S (M1-M2 loop)) which increased yield and tetramer stability. In the LBD, four mutations (A47T, A658S, N690S and F704L), which convert the sequence to that found in GluK1, were introduced to create a high affinity binding site for the GluK1 selective antagonist LY46619543. For fluorescence detection44 and affinity purification, a thrombin recognition site and linker sequence (GLVPRGSAAAA) was inserted between GluA2 and GluK2 and the coding sequence for the A207K dimerization suppressed EGFP mutant, with a C-terminal SGLRHis8 affinity tag. Sf9 cells (12 liters) were harvested 72 hours after infection, collected by low speed centrifugation, and frozen at −80°C. Cell pellets were resuspended in ice-cold buffer (18–20 mL/liter) containing 150 mM NaCl, 50 mM Tris, pH 8.0, 0.8 μM aprotinin, 2 μg/mL leupeptin, 2 μM pepstatin and 1 mM PMSF, and then disrupted on ice using a QSonica Q700 sonicator (18 × 15 sec, power level 7). The lysates were clarified by low speed centrifugation, and membranes collected by ultracentrifugation (Ti45 rotor, 40k rpm, 45 min), followed by mechanical homogenization, and solubilization for 1 hour at 4°C in buffer containing 150 mM NaCl, 20 mM Tris pH 8.0, 50 mM n-dodecyl-β-D-maltopyranoside (DDM) and 8.5 mM cholesterol hemisuccinate (CHS) for GluA2, and DDM alone for GluK2. Insoluble material was removed by centrifugation (Ti45 rotor, 40 K rpm, 45 mins) and cobalt-charged TALON metal affinity resin (20 mL) was added to the supernatant together with 10 mM imidazole. After binding for 90 min at 4°C the resin was packed in a column, washed with buffer containing 150 mM NaCl, 20 mM Tris pH 8.0, 0.75 mM DDM, 40 mM imidazole (with 0.12 mM CHS added for GluA2) until the OD at 280 nm reached a stable low value, and then eluted with an increase to 250 mM imidazole. Peak fractions were digested overnight at 4°C with thrombin at a 1:100 w/w ratio. GluA2 and GluK2 tetramers isolated by gel filtration chromatography (Superose 6 10/300) in a buffer containing 150 mM NaCl, 20 mM Tris pH 8.0, 0.75 mM DDM, and for GluA2 0.12 mM CHS, were concentrated to 2 mg/mL (100 kD MWCO), and then stored on ice to trap the desired conformational state. For GluA2, 0.3 mM ZK200775 ([[3,4-Dihydro-7-(4-morpholinyl)-2,3-dioxo-6-(trifluoromethyl)-1(2H) quinoxalinyl]methyl]phosphonic acid) was added to stabilize the closed state; to trap the open state, 0.5 mM LY451646 (N-[(2R)-2-(4′-Cyano[1,1′-biphenyl]-4-yl)propyl]-2-propanesulfonamide) was allowed to bind for 30 min prior to addition of 100 mM glutamate, with 15 seconds elapsing before sample vitrification; to trap the desensitized state 1 mM quisqualate was allowed to bind for 20 min prior to vitrification; to reverse desensitization, 0.5 mM LY451646 was added to the quisqualate bound protein and allowed to equilibrate for 30 min prior to vitrification; for GluK2, the desensitized state was trapped using 1 mM 2S,4R-4-methylglutamate, as described previously13. Attempts to use the allosteric modulator concanavalin A to trap a GluK2 open state were unsuccessful due to aggregation of the receptor-lectin complex.
Specimen vitrification and cryo-electron microscopy
Vitrified specimens were prepared by adding 2.5 μL of liganded GluA2 or GluK2 at 1.8 mg/mL to R2/2 holey carbon grids (Quantifoil, Jena, Germany) rendered hydrophilic by chemical treatment (J. R. M, P. R., J. K., S. C., J. P., M. L. M. and S. S., manuscript in preparation). Grids were blotted for 2 seconds, then plunge-frozen in liquid ethane using an FEI Vitrobot Mk IV (FEI Company, Hillsboro, OR), with the chamber maintained at 22°C and 100% humidity. Following vitrification, grids were post-mounted into autoloader cartridges and transferred to the microscope. Cryo-EM imaging was done on an FEI Titan Krios microscope (FEI Company, Hillsboro, OR) operated at 300 kV, aligned for parallel illumination, and equipped with a high-brightness XFEG and Cs corrector. Projection images were acquired as seven-frame movies with a 4,096×4096 back-thinned Falcon II CMOS detector at a nominal magnification of 47,000×, corresponding to a pixel size of 1.406 Å at the specimen plane. Imaging was carried out using FEI EPU automated data-acquisition software to collect approximately equal numbers of images at nominal focus values of −2.0, −2.5, −3.0, and −3.5 μm, and with a dose rate and exposure time of 20 e/Å2/sec and 3.5 sec, respectively.
Image processing
Un-binned image stacks were corrected for drift and beam-induced motion by alignment using cross-correlation as implemented in IMOD tiltxcorr45. Particles were manually identified and selected using the program e2boxer in the EMAN2 program suite46. Integrated and un-integrated versions of aligned multi-frame images were processed in the framework of Relion (version 1.2)47. The integrated images were used for CTF estimation with CTFFIND348 as implemented in the Relion workflow. Extracted particles were normalized, and subjected to 25 rounds of both iterative 2D classification (regularization parameter T=2) and 3D classification (T=4) with C2 symmetry imposed. Un-interpretable, low-population, or poorly defined classes were discarded at both stages. Single particles were then processed using the Relion auto-refine routine until convergence, at which point frames corresponding to a combined dose of ~ 25 e/Å2 were substituted for the integrated frames, and used for final refinement. Density maps were B-factor corrected in Relion and “gold-standard” FSC resolution plots were calculated using the EMAN2 program e2proc3d46 with a soft shape mask applied to independent unfiltered half maps from Relion. To visualize variation in resolution across the maps, the blocres utility49 was used to calculate local resolution maps and color the density maps accordingly. The desensitized GluA2 maps were not visualized in this way as their low resolutions limit interpretation to qualitative terms. Three-dimensional image processing for all conformational states was bootstrapped using a 60 Å resolution map of the GluK2 receptor determined by cryo-electron tomography and sub-volume averaging13 as an initial model. Extended Data Table 1a contains the number of micrographs and the number of particles used at all stages of image processing.
Structural analysis
Fitting of coordinates into density maps, segmentation and visualization were all carried out using UCSF Chimera50. Measurement of inter-subunit distances was done using Cα atoms at reference points. For GluA2 and (GluK2), Ser5 (His3) in beta strand 1 locates the top of the ATD; Ile203 (Leu212), at the base of helix 7 measures the distance between the proximal B and D subunits in the ATD dimer of dimers interface; Leu378 (Met382) in beta strand 15 defines the base of the ATD, preceding the ATD-LBD linker. After the ATD-LBD linker Val395 (Leu402) in beta strand 1 locates start of the LBD; Lys493 (Lys500) in the loop between beta strands 6 and 7 defines the intermolecular salt bridge that links the upper lobes of dimer pairs formed by the AD and BC subunits; Ala665 (Ser669) defines the start of helix G in the lower lobe. To locate start of the LBD-TM linkers we followed the selections used for GluA2cryst6. We used Lys505 (Arg512) in beta strand 7 for S1-M1; Glu634 (Asp638) at the C-terminus of alpha helix E for M3-S2; and Gly771 (Gly772) adjacent to the LBD conserved disulfide bond for S2-M4. We chose these positions cognizant of the fact that ATD and LBD crystal structures we fit to EM maps were engineered, replacing the ion channel and LBD-TM linkers in the LBD with a GT dipeptide. We established by superposition of GluA2 ATD, LBD agonist and LBD antagonist complex crystal structures on GluA2cryst, that these reference positions were not perturbed in the soluble ATD and LBD crystal structures; then, by superposition of GluK2 ATD and LBD crystal structures we identified structurally equivalent positions in GluK2. Structural analysis was done on domain coordinates that were rigid body fit into cryo-EM density maps. The reproducibility of rigid body fits was established by using a coordinate orientation randomization scheme. First, domain rotation was randomized between +/- 10° on all three axes, and the translation randomized by +/- 10 pixels (14.1 Å) on all three axes. The coordinates were then re-fitted, and then saved as a new PDB file. This was repeated five times and the RMSD value between the structures was found to be well below 1 Å. This indicated that map quality was high enough to permit the Chimera fitting routine to converge on the same minima reproducibly. The final maps for GluA2 in the open state and GluK2 in the desensitized state were validated using the tilt-pair parameter plot51 using pairs of images at zero tilt (first exposure) and 10° tilt (second exposure). Using the final refined versions of the respective density maps as the reference 3D model, orientations of manually selected particles were assigned using FREALIGN and plotted using the TILTMULTIDIFF program51.
Extended Data
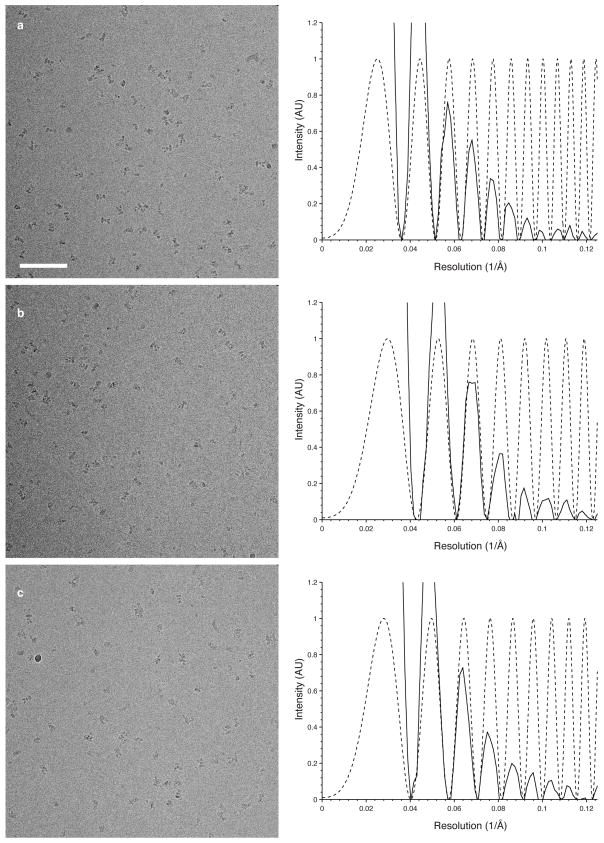
Extended Data Figure 1. Cryo-electron microscopic imaging of GluA2 with ZK200775.
a–c, A series of representative images of GluA2 bound by the competitive antagonist ZK200775 (left panels), with corresponding power spectra and CTF estimates showing signal beyond 8 Å resolution (right panels, solid and dotted lines, respectively). Defocus values are 3.7, 2.7, and 3.0 μm for the three images, respectively. Scale bar is 100 nm.
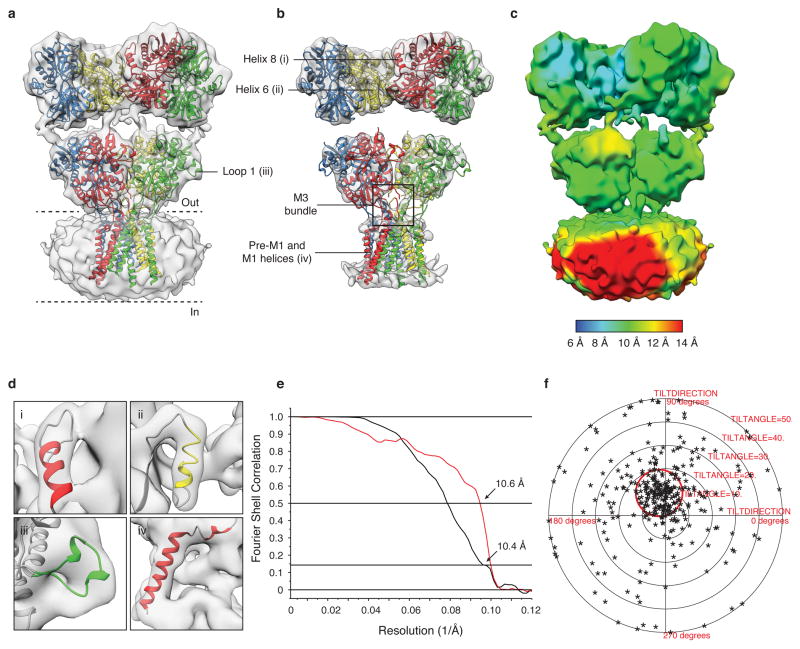
Extended Data Figure 2. Antagonist-bound closed state GluA2 density map quality and resolution.
a,b, GluA2em antagonist-bound closed state density map with coordinates for ATD dimers, LBD dimers, and the TMD tetramer independently fit to the map. All coordinates were derived from PDB ID: 3KG2. In panel (b) the density map is shown at a higher contour than (a) to highlight the closeness of fit between X-ray coordinates and the density map in the ATD and LBD layers. The density for the ATD-LBD linker region is weaker than that in the rest of the map and is therefore not visible at this threshold. The black bounding box in (b) identifies the M3-helix bundle crossing visible in the density map. c, Visualization of density map to highlight variation in resolution across different regions of the map. The estimated resolution value is color-coded using the scale shown at the bottom edge of the panel. d, Expanded versions of selected regions of map. Roman numerals identify helices 6 and 8, loop 1, and the pre-M1 and M1 helices as indicated in panels (a) and (b). e, A set of plots that include gold-standard FSC plot (black line) for the GluA2em antagonist-bound closed state density map showing a resolution of 10.4 Å at an FSC value of 0.143, and a plot (red line) of the FSC between the experimentally obtained cryo-EM density map and a map computed from the fitted coordinates, which displays a resolution of 10.6 Å at an FSC value of 0.5, consistent with the gold-standard FSC curve. f, Validation of density map using tilt-pair parameter plot. The spread in orientational assignments around the known goniometer settings is within ~ 25° for > 80 % of the selected particle pairs, with clear clustering observed at the expected location, centered at a distance of 10° from the origin.
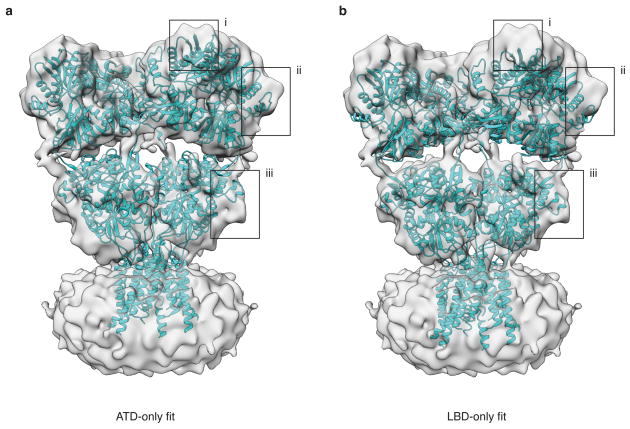
Extended Data Figure 3. Assessment of correspondence between GluA2em and GluA2cryst.
a,b, Density map of antagonist-bound closed state GluA2em with rigid body fits of GluA2cryst (PDB ID: 3KG2) reveals separation between the ATD and LBD layers in GluA2em that is absent in GluA2cryst due to deletion of six residues in the ATD-LBD linker. In (a), GluA2cryst fitting was performed using only ATD tetramer coordinates, which reveals a good fit of the ATD layer, but at the expense of a loss of fit of the LBD assembly. Conversely, in (b) fitting was performed using only LBD tetramer coordinates, which reveals a good fit of the LBD layer, but at the expense of a loss of fit of the ATD assembly. The black boxes highlight examples of regions where the mismatches are clearly evident.
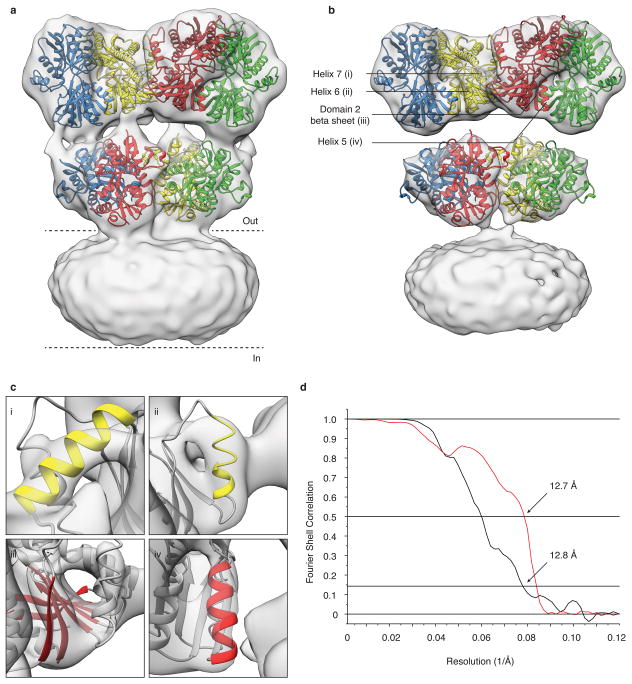
Extended Data Figure 4. Open state GluA2 density map quality and resolution.
a,b, Density map of glutamate bound GluA2em in the open state with coordinates for ATD dimers (PDB ID: 3KG2) and glutamate-bound LBD dimers (PDB ID: 1FTJ) fit separately into the map. In panel (b) the density map is shown at a higher contour than (a) to highlight closeness of fit between X-ray domain coordinates and the density map. c, Secondary structural features from ATD chains B/D of the density map corresponding to regions marked in panel (b). Roman numerals identify helices 5, 6, 7 and the ATD lower domain beta sheet. d, Gold-standard FSC plot (black line) for the GluA2em open state density map showing a map resolution of 12.8 Å at an FSC value of 0.143, and a plot (red line) of the FSC between the experimentally obtained cryo-EM density map and a map computed from the fitted coordinates, which displays a resolution of 12.7 Å at an FSC value of 0.5, consistent with the gold-standard FSC curve.
Extended Data Figure 5. Desensitized state GluA2 density map classes and resolutions.
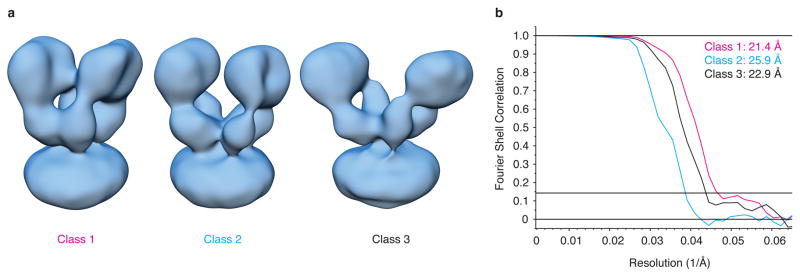
a, Three quisqualate bound GluA2em desensitized state classes resolved through 3D classification. The maps are the same as those presented in Fig. 2b, but without segmentation to identify the ATD and LBD regions. b, Gold-standard FSC plots for the GluA2em desensitized state density maps showing resolutions of 21.4 Å, 25.9 Å, and 22.9 Å for classes 1, 2 and 3, respectively at an FSC value of 0.143.
Extended Data Figure 6. Restored open state density map for the GluA2 Quisqualate complex.
a, Density map for the GluA2em open state obtained by addition of the allosteric modulator LY451646 to a suspension of quisqualate-bound, desensitized GluA2. The purpose of the experiment was to test whether structural changes resulting from quisqualate binding to generate the desensitized state could be reversed by addition of an excess of the allosteric modulator LY451646, used to stabilize the open state. The map display shown at left is color-coded to highlight variation in resolution across different regions of the map. b, Density map for the glutamate bound open state obtained by addition of LY451646 30 min prior to agonist, as shown in Figure 2. The map display shown at left is color-coded as in (a) to highlight variation in resolution across different regions of the map. Comparison of the two maps and the fits of ATD and LBD dimers shows that they are essentially identical, establishing the conformational changes that occur with desensitization are reversible and can be modulated by allosteric modulators.
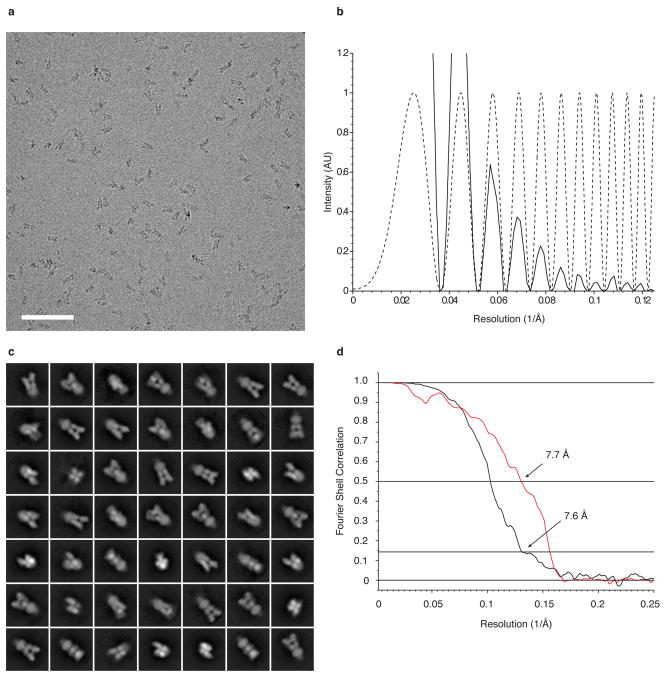
Extended Data Figure 7. Cryo-electron microscopic imaging of GluK2 with 2S,4R-4-methylglutamate and 2D classes.
a,b, Representative cryo-EM image of GluK2 bound by the agonist 2S,4R-4-methylglutamate (leftmost panel), with the corresponding image power spectrum and CTF estimate showing signal beyond 8 Å resolution (rightmost panel, solid and dotted lines, respectively). The defocus value of the image is 3.7 μm. Scale bar is 100 nm. c, Two-dimensional classes of desensitized GluK2 particles subjected to single particle analysis. d, Gold-standard FSC plot (black line) for the GluK2 desensitized state density map showing a map resolution of 7.6 Å at an FSC value of 0.143. A plot (red line) of the FSC between the experimentally obtained cryo-EM density map and a map computed from the fitted coordinates, displays a resolution of 7.7 Å at an FSC value of 0.5, consistent with the gold-standard FSC curve.
Extended Data Figure 8. Resolution of the desensitized GluK2 density map.
a, GluK2 desensitized state map shown at increasing contour levels from left to right, to better highlight selected secondary structural features. b, Validation of density map using tilt-pair parameter plot. The spread in orientational assignments around the known goniometer settings is within ~ 25° for > 60 % of the selected particle pairs, with clear clustering observed at the expected location, centered at a distance of 10° from the origin. c, Distal (left) and proximal (right) ATD subunits fit with the corresponding X-ray coordinates (PDB ID: 3H6G). d, Proximal (left) and distal (right) LBD subunits fit with the corresponding X-ray coordinates for glutamate-bound GluK2 LBD monomers (PDB ID: 3G3F). The close similarity in density maps for the individual ATD and LBD monomers of distal and proximal domains that are unrelated by computationally imposed C2 symmetry shows that the LBD monomers move largely as rigid bodies and that the structural changes that occur with desensitization can be described adequately by rigid body movements of the ATD and LBD monomers.
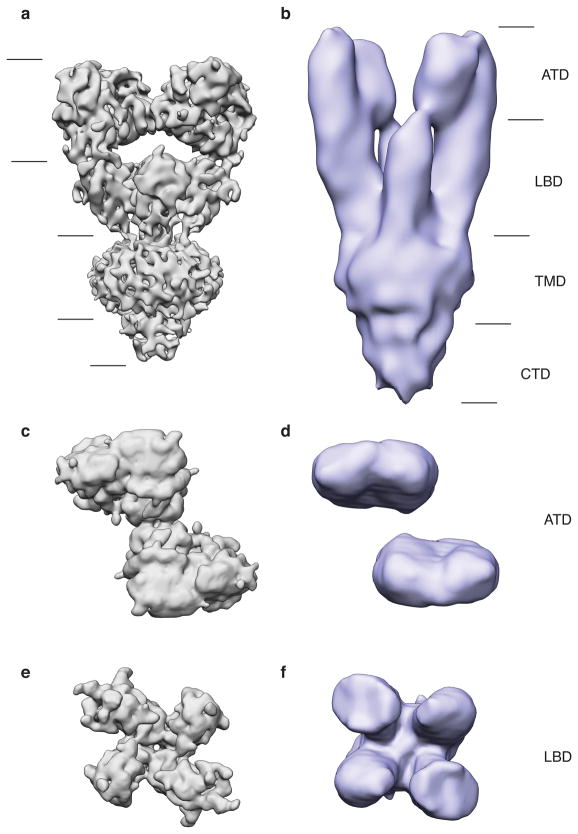
Extended Data Figure 9. Comparison between single particle and tomographic reconstructions of desensitized GluK2.
a,b, Single particle reconstruction of desensitized GluK2 (a) shown adjacent to the previously reported structure from sub-volume averaging (b). The overall envelope of the two structures are the same, but there is a difference in their length. This difference can be accounted for by considering the effect of the missing wedge on the tomographic structure in (b). c-f, When the two receptor structures are viewed looking down the receptor axis from the extracellular side, ATD layers (c,d) and LBD layers (e,f) can be seen to have the same arrangement. The ATD layer from the single particle structure indicates contact within the ATD tetramer interface (c), and also between LBD monomeric domains (e). As a consequence of the missing wedge in the sub-tomogram average structure, lateral connectivity in the ATD layer (d) and LBD layer (f) is less evident.
Supplementary Material
Extended Data Table 1a | Data collection and image processing statistics
Results of image processing of GluA2 and GluK2 density maps included in the study. The table shows (from left to right): (i) the number of micrographs used for image processing, (ii) the number of particles manually designated in the micrographs, (iii) the number of particles retained after 2D classification and (iv) the number of particles retained after 3D classification and used for structure refinement.
Extended Data Table 1b | Comparison of GluA2em active state cryo-EM structure with previous computational models
A comparison of the GluA2em active state LBD tetramer assembly (row 1) with prior active state computational models (rows 2–6) was performed using three different measures: (i) by calculating the angle between dimer assemblies determined using vectors from the global center of symmetry at the level of A665 CA atoms to V395 CA atoms in the proximal (AC) subunits (“Dimer Angle”), (ii) the distance between dimer pairs using proximal (AC) subunit V395 CA coordinates at the top of the LBD tetramer assembly (“V395 Distance”) and (iii) the cross-correlation between the GluA2em active state cryo-EM density map and various models (“Correlation between EM map and model”). Model 1 was created as described6, by superimposing two copies of GluA2 LBD glutamate complex dimers (PDB ID: 1FTJ) on GluA2cryst, using domain 1 coordinates (RMSD 0.31 Å). Model 2 was created as described20, generating a GluA2 LBD tetramer assembly by crystallographic symmetry operations from PDB ID: 1FTJ. Model 3, GluA2 (4L17) is the activation intermediate tetramer assembly generated by crystallographic symmetry operations from PDB ID: 4L17, for which the B and D subunit DNQX-bound protomers were replaced by glutamate bound protomers (PDB ID: 1FTJ) as described previously10. Models 4 and 5 are two different glutamate-bound, GluA2 LBD tetramer assemblies generated by crystallographic symmetry operations from PDB ID 3H6W52. Quaternary structural changes were visualized using PyMol53. Morphs comparing the GluA2em active state LBD tetramer assembly with models 1–3 are shown in Supplementary Movie 3.
Conformational changes that occur upon transition of GluA2 in the antagonist-bound closed state to the glutamate-bound open state. Crystal structure coordinates are colored with protomers A, B, C, and D in green, red, yellow and blue, respectively. α-helix G of each LBD is colored in orange. The trajectory was computed using the morph utility in PyMol by interpolation from the initial and final states derived from fitting atomic coordinates to cryo-EM density maps using UCSF Chimera.
Conformational changes that occur in the LBD tetramer assembly upon transition of GluK2 in the glutamate-bound active state to the glutamate-bound desensitized state. Crystal structure coordinates are colored with protomers A, B, C, and D in green, red, yellow and blue, respectively. α-helix G of each LBD is colored in orange. The trajectory was computed using the morph utility in PyMol by interpolation from the initial and final states derived from fitting atomic coordinates to cryo-EM density maps using UCSF Chimera.
Comparison of structural changes in the GluA2 LBD tetramer assembly for the GluA2em active state structure, and models created in prior studies. Crystal structure coordinates are colored with protomers A, B, C, and D in green, red, yellow and blue, respectively. For GluA2em and models 1–3 trajectories from the antagonist-bound closed state to the glutamate bound active state were computed using the morph utility in PyMol. Model 1 was created by superimposing two copies of GluA2 LBD glutamate complex dimers (PDB ID: 1FTJ) on GluA2cryst, using domain 1 coordinates (RMSD 0.31 Å); note that different from the GluA2em active state, the upper lobes of the LBD do not move. Model 2 was created by generating a GluA2 LBD tetramer assembly with crystallographic symmetry operations starting from PDB ID: 1FTJ; note that the upper lobes move closer together, and that in the active state the assembly assumes a flat structure in which the dimers are arranged as parallel arrays. Model 3 is the activation intermediate tetramer assembly generated by crystallographic symmetry operations from PDB ID 4L17, for which the B and D subunit DNQX-bound protomers were replaced by glutamate bound protomers (PDB ID 1FTJ); note that similar to model 2, the upper lobes move closer together, and that in the active state, the assembly assumes a flat structure in which the dimers are arranged as parallel arrays.
Acknowledgments
This work was supported by the intramural programs of the NCI, and NICHD, NIH, the IATAP program at NIH and the NIH-FEI Living Lab for Structural Biology. We thank Dr. David Bleakman, Eli Lilly and Company for the gift of LY451646, Dr. Ye Jin Eun, for helpful discussions on preparation of cryo-EM samples, Dr. Xiongwu Wu for helpful discussions on fitting crystallographic coordinates to cryo-EM maps, Donald Bliss for assistance with preparing schematic illustrations, Drs. Lesley Earl, Mario J. Borgnia and Jacqueline Milne for helpful discussions, and Steve Fellini, Susan Chacko and their colleagues for continued support with use of the Biowulf cluster for computing at NIH.
Footnotes
Author Contributions
JRM, MLM and SS were involved in all stages of design of experiments and interpretation of the results; JK and SC carried out protein purification; PR, JP and JRM carried out data collection; PR, JP, JRM, AB and SS established workflows for data collection and handling; JRM carried out image processing and 3D structure determination; AB carried out tilt pair plot analysis; JRM and MLM carried out detailed comparative analysis of cryo-EM structures with X-ray crystallographic studies of glutamate receptors; JRM, MLM and SS integrated all of the data, analysis of the implications and mechanism, and wrote the manuscript.
Supplementary Information is linked to the online version of the paper at www.nature.com/nature.
Cryo-EM density maps for GluA2em with ZK200775, GluA2em with LY451646 and glutamate, GluA2em with Quisqualate classes 1–3, GluA2em with Quisqualate and LY451646, and GluK2 with 2S,4R-4-methylglutamate, have been deposited in the EM Data Bank under accession codes xxxx, xxxx, xxxx, xxxx, xxxx, xxxx, and xxxx. Atomic coordinates for molecular models of GluA2em with ZK200775, GluA2em with LY451646 and glutamate, and of GluK2 with 2S,4R-4-methylglutamate (with separate models for the ATD/LBD and TMD) have been deposited in the Protein Data Bank under accession codes xxxx, xxxx, xxxx, and xxxx.
The authors declare no competing financial interests.
Reprints and permissions information is available at www.nature.com/reprints.
References
- 1.Traynelis SF, et al. Glutamate receptor ion channels: structure, regulation, and function. Pharmacol Rev. 2010;62:405–496. doi: 10.1124/pr.109.002451. [DOI] [PMC free article] [PubMed] [Google Scholar]
- 2.Huganir RL, Nicoll RA. AMPARs and synaptic plasticity: the last 25 years. Neuron. 2013;80:704–717. doi: 10.1016/j.neuron.2013.10.025. [DOI] [PMC free article] [PubMed] [Google Scholar]
- 3.Colquhoun D, Jonas P, Sakmann B. Action of brief pulses of glutamate on AMPA/kainate receptors in patches from different neurones of rat hippocampal slices. J Physiol (Lond) 1992;458:261–287. doi: 10.1113/jphysiol.1992.sp019417. [DOI] [PMC free article] [PubMed] [Google Scholar]
- 4.Furukawa H. Structure and function of glutamate receptor amino terminal domains. J Physiol. 2011;590:63–72. doi: 10.1113/jphysiol.2011.213850. [DOI] [PMC free article] [PubMed] [Google Scholar]
- 5.Mayer ML. Emerging models of glutamate receptor ion channel structure and function. Structure. 2011;19:1370–1380. doi: 10.1016/j.str.2011.08.009. [DOI] [PMC free article] [PubMed] [Google Scholar]
- 6.Sobolevsky AI, Rosconi MP, Gouaux E. X-ray structure, symmetry and mechanism of an AMPA-subtype glutamate receptor. Nature. 2009;462:745–756. doi: 10.1038/nature08624. [DOI] [PMC free article] [PubMed] [Google Scholar]
- 7.Nakagawa T, Cheng Y, Ramm E, Sheng M, Walz T. Structure and different conformational states of native AMPA receptor complexes. Nature. 2005;433:545–549. doi: 10.1038/nature03328. [DOI] [PubMed] [Google Scholar]
- 8.Plested AJ, Mayer ML. AMPA receptor ligand binding domain mobility revealed by functional cross linking. J Neurosci. 2009;29:11912–11923. doi: 10.1523/JNEUROSCI.2971-09.2009. [DOI] [PMC free article] [PubMed] [Google Scholar]
- 9.Landes CF, Rambhadran A, Taylor JN, Salatan F, Jayaraman V. Structural landscape of isolated agonist-binding domains from single AMPA receptors. Nat Chem Biol. 2011;7:168–173. doi: 10.1038/nchembio.523. [DOI] [PMC free article] [PubMed] [Google Scholar]
- 10.Lau AY, et al. A conformational intermediate in glutamate receptor activation. Neuron. 2013;79:492–503. doi: 10.1016/j.neuron.2013.06.003. [DOI] [PMC free article] [PubMed] [Google Scholar]
- 11.Rosenmund C, Stern-Bach Y, Stevens CF. The tetrameric structure of a glutamate receptor channel. Science. 1998;280:1596–1599. doi: 10.1126/science.280.5369.1596. [DOI] [PubMed] [Google Scholar]
- 12.Sobolevsky AI. Structure and Gating of Tetrameric Glutamate Receptors. J Physiol. 2013 doi: 10.1113/jphysiol.2013.264911. [DOI] [PMC free article] [PubMed] [Google Scholar]
- 13.Schauder DM, et al. Glutamate receptor desensitization is mediated by changes in quaternary structure of the ligand binding domain. Proc Natl Acad Sci U S A. 2013;110:5921–5926. doi: 10.1073/pnas.1217549110. [DOI] [PMC free article] [PubMed] [Google Scholar]
- 14.Turski L, et al. ZK200775: a phosphonate quinoxalinedione AMPA antagonist for neuroprotection in stroke and trauma. Proc Natl Acad Sci U S A. 1998;95:10960–10965. doi: 10.1073/pnas.95.18.10960. [DOI] [PMC free article] [PubMed] [Google Scholar]
- 15.Scheres SH, Chen S. Prevention of overfitting in cryo-EM structure determination. Nat Methods. 2012;9:853–854. doi: 10.1038/nmeth.2115. [DOI] [PMC free article] [PubMed] [Google Scholar]
- 16.Miu P, et al. Novel AMPA receptor potentiators LY392098 and LY404187: effects on recombinant human AMPA receptors in vitro. Neuropharmacology. 2001;40:976–983. doi: 10.1016/s0028-3908(01)00027-2. [DOI] [PubMed] [Google Scholar]
- 17.Prieto ML, Wollmuth LP. Gating modes in AMPA receptors. J Neurosci. 2010;30:4449–4459. doi: 10.1523/JNEUROSCI.5613-09.2010. [DOI] [PMC free article] [PubMed] [Google Scholar]
- 18.Smith TC, Howe JR. Concentration-dependent substate behavior of native AMPA receptors. Nat Neurosci. 2000;3:992–997. doi: 10.1038/79931. [DOI] [PubMed] [Google Scholar]
- 19.Armstrong N, Gouaux E. Mechanisms for activation and antagonism of an AMPA-sensitive glutamate receptor: Crystal structures of the GluR2 ligand binding core. Neuron. 2000;28:165–181. doi: 10.1016/s0896-6273(00)00094-5. [DOI] [PubMed] [Google Scholar]
- 20.Dong H, Zhou HX. Atomistic mechanism for the activation and desensitization of an AMPA-subtype glutamate receptor. Nat Commun. 2011;2:354. doi: 10.1038/ncomms1362. [DOI] [PMC free article] [PubMed] [Google Scholar]
- 21.Carbone AL, Plested AJ. Coupled control of desensitization and gating by the ligand binding domain of glutamate receptors. Neuron. 2012;74:845–857. doi: 10.1016/j.neuron.2012.04.020. [DOI] [PubMed] [Google Scholar]
- 22.Jin R, Horning M, Mayer ML, Gouaux E. Mechanism of activation and selectivity in a ligand-gated ion channel: structural and functional studies of GluR2 and quisqualate. Biochemistry. 2002;41:15635–15643. doi: 10.1021/bi020583k. [DOI] [PubMed] [Google Scholar]
- 23.Mayer ML, Ghosal A, Dolman NP, Jane DE. Crystal structures of the kainate receptor GluR5 ligand binding core dimer with novel GluR5-selective antagonists. J Neurosci. 2006;26:2852–2861. doi: 10.1523/JNEUROSCI.0123-06.2005. [DOI] [PMC free article] [PubMed] [Google Scholar]
- 24.Armstrong N, Jasti J, Beich-Frandsen M, Gouaux E. Measurement of conformational changes accompanying desensitization in an ionotropic glutamate receptor. Cell. 2006;127:85–97. doi: 10.1016/j.cell.2006.08.037. [DOI] [PubMed] [Google Scholar]
- 25.Chaudhry C, Weston MC, Schuck P, Rosenmund C, Mayer ML. Stability of ligand-binding domain dimer assembly controls kainate receptor desensitization. EMBO J. 2009;28:1518–1530. doi: 10.1038/emboj.2009.86. [DOI] [PMC free article] [PubMed] [Google Scholar]
- 26.Nayeem N, Zhang Y, Schweppe DK, Madden DR, Green T. A nondesensitizing kainate receptor point mutant. Mol Pharmacol. 2009;76:534–542. doi: 10.1124/mol.109.056598. [DOI] [PMC free article] [PubMed] [Google Scholar]
- 27.Pasternack A, et al. Alpha-amino-3-hydroxy-5-methyl-4-isoxazolepropionic acid (AMPA) receptor channels lacking the N-terminal domain. The Journal of biological chemistry. 2002;277:49662–49667. doi: 10.1074/jbc.M208349200. [DOI] [PubMed] [Google Scholar]
- 28.Horning MS, Mayer ML. Regulation of AMPA receptor gating by ligand binding core dimers. Neuron. 2004;41:379–388. doi: 10.1016/s0896-6273(04)00018-2. [DOI] [PubMed] [Google Scholar]
- 29.Plested AJ, Mayer ML. Structure and mechanism of kainate receptor modulation by anions. Neuron. 2007;53:829–841. doi: 10.1016/j.neuron.2007.02.025. [DOI] [PubMed] [Google Scholar]
- 30.Mayer ML. Glutamate receptors at atomic resolution. Nature. 2006;440:456–462. doi: 10.1038/nature04709. [DOI] [PubMed] [Google Scholar]
- 31.Burnashev N, Zhou Z, Neher E, Sakmann B. Fractional calcium currents through recombinant GluR channels of the NMDA, AMPA and kainate receptor subtypes. J Physiol (Lond) 1995;485:403–418. doi: 10.1113/jphysiol.1995.sp020738. [DOI] [PMC free article] [PubMed] [Google Scholar]
- 32.Bowie D, Mayer ML. Inward rectification of both AMPA and kainate subtype glutamate receptors generated by polyamine-mediated ion channel block. Neuron. 1995;15:453–462. doi: 10.1016/0896-6273(95)90049-7. [DOI] [PubMed] [Google Scholar]
- 33.Jin R, et al. Crystal structure and association behaviour of the GluR2 amino-terminal domain. EMBO J. 2009;28:1812–1823. doi: 10.1038/emboj.2009.140. [DOI] [PMC free article] [PubMed] [Google Scholar]
- 34.Kumar J, Schuck P, Mayer ML. Structure and assembly mechanism for heteromeric kainate receptors. Neuron. 2011;71:319–331. doi: 10.1016/j.neuron.2011.05.038. [DOI] [PMC free article] [PubMed] [Google Scholar]
- 35.Zhao H, et al. Analysis of high-affinity assembly for AMPA receptor amino-terminal domains. J Gen Physiol. 2012;139:371–388. doi: 10.1085/jgp.201210770. [DOI] [PMC free article] [PubMed] [Google Scholar]
- 36.Garavito RM, Ferguson-Miller S. Detergents as tools in membrane biochemistry. The Journal of biological chemistry. 2001;276:32403–32406. doi: 10.1074/jbc.R100031200. [DOI] [PubMed] [Google Scholar]
- 37.Liao M, Cao E, Julius D, Cheng Y. Structure of the TRPV1 ion channel determined by electron cryo-microscopy. Nature. 2013;504:107–112. doi: 10.1038/nature12822. [DOI] [PMC free article] [PubMed] [Google Scholar]
- 38.Liao M, Cao E, Julius D, Cheng Y. Single particle electron cryo-microscopy of a mammalian ion channel. Current opinion in structural biology. 2014;27C:1–7. doi: 10.1016/j.sbi.2014.02.005. [DOI] [PMC free article] [PubMed] [Google Scholar]
- 39.Jiang QX, Gonen T. The influence of lipids on voltage-gated ion channels. Current opinion in structural biology. 2012;22:529–536. doi: 10.1016/j.sbi.2012.03.009. [DOI] [PMC free article] [PubMed] [Google Scholar]
- 40.Barrera NP, Zhou M, Robinson CV. The role of lipids in defining membrane protein interactions: insights from mass spectrometry. Trends in cell biology. 2013;23:1–8. doi: 10.1016/j.tcb.2012.08.007. [DOI] [PubMed] [Google Scholar]
- 41.Jin R, Banke TG, Mayer ML, Traynelis SF, Gouaux E. Structural basis for partial agonist action at ionotropic glutamate receptors. Nature Neurosci. 2003;6:803–810. doi: 10.1038/nn1091. [DOI] [PubMed] [Google Scholar]
- 42.Ahmed AH, Wang S, Chuang HH, Oswald RE. Mechanism of AMPA receptor activation by partial agonists: disulfide trapping of closed lobe conformations. The Journal of biological chemistry. 2011;286:35257–35266. doi: 10.1074/jbc.M111.269001. [DOI] [PMC free article] [PubMed] [Google Scholar]
- 43.Alushin GM, Jane D, Mayer ML. Binding site and ligand flexibility revealed by high resolution crystal structures of GluK1 competitive antagonists. Neuropharmacology. 2011;60:126–134. doi: 10.1016/j.neuropharm.2010.06.002. [DOI] [PMC free article] [PubMed] [Google Scholar]
- 44.Kawate T, Gouaux E. Fluorescence-detection size-exclusion chromatography for precrystallization screening of integral membrane proteins. Structure. 2006;14:673–681. doi: 10.1016/j.str.2006.01.013. [DOI] [PubMed] [Google Scholar]
- 45.Kremer JR, Mastronarde DN, McIntosh JR. Computer visualization of three-dimensional image data using IMOD. Journal of structural biology. 1996;116:71–76. doi: 10.1006/jsbi.1996.0013. [DOI] [PubMed] [Google Scholar]
- 46.Tang G, et al. EMAN2: an extensible image processing suite for electron microscopy. Journal of structural biology. 2007;157:38–46. doi: 10.1016/j.jsb.2006.05.009. [DOI] [PubMed] [Google Scholar]
- 47.Scheres SH. RELION: implementation of a Bayesian approach to cryo-EM structure determination. Journal of structural biology. 2012;180:519–530. doi: 10.1016/j.jsb.2012.09.006. [DOI] [PMC free article] [PubMed] [Google Scholar]
- 48.Mindell JA, Grigorieff N. Accurate determination of local defocus and specimen tilt in electron microscopy. Journal of structural biology. 2003;142:334–347. doi: 10.1016/s1047-8477(03)00069-8. [DOI] [PubMed] [Google Scholar]
- 49.Cardone G, Heymann JB, Steven AC. One number does not fit all: mapping local variations in resolution in cryo-EM reconstructions. Journal of structural biology. 2013;184:226–236. doi: 10.1016/j.jsb.2013.08.002. [DOI] [PMC free article] [PubMed] [Google Scholar]
- 50.Pettersen EF, et al. UCSF Chimera--a visualization system for exploratory research and analysis. J Comput Chem. 2004;25:1605–1612. doi: 10.1002/jcc.20084. [DOI] [PubMed] [Google Scholar]
- 51.Henderson R, et al. Tilt-pair analysis of images from a range of different specimens in single-particle electron cryomicroscopy. Journal of molecular biology. 2011;413:1028–1046. doi: 10.1016/j.jmb.2011.09.008. [DOI] [PMC free article] [PubMed] [Google Scholar]
- 52.Hald H, et al. Distinct structural features of cyclothiazide are responsible for effects on peak current amplitude and desensitization kinetics at iGluR2. Journal of molecular biology. 2009;391:906–917. doi: 10.1016/j.jmb.2009.07.002. [DOI] [PubMed] [Google Scholar]
- 53.The PyMOL Molecular Graphics System, Version 1.7. Schrödiner, LLC, DeLano Scientific; Palo Alto, CA, USA: 2002. [Google Scholar]
Associated Data
This section collects any data citations, data availability statements, or supplementary materials included in this article.
Supplementary Materials
Extended Data Table 1a | Data collection and image processing statistics
Results of image processing of GluA2 and GluK2 density maps included in the study. The table shows (from left to right): (i) the number of micrographs used for image processing, (ii) the number of particles manually designated in the micrographs, (iii) the number of particles retained after 2D classification and (iv) the number of particles retained after 3D classification and used for structure refinement.
Extended Data Table 1b | Comparison of GluA2em active state cryo-EM structure with previous computational models
A comparison of the GluA2em active state LBD tetramer assembly (row 1) with prior active state computational models (rows 2–6) was performed using three different measures: (i) by calculating the angle between dimer assemblies determined using vectors from the global center of symmetry at the level of A665 CA atoms to V395 CA atoms in the proximal (AC) subunits (“Dimer Angle”), (ii) the distance between dimer pairs using proximal (AC) subunit V395 CA coordinates at the top of the LBD tetramer assembly (“V395 Distance”) and (iii) the cross-correlation between the GluA2em active state cryo-EM density map and various models (“Correlation between EM map and model”). Model 1 was created as described6, by superimposing two copies of GluA2 LBD glutamate complex dimers (PDB ID: 1FTJ) on GluA2cryst, using domain 1 coordinates (RMSD 0.31 Å). Model 2 was created as described20, generating a GluA2 LBD tetramer assembly by crystallographic symmetry operations from PDB ID: 1FTJ. Model 3, GluA2 (4L17) is the activation intermediate tetramer assembly generated by crystallographic symmetry operations from PDB ID: 4L17, for which the B and D subunit DNQX-bound protomers were replaced by glutamate bound protomers (PDB ID: 1FTJ) as described previously10. Models 4 and 5 are two different glutamate-bound, GluA2 LBD tetramer assemblies generated by crystallographic symmetry operations from PDB ID 3H6W52. Quaternary structural changes were visualized using PyMol53. Morphs comparing the GluA2em active state LBD tetramer assembly with models 1–3 are shown in Supplementary Movie 3.
Conformational changes that occur upon transition of GluA2 in the antagonist-bound closed state to the glutamate-bound open state. Crystal structure coordinates are colored with protomers A, B, C, and D in green, red, yellow and blue, respectively. α-helix G of each LBD is colored in orange. The trajectory was computed using the morph utility in PyMol by interpolation from the initial and final states derived from fitting atomic coordinates to cryo-EM density maps using UCSF Chimera.
Conformational changes that occur in the LBD tetramer assembly upon transition of GluK2 in the glutamate-bound active state to the glutamate-bound desensitized state. Crystal structure coordinates are colored with protomers A, B, C, and D in green, red, yellow and blue, respectively. α-helix G of each LBD is colored in orange. The trajectory was computed using the morph utility in PyMol by interpolation from the initial and final states derived from fitting atomic coordinates to cryo-EM density maps using UCSF Chimera.
Comparison of structural changes in the GluA2 LBD tetramer assembly for the GluA2em active state structure, and models created in prior studies. Crystal structure coordinates are colored with protomers A, B, C, and D in green, red, yellow and blue, respectively. For GluA2em and models 1–3 trajectories from the antagonist-bound closed state to the glutamate bound active state were computed using the morph utility in PyMol. Model 1 was created by superimposing two copies of GluA2 LBD glutamate complex dimers (PDB ID: 1FTJ) on GluA2cryst, using domain 1 coordinates (RMSD 0.31 Å); note that different from the GluA2em active state, the upper lobes of the LBD do not move. Model 2 was created by generating a GluA2 LBD tetramer assembly with crystallographic symmetry operations starting from PDB ID: 1FTJ; note that the upper lobes move closer together, and that in the active state the assembly assumes a flat structure in which the dimers are arranged as parallel arrays. Model 3 is the activation intermediate tetramer assembly generated by crystallographic symmetry operations from PDB ID 4L17, for which the B and D subunit DNQX-bound protomers were replaced by glutamate bound protomers (PDB ID 1FTJ); note that similar to model 2, the upper lobes move closer together, and that in the active state, the assembly assumes a flat structure in which the dimers are arranged as parallel arrays.


