

Abstract
Objective
The goal of this study is to develop an ultra-high performance liquid chromatographic method for the quantitative determination of artemisinin at very low concentrations using selective ion mass spectroscopic detection.
Materials and Methods
Separation was conducted using a C4 100 mm × 2.1 mm column, and the mobile phase consisted of an isocratic two-component system consisting of 60% of a 0.1% aqueous solution of formic acid and 40% acetonitrile at a flow rate of 0.4 mL/min. The drug was detected by means of an electrospray mass spectrometer with selective ion monitoring of the [M-H2O+H]+ with m/z of 265.3 in positive ion mode.
Results
The calibration curves of artemisinin obtained from the UPLC/MS system were linear in the three ranges analyzed, with a correlation coefficient of no less than 0.9996 for all sets of standards. The peak tailing factor for all measurements were less than or equal to 1.7. The method proved to have good repeatability and linearity.
Discussion
The described analytical method reached a LOQ of 0.010 μg/mL with an isocratic system and enables an analysis rate of 20 samples per hour. The linearity of the standards was excellent for all sets of standards analyzed.
Conclusion
The method presented in this study provides a rapid and suitable means for the determination of artemisinin at very low concentrations. This is especially significant when performing dissolution studies where, due to the low solubility of artemisinin, a method that can measure the drug at nanogram levels is necessary.
Introduction
Artemisinin is an antimalarial drug which has also been reported as a viable treatment for various cancers.1,2 It is listed by the World Health Organization as a priority medicine for mothers and children in combination therapies for the treatment of malaria.3 As artemisinin-resistant strains of malaria emerge, additional research avenues concerning artemisinin must be addressed, such as new combination therapies with artemisinin, as well as mechanistic studies of artemisinin drug action and parasitic resistance.4 In addition to its broad antimalarial applications, Lai et al (2012) reviewed the extensive research into artemisinin and its derivatives for the treatment of cancer both in vitro and in vivo.5
Artemisinin is a sesquiterpene, and its chemical structure is shown in Figure 1. The empirical formula of artemisinin is C15H22O5 with a molecular weight of 282.3.6 The bioavailability of artemisinin after oral administration is 32%.7 The low bioavailability of artemisinin after oral administration is not due to its inability to cross the intestinal membrane8, rather it has been attributed to its low aqueous solubility. Since dissolution is the rate-limiting step for the bioavailability of artemisinin following oral administration, dissolution rate studies are useful in determining artemisinin bioavailability. Due to its low solubility, artemisinin concentrations in the dissolution medium are very low, therefore necessitating a sensitive method for its analysis.
Figure 1.
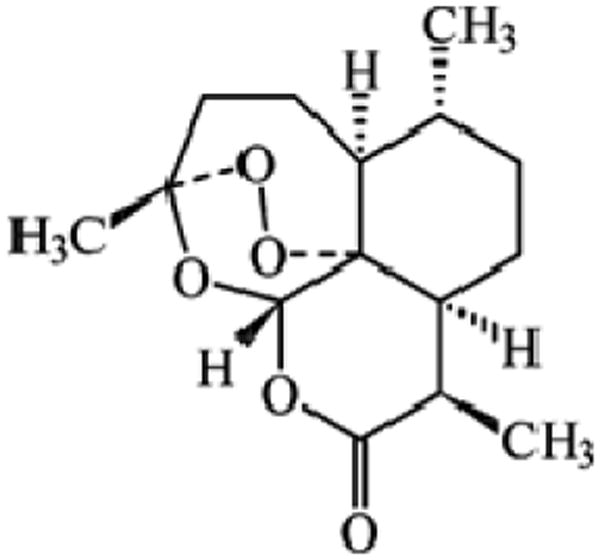
Chemical structure of artemisinin.
Several methods for the analysis of artemisinin have been published, but standard detection methods are hindered by artemisinin's lack of a suitable chromophore for UV detection. These methods include gas chromatography (GC), gas chromatography-mass spectrometry (GC-MS), high performance liquid chromatography (HPLC), liquid chromatography-mass spectrometry (LC-MS), ultraviolet spectroscopy (UV), and immunoassays.9-23 The most recent publication on the quantitative analysis of artemisinin is by LC-MS with selective ion monitoring (SIM).24 The method requires an isocratic system initially, followed by a gradient system as the mobile phase. The run time is 11 minutes, and the lowest concentration in the linear range is 5 μg/mL. The method developed in our laboratory and described in this study is a modification of the above-mentioned method, making use of ultra-high performance liquid chromatography (UPLC) with SIM. The method allows for a limit of quantification of 0.010 μg/mL with a total run time of 3 minutes, allowing for the analysis of three times as many samples in the same period of time.
Materials and Methods
Materials
Artemisinin (98%), acetonitrile, ethanol, and formic acid were purchased from Sigma-Aldrich (Milwaukee, WI).
Preparation of standards
Standards of artemisinin in the range of 0.010 μg/mL to 20.0 μg/mL were prepared by first dissolving 5.00 mg of artemisinin in 5.0 mL of ethanol to produce a 1000 μg/mL stock solution. Additional stock solutions of 100 μg/mL and 10.0 μg/mL were prepared by dilution with ethanol. Accurate volumes of these stock solutions were then pipetted into 5.0 mL volumetric flasks and diluted with mobile phase prepared by mixing 60% v/v 0.1% aqueous formic acid solution with 40% v/v acetonitrile.
UPLC-MS analysis of artemisinin
Analysis of artemisinin was achieved by UPLC using a Waters Acquity UPLC™ system fitted with a single quadrupole (SQ) detector (Waters Corporation, Milford, MA). The mobile phase was an isocratic system consisting of 60% v/v aqueous solution of 0.1% formic acid and 40% v/v acetonitrile. The column was a Waters BEH300 C4 1.7 μm 100 mm × 2.1 mm column. The flow rate was 0.4 mL/min. For the four lowest concentration standards, a full loop (10.0 μL) of each sample was injected, and for the remaining standards 2.0 μL of the standard was injected using the partial loop with needle overfill injection mode.
Detection was achieved with a Waters SQ detector using selective ion monitoring of the [M-H2O+H]+ with m/z of 265.3 in positive ion mode. The operation parameters were a capillary voltage of 3.5 kV, a cone voltage of 41 V, extractor of 3 V, and RF lens of 0.5 V. The source and desolvation temperatures were 135°C and 250° C, respectively. Pure 99.99% nitrogen was used at a flow rate of 500 L/hr for the desolvation and 2 L/hr for the cone. The operational parameters including the target mass were determined by running a mass scan and tuning the instrument to the desired mass.
The retention time was 2.2 minutes and quantification was based on the UPLC-MS peak area of artemisinin.
Method validation
Method validation was achieved by determining the linearity of the standards using a least squares analysis in triplicate runs. In addition to linearity, precision, intra-day variation, inter-day variation, and peak tailing factor were determined for all of the standards. Intra-day variation was calculated by determining the error of three sets of standards run within the day, and the inter-day variation was determined by running the standards for three consecutive days.25 For the peak tailing factor, the USP method (T = (a+b)/ 2a) was utilized, where a = peak width from onset to midpoint at 5% peak height and b = peak width from midpoint to end at 5% of the peak height.26 Statistical analysis was done using Sigmastat software (Systat Software, Inc., Chicago, IL).
Results
Figure 2 presents a mass spectrum for artemisinin dissolved in ethanol and run on the Waters SQ detector in positive ion mode. The two largest mass peaks were the molecular mass peak at 283.1 and the dehydrated peak at 265.2 m/z. While the [M−18+H]+ peak was smaller than the molecular ion peak, the molecular ion peak was more variable and dependent upon matrix conditions.
Figure 2.

Single quad detector MS scan of artemisinin run in positive ion mode.
By using this method, the sensitivity of the method was significantly increased (500 times), and the time to run a sample was reduced to 3 minutes, allowing the analysis of 20 samples per hour versus 5 samples reported in the most recently published LC-MS method.24 Three different sets of standards were run – low concentration standards (0.010 – 0.100 μg/ mL), medium concentration standards (0.25 – 2.0 μg/mL), and high concentration standards (4.0 – 20.0 μg/mL). Figure 3 shows representative UPLC-MS scans of the lowest concentration standards from the three sets of standards analyzed. For the low concentration standards 0.010 μg/mL – 0.100 μg/mL, the amount of sample injected was 10.0 μL, or a full loop. For the other two sets, 2.0 μL was injected using the partial loop with needle overfill mode. Even the lowest standard 0.010 μg/mL produced a well-defined quantifiable peak.
Figure 3.

Representative UPLC chromatograms of the lowest concentration for each set of standards with (a) 0.010 μg/mL, (b) 0.25 μg/mL, and (c) 4.0 μg/mL using single ion monitoring mass spectrometry detection. Note that the injected amount for (a) was a full loop or 10.0 μL, and for (b) and (c) a partial loop or 2.0 μL with needle overfill mode.
Linearity
Linearity of the data was found to be excellent (r2 > 0.999) for all three sets of standards, even down to the lowest quantification level (0.010 μg/mL), which is sensitive enough for the determination of trace amounts of drug in the dissolution medium when conducting dissolution experiments (Figure 4). However, the range of linearity was found to be limited to each set of standards. Therefore, for accurate results it is best to maintain the calibration range to one order of magnitude as was done within each set of standards.
Figure 4.

Calibration curves and least squares analyses of (a) low concentration standards, (b) medium concentration standards, and (c) high concentration standards.
Sensitivity, Accuracy, and Precision
In Tables 1 and 2, the precision and accuracy for the intra-day and inter-day measurements are reported. These results show that this analytical method is acceptable for the analysis of artemisinin down to a limit of quantification (LOQ) of 0.010 μg/mL. The signal height was approximately eight-fold greater than the noise height, and the RSD% was less than 10. The limit of detection (LOD) was found to be 0.005 μg/ml, which, though detectable, was not quantifiable.
Table 1. Intra-day evaluation of artemisinin standards.
| Standards Set | Theoretical Concentration (μg/mL) | Concentration Detected (μg/mL, mean ± SD) | Accuracy (% relative error) | Precision (RSD%) |
|---|---|---|---|---|
| Low Concentration | 0.01 | 0.0095 ± 0.0006 | -4.24 | 4.85 |
| 0.02 | 0.0212 ± 0.0007 | 6.14 | 1.91 | |
| 0.05 | 0.0488 ± 0.0005 | -2.40 | 3.21 | |
| 0.10 | 0.1003 ± 0.0005 | 0.40 | 1.54 | |
|
| ||||
| Medium Concentration | 0.25 | 0.255 ± 0.011 | 2.00 | 3.78 |
| 0.5 | 0.476 ± 0.012 | -4.86 | 0.62 | |
| 1 | 1.028 ± 0.008 | 2.83 | 0.74 | |
| 2 | 1.991 ± 0.005 | -0.43 | 0.26 | |
|
| ||||
| High Concentration | 4 | 3.909 ± 0.029 | -2.27 | 0.72 |
| 8 | 7.991 ± 0.132 | -0.11 | 1.86 | |
| 10 | 10.156 ± 0.114 | 1.56 | 1.32 | |
| 20 | 19.944 ± 0.285 | -0.28 | 1.79 | |
Table 2. Inter-day evaluation of artemisinin standards.
| Standards Set | Theoretical Concentration (μg/mL) | Concentration Detected (μg/mL, mean ± SD) | Accuracy (% relative error) | Precision (RSD%) |
|---|---|---|---|---|
| Low Concentration | 0.01 | 0.0091 ± 0.0013 | -8.77 | 8.90 |
| 0.02 | 0.0213 ± 0.0018 | 6.35 | 1.93 | |
| 0.05 | 0.0495 ± 0.0002 | -0.91 | 4.99 | |
| 0.10 | 0.1001 ± 0.0055 | 0.06 | 7.67 | |
|
| ||||
| Medium Concentration | 0.25 | 0.246 ± 0.009 | -1.71 | 3.06 |
| 0.5 | 0.472 ± 0.026 | -5.67 | 5.01 | |
| 1 | 1.023 ± 0.008 | 2.33 | 0.79 | |
| 2 | 2.023 ± 0.053 | 1.14 | 2.55 | |
|
| ||||
| High Concentration | 4 | 3.770 ± 0.009 | -5.76 | 1.75 |
| 8 | 8.097 ± 0.026 | 0.53 | 0.53 | |
| 10 | 10.252 ± 0.008 | 1.77 | 1.77 | |
| 20 | 19.881 ± 0.053 | 3.54 | 3.54 | |
For all of the measurements done, the precision, as measured by the relative standard deviation (RSD%), was below 10%; also, the RSD% of 87.5% of the measurements, including both the intra-day and inter-day results, were below 5%. These results indicate that the method precision or repeatability of the methodology is adequate. The accuracy of the methodology, as measured relative to the theoretical concentration, ranged from -4.86% to 6.14% for the intra-day measurements. The accuracy measure is dependent upon external variables outside of the UPLC methodology – namely, errors related to the preparation of the standards and errors related to not verifying the concentrations by a secondary methodology. Therefore, the discrepancies in the accuracy measurements between standards made on the same day could be due to pipetting errors or solvent evaporation. The same is true of the relative accuracy of the inter-day measurements, which ranged from -8.77% to 6.35%.
Peak Tailing Factor
The peak tailing factor was within acceptable limits (T ≤ 1.7) for all the standards analyzed (Table 3).25 The tailing factor was actually less for the lowest set of standards with a mean tailing factor of 1.1 ± 0.1. Statistical analysis of the tailing factors showed a significant difference in the tailing factors between the low concentration standards and the other two sets, but no difference existed between the two higher sets of standards as indicated by the statistical comparison summarized in Table 4. This suggests that the injection method or concentration of the standard may be a contributing factor in the peak tailing.
Table 3. Peak tailing evaluation of the artemisinin standards.
| Standard (μg/mL) | Tailing factor* |
|---|---|
| 0.01 | 1.2 |
| 0.02 | 1.0 |
| 0.05 | 1.0 |
| 0.1 | 1.1 |
| 0.25 | 1.4 |
| 0.5 | 1.3 |
| 1 | 1.5 |
| 2 | 1.7 |
| 4 | 1.6 |
| 8 | 1.6 |
| 10 | 1.5 |
| 20 | 1.5 |
Calculated using the USP method for peak tailing
Table 4. Statistical comparison of the tailing factor for the three sets of standards.
| Comparison | p-value | p < 0.050 |
|---|---|---|
| High vs. Low | < 0.001 | Yes |
| Medium vs. Low | 0.002 | Yes |
| High vs. Medium | 0.392 | No |
Discussion
Least squares analysis for the full range of standards for HPLC-MS with SIM is a suitable validation method for the quantitative determination of drugs, especially in the presence of impurities or degradation products. This technology has been frequently used for the analysis of phytochemicals.26 The first published method for the analysis of artemisinin with LC-MS used a SIM of the molecular ion peak [M+H] +.20 More recently, another LC-MS method using a SIM set at [M−18+H]+ under positive ion mode resulted in a dramatic improvement in sensitivity and also provided the ability to analyze 5 samples per hour.24 The lowest detection limit in the linear range was reported to be 5.141 μg/mL. The method also required an isocratic system followed by a gradient system as the mobile phase.
In the present study, the methodology reaches a LOQ of 0.010 μg/mL with an isocratic system and enables an analysis rate of 20 samples per hour. The linearity of the standards was excellent for all sets of standards analyzed, but the range of linearity was limited to one order of magnitude. The high relative standard deviation, i.e. RSD% > 5, observed for some of the inter-day measurements could be attributed to inadequate equilibration time for each day of analysis. Extending the time of equilibration on each day of sample analysis could further improve the precision of the measurements. Additionally, temperature fluctuations for the inter-day measurements could also affect the intermediate precision of the measurements. The addition of a column heater could reduce the inter-day variation related to temperature fluctuations which is not observed in intra-day measurements. Finally, the increase in peak tailing factor observed for the two higher sets of standards may be explained by several factors. The increased drug loading for the higher standards may be a contributing factor; mechanical differences in the injection loop during the partial loop injection or the slight changes in the injection composition between the full loop and partial loop methods may also contribute to this difference. However, although the tailing factors increase, they are still within acceptable limits.
It is noteworthy that, when analyzing pharmaceutical formulations containing excipients which could contaminate the MS, the flexibility of the instrumentation allows the prevention of contamination and carry-over in the MS by redirection of the chromatographic flow to waste for the portion of the run where the excipients are expected to elute. For instance, for a sample containing both artemisinin and polymeric excipients, the flow can be set to bypass the MS for the first 1.5 minutes of the run to prevent contamination from the excipients.
Conclusion
The trend in sample qualitative and quantitative analysis especially in the pharmaceutical industry is toward the utilization of methods which are fast and sensitive. This is due to many factors such as the necessity to detect compounds at ever lower levels, the requirement to conduct drug testing and quality control at a more rapid pace, and the need to evaluate smaller sample sizes due to the expense and complexity of target compounds. One of the major developments leading to the improvement of drug analysis has been the development of ultra-high performance liquid chromatography. In this study, a UPLC chromatographic method for the quantification of artemisinin has been developed which is both rapid and sensitive. This method, due to its high sensitivity, is well suited for dissolution, biological, and pharmacokinetic studies of artemisinin.
Acknowledgments
Declaration of Interest: This work was funded in part by the following grants: NIH 1SC3GM102050 and 5G12RR026260-02; DHHS D34HP00006; Louisiana Board of Regents LEQSF(2007-13)-ENH-PKSFI-PRS-02; and DoD W81XWH-07-1-0136. Its contents are solely the responsibility of the contributing authors and do not necessarily represent the official views of the NIH, DHHS, DoD, or Louisiana Board of Regents.
References
- 1.Chen HH, Zhou HJ, Fang X. Inhibition of human cancer cell line growth and human umbilical veinendothelial cell angiogenesis by artemisinin derivatives in vitro. Pharmacol Res. 2003;48(3):231–6. doi: 10.1016/s1043-6618(03)00107-5. [DOI] [PubMed] [Google Scholar]
- 2.Stockwin LH, Han B, Yu SX, Hollingshead MG, ElSohly MA, Gul W, Slade D, Galal AM, Newton DL, Bumke MA. Artemisinin dimer anticancer activity correlates with heme-catalyzed reactive oxygen species generation and endoplasmic reticulum stress induction. Int J Cancer. 2009;125(6):1266–75. doi: 10.1002/ijc.24496. [DOI] [PMC free article] [PubMed] [Google Scholar]
- 3.World Health Organization. Priority live-saving medicines for women and children 2012. 2012 May 24;:4. WHO reference number: WHO/EMP/MAR/2012.1. [Google Scholar]
- 4.Fairhurst RM, Nayyar GM, Breman JG, Hallett R, Vennerstrom JL, Duong S, Ringwald P, Wellems TE, Plowe CV, Dondorp AM. Artemisinin-resistant malaria: research challenges, opportunities, and public health implications. Am J Trop Med Hyg. 2012;87(2):231–41. doi: 10.4269/ajtmh.2012.12-0025. [DOI] [PMC free article] [PubMed] [Google Scholar]
- 5.Lai HC, Singh NP, Sasaki T. Development of artemisinin compounds for cancer treatment. Invest New Drugs. 2012;31(1):230–46. doi: 10.1007/s10637-012-9873-z. [DOI] [PubMed] [Google Scholar]
- 6.O'Neil MJ, editor. The Merck Index: An Encyclopedia of Chemicals, Drugs, and Biologicals. 14th. New Jersey: Merck; 2006. [Google Scholar]
- 7.Rath K, Taxis K, Walz G, Gleiter CH, Li SM, Heide L. Pharmacokinetic study of artemisinin after oral intake of a traditional preparation of Artemisia annua L. (annual wormwood) Am J Trop Med Hyg. 2004;70(2):128–32. [PubMed] [Google Scholar]
- 8.Steyn JD, Wiesner L, du Plessis LH, Grobler AF, Smith PJ, Chan WC, Haynes RK, Kotzé AF. Absorption of the novel artemisinin derivatives artemisone and artemiside: potential application of Pheroid™ technology. Int J Pharm. 2011;414(1-2):260–6. doi: 10.1016/j.ijpharm.2011.05.003. [DOI] [PubMed] [Google Scholar]
- 9.Avery BA, Venkatesh KK, Avery MA. Rapid determination of artemisinin and related analogs by high-performance liquid chromatography and an evaporative light scattering detector. J Chromatogr B Biomed Sci Appl. 1999;730(1):71–80. doi: 10.1016/s0378-4347(99)00185-1. [DOI] [PubMed] [Google Scholar]
- 10.Bui TB. Rapid quantitative determination of artemisinin in plant material by ultraviolet spectroscopy. Tap Chi Duoc Hocm. 1993;5:21–2. [Google Scholar]
- 11.Ferreira JFS, Charles DJ, Wood K, Janick J, Simon JE. A comparison of gas chromatography and high performance liquid chromatography for artemisinin analyses. Phytochem Anal. 1994;5(3):116–20. [Google Scholar]
- 12.Ferreira JF, Janick J. Immunoquantitative analysis of artemisinin from Artemisia annua using polyclonal antibodies. Phytochemistry. 1996;41(1):97–104. doi: 10.1016/0031-9422(95)00542-0. [DOI] [PubMed] [Google Scholar]
- 13.Gupta MM, Jain DC, Verma RK, Gupta AP. A rapid analytical method for the determination of artemisinin in Artemisia annua. J Med Aromat Plant Sci. 1996;18:5–6. [Google Scholar]
- 14.Gupta MM, Verma RK, Gupta AP, Bhartariya KG, Kumar S. Simultaneous determination of artemisinin, artean-nuin-B and artemisinic acid in Artemisia annua by high performance liquid chromatography with the combination of ODS and CN columns. J Med Aromat Plant Sci. 1997;19(4):968–72. [Google Scholar]
- 15.Kohler M, Haerdi W, Christen P, Veuthey JL. Determination of artemisinin in Artemisia annua L. by off-line supercritical fluid extraction and supercritical fluid chromatography coupled to an evaporative light-scattering detector. Methods Biotechnol. 2000;13:135–43. Supercritical Fluids. [Google Scholar]
- 16.Maillard MP, Wolfender JL, Hostettmann K. Use of liquid chromatography-thermospray mass spectrometry in phytochemical analysis of crude plant extracts. J Chromatogr A. 1993;647(1):147–54. [Google Scholar]
- 17.Marchese JA, Rehder VLG, Sartoratto A. Quantification of artemisinin in Artemisia annua L.sa comparison of thin-layer chromatography with densitometric detection and high performance liquid chromatography with UV detection. Brasileira Plantas Med. 2001;4:81–7. [Google Scholar]
- 18.Na-Bangchang K, Congpuong K, Hung LN, Molunto P, Karbwang J. Simple high-performance liquid chromatographic method with electrochemical detection for the simultaneous determination of artesunate and dihydroartemisinin in biological fluids. J Chromatogr B Biomed Sci Appl. 1998;708(1-2):201–7. doi: 10.1016/s0378-4347(97)00667-1. [DOI] [PubMed] [Google Scholar]
- 19.Qian GP, Yang YW, Ren QL. Determination of artemisinin in Artemisia annua L. by reversed phase HPLC. J Liq Chromatogr Related Technol. 2005;28:705–12. [Google Scholar]
- 20.Sahai P, Vishwakarma RA, Bharel S, Gulati A, Abdin MZ, Srivastava PS, Jain SK. HPLC-electrospray ionization mass spectrometric analysis of antimalarial drug artemisinin. Anal Chem. 1998;70(14):3084–7. [Google Scholar]
- 21.Singh BL, Singh DV, Verma RK, Gupta MM, Jain DC, Kumar S. Simultaneous determination of antimalarial artemisinin, dihydroartemisinin and arteether using reversed phase high performance liquid chromatography. J Indian Chem Soc. 2001;78:489–91. [Google Scholar]
- 22.Singh BL, Singh DV, Verma RK, Gupta MM, Jain DC, Kumar S. Simultaneous determination of antimalarial drugs using reversed phase high-performance liquid chromatography-diode-array detection. J Med Aromat Plant Sci. 2001;22/4A 23/1A:17–20. [Google Scholar]
- 23.van Agtmael MA, Butter JJ, Portier EJ, van Boxtel CJ. Validation of an improved reversed-phase high-performance liquid chromatography assay with reductive electrochemical detection for the determination of artemisinin derivatives in man. Ther Drug Monit. 1998;20(1):109–16. doi: 10.1097/00007691-199802000-00020. [DOI] [PubMed] [Google Scholar]
- 24.Wang M, Park C, Wu Q, Simon JE. Analysis of artemisinin in Artemisia annua L. by LC-MS with selected ion monitoring. J Agric Food Chem. 2005;53(18):7010–3. doi: 10.1021/jf051061p. [DOI] [PubMed] [Google Scholar]
- 25.Levin S. High Performance Liquid Chromatography (HPLC) in the Pharmaceutical Analysis. Pharmaceutical Sciences Encyclopedia: Drug Discovery, Development and Manufacturing. 2010:1–34. [Google Scholar]
- 26.Yilmaz B. Determination of ramipril in pharmaceutical preparations by high-performance liquid chromatography. IJPSRR. 2010;1(1):39–42. [Google Scholar]