

Abstract
A few kinematic synergies identified by principal component analysis (PCA) account for most of the variance in the coordinated joint rotations of the fingers and wrist used for a wide variety of hand movements. To examine the possibility that motor cortex might control the hand through such synergies, we collected simultaneous kinematic and neurophysiological data from monkeys performing a reach-to-grasp task. We used PCA, jPCA and isomap to extract kinematic synergies from 18 joint angles in the fingers and wrist and analyzed the relationships of both single-unit and multiunit spike recordings, as well as local field potentials (LFPs), to these synergies. For most spike recordings, the maximal absolute cross-correlations of firing rates were somewhat stronger with an individual joint angle than with any principal component (PC), any jPC or any isomap dimension. In decoding analyses, where spikes and LFP power in the 100- to 170-Hz band each provided better decoding than other LFP-based signals, the first PC was decoded as well as the best decoded joint angle. But the remaining PCs and jPCs were predicted with lower accuracy than individual joint angles. Although PCs, jPCs or isomap dimensions might provide a more parsimonious description of kinematics, our findings indicate that the kinematic synergies identified with these techniques are not represented in motor cortex more strongly than the original joint angles. We suggest that the motor cortex might act to sculpt the synergies generated by subcortical centers, superimposing an ability to individuate finger movements and adapt the hand to grasp a wide variety of objects.
Keywords: decode, local field potential, multiunit, principal component, spike, kinematic synergies, jPCA, isomap
neural control of hand movement is complex, in part due to the hand's large number of mechanical degrees of freedom (Brand and Hollister 1993; Hartman and Straus 1933; Tubiana 1981). Fifteen joints are present in the 5 digits, 16 if the wrist is considered as well. Although the proximal interphalangeal (PIP) and distal interphalangeal (DIP) joints have only one degree of freedom (DoF), other joints in the hand rotate about more than one axis. For example, the metacarpophalangeal (MCP) joints of the fingers allow both flexion/extension and abduction/adduction. The carpometacarpal joint of the thumb allows flexion/extension, abduction/adduction, and opposition. The wrist allows flexion/extension and abduction/adduction, and the entire hand can be rotated in pronation/supination produced by movement of the radius relative to the ulna. Skeletal joints thus provide 24 rotational DoFs for the hand.
Natural movements of the hand rarely involve motion at a single joint or a single rotational DoF. Grasping an object, for example, entails simultaneous motion at multiple joints, with correlated rotation of multiple DoFs, both in humans (Santello et al. 1998, 2002; Santello and Soechting 1998) and in monkeys (Mason et al. 2001, 2004; Theverapperuma et al. 2006). Simultaneous correlated motion at multiple DoFs also is present during more sophisticated uses of the hand, such as typing (Soechting and Flanders 1997), playing the piano (Engel et al. 1997), producing a sign language alphabet (Jerde et al. 2003), or haptic exploration (Thakur et al. 2008). Even when normal subjects are instructed to move one finger, correlated motion occurs in the adjacent fingers (Hager-Ross and Schieber 2000). In many of these studies of both human and nonhuman primate hand movements, principal component analysis (PCA) has been applied to show that most of the correlated rotation of multiple DoFs can be explained by a much smaller number of principal components (PCs).
This mathematical result, in turn, has raised the hypothesis that the nervous system might operate the hand, not by controlling motion at individual joints or their rotational DoFs, but rather by controlling these PCs. To our knowledge, only two studies to date have approached the hypothesis that PCs are encoded in neurophysiological signals in the motor cortex (Saleh et al. 2010, 2012). Examining the extent to which point-process models of single primary motor cortex (M1) neuron spiking are affected by using PCs as external covariates, these two studies found that fewer PCs than original kinematic trajectories are needed to account optimally for single M1 neuron spiking activity. Because PCA concentrates the variance from multiple kinematic DoFs in a small number of low-order PCs, however, the observation that PCs provide a more compact model of single neuron spiking does not lead simply to the conclusion that M1 neurons control PCs more directly than the original kinematic DoFs. In these two studies, more than one PC was needed to account optimally for the spiking of most M1 neurons, and all PCs did not account more fully for M1 neuron spiking than did all the original kinematics, reflecting the fact that PCA constitutes a linear transformation of the coordinate frame for the same kinematic data.
We reasoned that, if the kinematic synergies identified by PCA were controlled from the motor cortex, then neural activity in the motor cortex should be related more strongly to PCs than to joint angles. Here, using a four-object reach-to-grasp task, we tested these predictions by 1) comparing the cross-correlation of spiking activity of motor cortex neurons with the motion of individual joint angles vs. the motion along individual PCs; and 2) comparing the accuracy of decoding the motion of individual joint angles vs. decoding the motion along individual PCs from spiking activity or local field potentials (LFPs). We also applied the comparatively recent approach of jPCA to capture rotational dynamics in the kinematic data (Churchland et al. 2012), as well as the nonlinear approach of isomap (Tenenbaum et al. 2000), and then made similar comparisons of motor cortex activity to the jPCs and isomap dimensions of the joint kinematics.
MATERIALS AND METHODS
All procedures involving nonhuman primates were approved by the University Committee on Animal Resources at the University of Rochester.
Reach-to-grasp task.
Detailed descriptions of the experimental methods used here have been presented previously (Mollazadeh et al. 2011). Briefly, two Rhesus monkeys (monkey X and monkey Y) were trained to reach to, grasp, and manipulate one of four objects arranged in a center-out fashion. The four objects and a central object each were mounted on a rod projecting horizontally toward the monkey from in front. The center object was a cylinder 20 mm in diameter and 60 mm in length mounted coaxially with the mounting rod. The four target objects comprised a button 8 mm in diameter mounted inside a tube of inner diameter 13 mm, a sphere 48 mm in diameter, a cylinder 20 mm in diameter and 60 mm long mounted coaxially with the mounting rod (identical to the center object), and another cylinder 25 mm in diameter and 63 mm in length mounted perpendicular to the rod. The four target objects were located at 45° intervals on a circle of 13 cm radius around the center object, all in a plane parallel to the monkey's coronal plane. Reaching and grasping the various objects, the monkey's hand moved within a volume in front of the right shoulder that extended 31 cm horizontally × 11 cm vertically × 10 cm in depth.
Both monkeys used their right hand to perform these reach-to-grasp movements, while their left upper extremity was restrained in the primate chair. Trials started when the monkey pulled on the central object for a variable initial hold period (monkey X: 329–878 ms; monkey Y: 1,034–1,533 ms). Then a blue LED was illuminated next to one of the objects, instructing the monkey to operate that object. After a variable reaction time, the monkey released the central object, then reached, grasped and manipulated the instructed object: pushing the button, turning the sphere, or pulling either cylinder. Each object evoked a different hand shape during grasping (Fig. 1). The monkey then held the object for 1,000 ms to complete the trial and receive a food pellet reward. Objects were instructed in a pseudorandom block design, repeating any error trials until successfully completed. The number of successful trials for each object in each session is given in Table 1. The behavioral task was controlled by custom software written in TEMPO (Reflective Computing, Olympia, WA), which also sent 8-bit behavioral event marker codes simultaneously to separate systems collecting kinematic and neural data, thereby enabling synchronization of the two data streams.
Fig. 1.
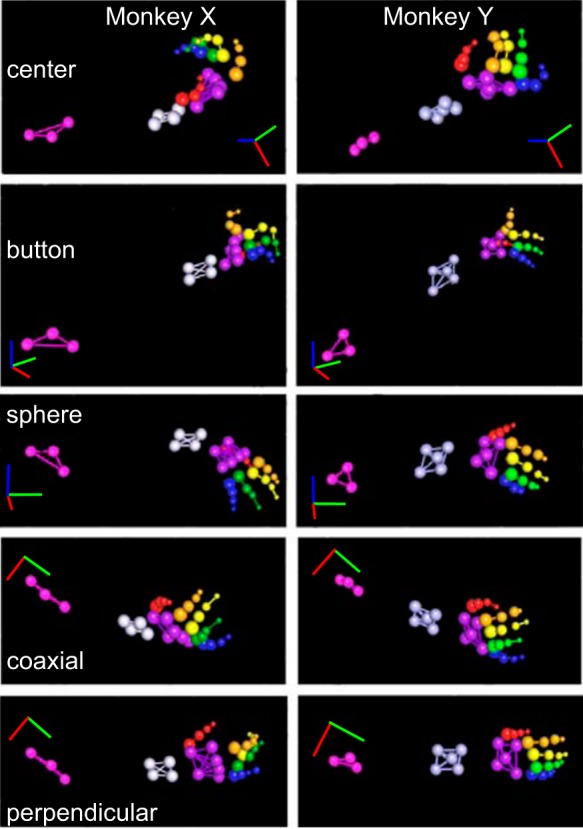
Hand shapes used to grasp objects. For each monkey, X (left) and Y (right), grasp shapes are shown as the location of markers on the dorsum of the fingers, hand, and forearm in selected frames of three-dimensional video motion tracking data. Although different points of view were selected for different objects so as to provide optimal visualization of the fingers, for both monkeys a similar point of view was used for a given object, as indicated by the axes: red (right), blue (up), green (anterior). All markers were 3 mm in diameter, but are shown larger on the forearm and hand, becoming progressively smaller from proximal to distal on the digits. All markers also reflected infrared light, but are shown in pseudocolors to distinguish different body parts: red (thumb), orange [index (I) finger], yellow [middle (M) finger], green [ring (R) finger], blue [little (L) finger], purple (palm dorsum), gray (distal forearm), magenta (proximal forearm).
Table 1.
Summary of successful trials
| Recording Session | Button | Sphere | Coaxial Cylinder | Perpendicular Cylinder | Total |
|---|---|---|---|---|---|
| X0918 | 117 | 117 | 113 | 115 | 462 |
| X1002 | 72 | 67 | 60 | 69 | 268 |
| Y0211 | 171 | 168 | 164 | 167 | 670 |
| Y0304 | 113 | 109 | 111 | 107 | 440 |
Values are nos. of trials.
Kinematic tracking.
Kinematic data tracking the monkey's hand and finger movements were acquired using an 18-camera video motion tracking system (Vicon Motion Systems, Oxford, UK) at a 200-Hz frame rate. The video system tracked the Cartesian position of up to 34 adhesive infrared reflective markers (3 mm in diameter each, Optitrack, Eugene, OR) on the dorsal aspect of the forearm and hand. Three markers were placed on the proximal forearm, five on the distal forearm, five (monkey X) or six (monkey Y) on the back of the hand, two on the metacarpal and two on the proximal phalanx of the thumb, and two on the proximal and two on the middle phalanges of each finger (Fig. 1). A model of each subject's marker placement then was calibrated in Vicon's Nexus software. After recording sessions, postprocessing of the video motion data was performed to ensure that all markers were labeled correctly. Only trials in which all markers had been tracked continuously were used for analysis. For these trials, we used an articulated model of the arm, hand and fingers to convert the three-dimensional marker position data to Euler angles for each of 18 rotational DoFs (Aggarwal et al. 2013). Unless otherwise specified, the 18 joint angles are presented in the following order: 1) wrist flexion/extension; 2) wrist radial/ulnar deviation; 3) forearm supination/pronation; 4) thumb opposition; 5) thumb flexion/extension; 6) thumb abduction from the palm; 7) index finger MCP flexion/extension; 8) middle finger MCP flexion/extension; 9) ring finger MCP flexion/extension; 10) little finger MCP flexion/extension; 11) index finger PIP flexion/extension; 12) middle finger PIP flexion/extension; 13) ring finger PIP flexion/extension; 14) little finger PIP flexion/extension; 15) index finger ab/adduction at the MCP; 16) middle finger ab/adduction at the MCP; 17) ring finger ab/adduction at the MCP; and 18) little finger ab/adduction at the MCP.
Neural recording.
Simultaneous spiking and LFP activity were recorded from floating microelectrode arrays (MicroProbes, Gaithersburg, MD) implanted in both the M1 and the premotor cortex (PM), which, taken together, we refer to as “motor cortex.” In monkey X, five arrays were implanted in M1 and two in PM; in monkey Y four arrays were implanted in M1 and four PM (Fig. 2). Each floating microelectrode array consisted of 16 recording electrodes of various lengths between 1 and 9 mm. Neurophysiological signals recorded from these arrays using a Plexon data acquisition system (Plexon, Dallas, TX) were hardware filtered separately for LFPs (0.7–175 Hz bandpass) and spikes (100 Hz to 8 kHz). LFPs from every other electrode (56 total electrodes in monkey X and 64 in monkey Y) were amplified with an additional gain of 50 and digitized at 1 kHz. One LFP channel from monkey X was found to have excessive noise and was discarded from further analysis. All decoding analyses described below, therefore, used a maximum of 55 LFP channels to provide accurate comparison of results from the two monkeys. Spiking activity was amplified to a final gain of 1,000–32,000× and sampled at 40 kHz, and waveforms crossing an interactively set threshold were stored for analysis. Initial spike sorting was performed online, and then refined offline using Plexon's Off-Line Sorter. Both well-isolated single-unit (SU; signal-to-noise ratio > 3 and interspike intervals all > 1 ms) and multiunit (MU; signal-to-noise ratio ≤ 3 and/or some interspike intervals ≤ 1 ms) recordings (Mollazadeh et al. 2011) were used as spike recordings in the present analyses (Table 2).
Fig. 2.
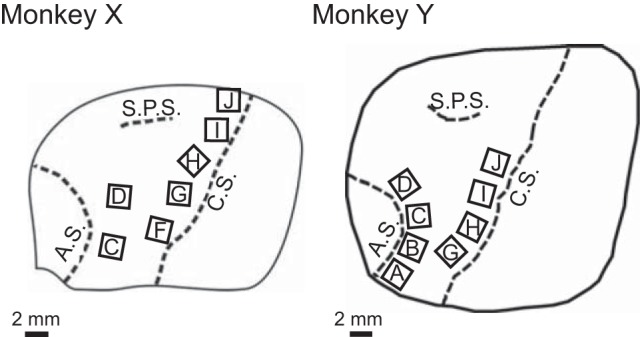
Locations of floating microelectrode arrays implanted in both monkeys. Drawings were based on intraoperative photographs. In monkey X, arrays labeled F, G, H, I and J were implanted in the primary motor cortex (M1) and arrays C and D in the premotor cortex (PM). In monkey Y, arrays G, H, I and J were in M1 and arrays A, B, C and D were in PM. AS, arcuate sulcus; CS, central sulcus; SPS, superior precentral sulcus.
Table 2.
Summary of spike recordings and LFP channels
| Spike Recordings |
|||||
|---|---|---|---|---|---|
| Recording Session | SUs | MUs | Total | Used for decoding | LFP Channels |
| X0918 | 36 | 131 | 167 | 134 | 55 |
| X1002 | 17 | 134 | 151 | 116 | 55 |
| Y0211 | 69 | 50 | 119 | 85 | 64 |
| Y0304 | 47 | 54 | 101 | 74 | 64 |
Values are nos. of recordings. SUs, single-unit recordings; MUs, multiunit recordings; LFP, local field potential.
LFP power estimation.
All data analysis was performed in Matlab 2009b (Mathworks, Natick, MA). Spectral analyses were performed with the Chronux toolbox (http://chronux.org/). Prior to power estimation of LFP signals, power-line noise was removed offline using an F-test (Percival and Walden 1993). LFP power spectra were calculated using multitaper analysis (Jarvis and Mitra 2001; Mitra and Pesaran 1999). Each data segment first was convolved with a Slepian data taper, and the corresponding spectral amplitude was calculated using a Fourier transform over a 250-ms window which was shifted in increments of 20 ms. For optimal frequency resolution, a lower spectral concentration was employed in low-frequency ranges (±4 Hz for 5–22 Hz) than in higher frequency ranges (±12 Hz for 25–175 Hz).
For continuous data, the windowed Fourier transform can be defined as:
| (1) |
where xt (t = 1,…,N) are the time series of the signal for N data points, and wk (k = 1,…,K) are the set of K orthogonal data tapers. The multitaper power spectral estimate, Sx(f), is then defined as:
| (2) |
For each trial, this LFP power was log-transformed and then averaged across the frequency points within each of five frequency bands, 6–14 Hz, 15–22 Hz, 25–40 Hz, 75–100 Hz and 100–170 Hz, similar to the bands our laboratory has used previously (Mollazadeh et al. 2011).
PCA.
PCA was performed on joint angle kinematics to identify kinematic synergies. If Yt = [f1t, f2t,…, f18t] is the vector of 18 joint angles at time t, then we can construct the 18 × N matrix Y = [Y1, Y2,…, YN] of all time points t = 1,…, N. PCA was implemented using a singular values decomposition method:
| (3) |
where the columns of U are the eigenvectors (new basis set), ∑ is the matrix of singular values (square root of eigenvalues of the movement covariance matrix, i.e., variance of each PC), and V is the matrix of temporal weightings for each eigenvector. Note that the mean of the kinematic data, Y0, was subtracted before singular values decomposition.
Similar to Thakur and colleagues (2008), kinematic synergies, Si, then were defined as the range of hand postures along each eigenvector, Ui,
| (4) |
where α is a scale factor chosen such that the motion of the hand was constrained to its biologically feasible range (e.g., the fingers were not allowed to extend more than a few degrees dorsal to the plane of the palm). We used a three-dimensional model of a monkey hand (Davoodi and Loeb 2012) and chose an appropriate value of α interactively. The kinematic data in the PC space projected along each eigenvector, i, of the new basis set then can be written as:
| (5) |
jPCA analysis.
We thus used PCA, as have others, to identify kinematic synergies as orthogonal axes of maximal correlated variance in the joint angles of the hand. PCA does not capture dynamic aspects of the correlation motion of the joints, however. We, therefore, also applied the recently introduced method of jPCA to capture dynamic synergies (Churchland et al. 2012). Briefly, the kinematic data were first normalized and mean-centered. PCA was then used to reduce the dimensionality of the data from 18 to 8. As noted by Churchland and colleagues (2012), using PCA as a preprocessing step reduces any concern that the resulting jPCs are merely a product of high dimensionality in the original data. Assuming the reduced dataset is Y, the simplest system that can describe the dynamical structure in the data can be written as:
| (6) |
The matrix, M, which describes the dynamic rotational structure in the data, can be found by solving the least square problem over a set of skew-symmetric matrices.
| (7) |
Projection in the jPC space is accomplished by first calculating the eigenvectors of the Mskew matrix (v1…v8) and then making real vectors from imaginary eigenvectors as Ui = vi + vi+1 and Ui+1 = j(vi − vi+1). The kinematic data in the jPC space then can be written as:
| (8) |
Isomap.
We also applied isomap, a nonlinear dimensionality reduction technique, to the present kinematic data (Tenenbaum et al. 2000). Isomap combines the computational efficiency and global optimality advantages of both PCA and multidimensional scaling, while guaranteeing asymptotic convergence. Isomap was implemented using the isomap toolbox (http://isomap.stanford.edu/) and Dijkstra's algorithm to compute graph distances. In brief, isomap uses the Euclidean distances between all pairs of points i,j in the data set X to: 1) construct a neighborhood graph, G, using K nearest neighbors; 2) estimate the geodesic distances, dG(i,j), between all pairs of points by calculating shortest path between them along edges of the graph, creating matrix DG = [dG(i,j)]; and 3) calculate the projection of the original data along the dimensions of the geodesic manifold as Vpi, where λp is the pth eigenvalue, and Vpi is the ith component of the pth eigenvector of the matrix, HDij2H/2, where H is a centering matrix.
Setting K = 5 to 10 provided similar results for our kinematic data, and we, therefore, report results using K = 7. As for any finite set of data, for each recording session a small fraction of the points was disconnected from the rest of the graph, and these points, therefore, were removed from DG. The variance explained was calculated as the percentage of the variance of DG captured in the projections. In our four sessions, the first four isomap dimensions (projections) on average explained 77% of the variance (range: 55% to 88%), and using up to 10 dimensions did not increase the variance explained by more than 1% for any session. We, therefore, report results using the first four isomap dimensions.
Decoding hand kinematics.
To predict original joint angles, PCs, or jPCs, we built a separate decoding model for each of seven different types of neurophysiological signal: LFP amplitude, LFP power in the 6- to 14-Hz, 15- to 22-Hz, 25- to 40-Hz, 70- to 100-Hz and 100- to 170-Hz bands, and spike firing rate, all calculated in a 250-ms time window prior to the time of the kinematic parameter (0-ms lag). All features were calculated in sliding temporal windows that advanced in 20-ms steps. Kinematic data, therefore, were downsampled to 50 Hz (20 ms), providing numbers of data points equivalent to the neural (LFP) data. We did not perform any filtering or smoothing on kinematic data. We built models using neural data from both M1 and PM, as well as from each cortical region separately.
A linear Gaussian state-space model (Kalman filter) was built for each decoded parameter (individual joint angles, PCs, or jPCs):
| (9) |
| (10) |
where yt (t = 1,…,N) is the vector of original joint angles, PCs or jPCs at time t, and Sx,t is the current neurophysiological signal type (LFP amplitude, LFP power in a given frequency band, or spike firing rate) from a subset of channels, x, at time t (i.e., in the 250-ms window preceding time t). A and H are the state transition and observation matrices, respectively, wt ∼ N(0,W) and qt ∼ N(0,Q) are the Gaussian noises in the model with covariance matrices W and Q, respectively. We used a previously described algorithm to estimate the parameters of the state-space model (Wu et al. 2006). Both state variables and observations were normalized to zero mean and unit SD across all trials before being passed to the decoding model.
All results are reported under fivefold cross-validation obtained from mutually exclusive feature sets. Within each of the five cross-validation sets, decoding was repeated 10 times for each number of input features, using 10 randomly chosen subsets of input features. The decoding performance of each of these 10 repetitions was evaluated by computing Pearson's correlation coefficient (CC) and normalized root mean squared error (RMSE) between actual and predicted parameters. CC and RMSE were computed separately for each decoded parameter. The results of these 10 repetitions then were averaged for a given cross-validation set. We then report the mean ± SD across the five cross-validation sets. Such repeated decoding ensured a relatively even sampling of the available neural activity.
RESULTS
We recorded spike and LFP activity from two monkeys performing reach-to-grasp movements while we simultaneously tracked the kinematics of their hand and wrist (Mollazadeh et al. 2011). Two sessions recorded from each monkey were analyzed to evaluate consistency between sessions from the same monkey as well as between monkeys.
Range of movements.
Our monkeys were required to pull the central object to initiate a trial, and then on cue to reach to and grasp four different peripheral objects. The wrist orientation and hand shapes used to accomplish the four reach-to-grasp movements were otherwise unconstrained, however, permitting each monkey to choose the details of the movements and postures it used. Figure 1 shows that the two monkeys often chose somewhat different hand shapes for operating the same object. Monkey X, for example, grasped the central coaxial object from below, whereas monkey Y grasped the same object from above. Monkey X typically operated the button by resting the index fingertip on the surrounding tube with the MCP joint in extension and then flexing the index PIP and DIP joints, thereby pushing the back of the DIP knuckle into the button; in contrast, monkey Y simply pushed the button with the tip of the fully extended index finger. And monkey X placed its hand on top of the sphere, whereas monkey Y placed its hand on the side.
Although the monkeys grasped only a central object and four different peripheral objects, Fig. 3 illustrates that the variation in joint angles, nevertheless, covered substantial ranges for all DoFs studied. The data used in this study were taken from the time at which the instructional cue appeared (Cue) to the time at which the monkey manipulated the object closing the switch (SC), limiting the contributions of initial and final holding postures and eliminating from analysis movements made during intertrial intervals. For different joints, histograms are shown of the percentage of data samples during which that joint was at various angles. The three DoF at the wrist, flexion/extension, abduction/adduction (radial/ulnar deviation), and rotation (pronation/supination), each covered a range of ∼60–80° (Fig. 3A). Thumb roll (opposition) and MCP flexion/extension each covered ∼50°, while thumb abduction/adduction at the carpometacarpal joint covered ∼25° (Fig. 3B). MCP, PIP and abduction/adduction angles each have been pooled across the four fingers, showing ranges of ∼100° for each of these three DoF categories (Fig. 3C). For several DoFs, such as wrist rotation and thumb MCP flexion/extension, multiple peaks are evident in these histograms, reflecting different postures used to grasp different objects. Such peaks are less evident for the finger DoFs, in part because data in each category have been pooled across the four fingers. To illustrate how the motion of different joint angle DoFs varied as a function of time, depending on the object being grasped, the time course of each of the 18 monitored joint angles and the 18 resulting PCs from session X0918 is shown in Fig. 3D and 3E, respectively. As can be seen, most of the motion occurred in the first ∼300 ms after the onset of movement in both joint and PC traces. Similar observations were made for the data from other recording sessions.
Fig. 3.

Distributions of joint angle data. Hand movements entailed substantial variation in each of the joint angles, as illustrated in these histograms: wrist angles (A), thumb angles (B), and finger angles (C). Data for each type of joint in C have been pooled across the four fingers: I, M, R and L. Data shown in A, B and C have been pooled across both sessions and all trials from monkey X. D: the time course of angular position at each joint averaged across all successful trials for each peripheral object from session X0918. The calibration bar at right indicates 180°. E: the time course of motion along the 18 principal components (PCs) derived from these joint angles. Because the PCs are dimensionless, the calibration bar is in arbitrary units (a.u.). Data in D and E all were aligned at the onset of movement (dashed vertical lines at time 0). Red traces indicate the mean across all successful trials of each type; gray shading indicates ± 1 SD. Flex/Ext, flexion/extension; Ab/Add, abduction/adduction; Rot, rotation; MCP, metacarpophalangeal; PIP, proximal interphalangeal.
Correlations between joints.
Previous studies of grasping have shown substantial correlation between various joint angles in patterns that are relatively consistent across human subjects (Santello et al. 1998). In particular, the four MCP joints tend to be highly correlated with one another, especially for adjacent fingers, as do the four PIP joints, and the abduction/adduction angles at the MCP joints. Figure 4 shows the pairwise correlations between individual joint angles across all successful trials in one session from each of the present monkeys. Correlations are expressed as the coefficient of determination (R2) to parallel Fig. 4 of Santello and colleagues (1998).
Fig. 4.

Pairwise correlations between joint degrees of freedom (DoFs) in one session from each monkey. R2 values were calculated using data from all successful trials of all four objects. Nonsignificant values (P ≥ 0.05) have been assigned an R2 = 0. Dashed boxes group DoFs of the wrist (W), the thumb (T), finger MCP Flex/Ext, finger PIP Flex/Ext, and finger MCP ab/aduction angles.
Overall, whereas some pairs of joints showed high correlations, many other pairs showed low or absent correlations. High correlations were present between some pairs of MCP joints, pairs of PIP joints, and between MCP and PIP joints, although the strength of particular correlations differed between monkeys. The abduction/adduction angles between the fingers, the thumb angles and the wrist angles showed relatively lower correlations with the finger MCP and PIP angles.
Kinematic synergies.
Whereas these correlations between joints are averaged across all of the present reach-to-grasp movements, PCA captures the different patterns of correlation among joints during different grasps. To extract these kinematic synergies, we performed PCA on the kinematic data from each session separately. Figure 3E illustrates the time course of motion projected along each of the 18 PC eigenvectors. Figure 5 shows the cumulative sum of the eigenvalues for each session. Similar to previous studies, the first PC accounted for 60% of the variance on average (range: 43–75% in different sessions), and the first two PCs accounted for 78%. The first seven PCs accounted for ≥95% of the variance in each of the four sessions. Likewise, the eight jPCs accounted for ≥95% of the variance in each of the four sessions, and the first four isomap dimensions accounted for 77% of the variance averaged across sessions (not illustrated).
Fig. 5.
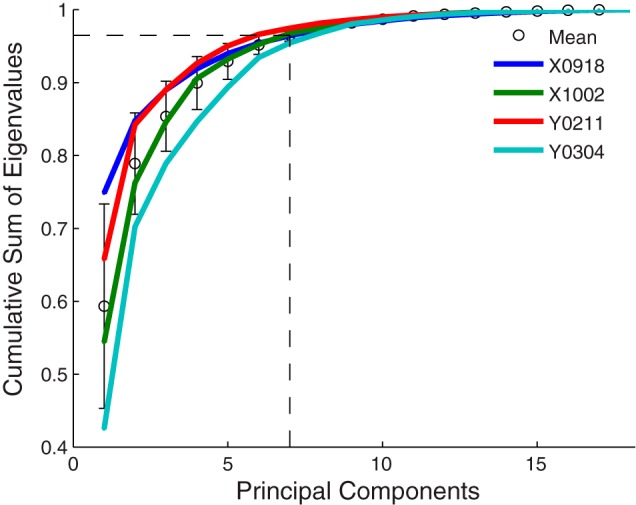
Cumulative variance in the kinematic data accounted for by different numbers of PCs. Separate curves are shown for each session, along with their mean (circles) and SD (error bars). Dashed lines indicate that the first 7 PCs accounted for ∼95% of the variance in the kinematic data.
The first four PCA-derived kinematic synergies obtained for one session from each monkey are illustrated in Fig. 6 as variations in hand shape. The first synergy (S1) in monkey X was dominated by motion of the little and ring fingers more than the thumb, index or middle finger. In contrast, S1 in monkey Y was dominated by motion of the index, middle and ring fingers. The second synergy (S2) in monkey X was dominated by motion at the wrist, both abduction/adduction (radial/ulnar deviation) and flexion/extension, with some contribution from the ring and little fingers; in monkey Y, S2 was dominated by motion in the little and ring fingers, with some contribution from the middle finger and wrist. S3 was dominated by flexion/extension of the index MCP with abduction/adduction of the thumb and wrist in monkey X, but by flexion/extension at the index, middle and ring PIP joints, and the thumb and little finger MCP joints in monkey Y. S4 was dominated by wrist, index and middle finger flexion/extension in monkey X; whereas extension of the index and little finger MCPs with concurrent flexion of their PIPs dominated in monkey Y. Each of these low-order synergies in both monkeys combined differential movement of one or more digits with some degree of opening and closing of the hand, not unlike those observed in complex manipulative movements of the human hand (Todorov and Ghahramani 2004).
Fig. 6.
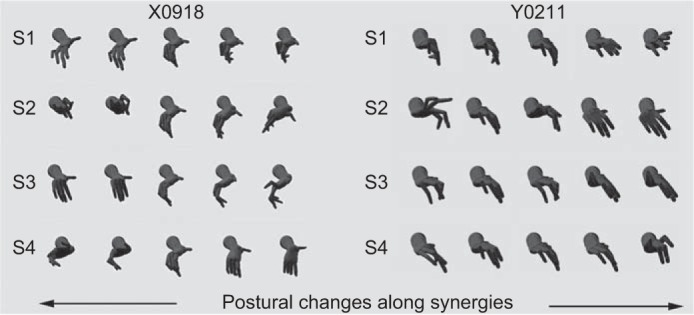
Kinematic synergies identified with PC analysis. For one session from monkey X (left) and one from monkey Y (right), the first four kinematic synergies (S1–S4) are illustrated as variations in hand postures. Each row shows five hand postures sampled along the indicated synergy. On average, the first four synergies accounted for 90% of the data variance across all data sets (see Fig. 5). The three-dimensional model of a Rhesus monkey's hand used to illustrate these postures was generated and rendered in the Musculo-Skeletal Modeling System provided courtesy of Davoodi and Loeb (2012) with permission.
Correlating neuronal activity with PCs, with jPCs, or with isomap dimensions.
If motor cortex neurons controlled the hand by driving PCs, one would expect the discharge of a given neuron to correlate more strongly with a particular PC than with the motion of any individual joint. The activity of a cortical neuron representing a given PC then would be distributed to spinal interneurons and motoneuron pools in such a way as to facilitate a specific pattern of correlated motion in multiple joints. Because the motion of individual joints would be projected onto multiple PCs, the activity of a neuron facilitating a particular PC would correlate less well with the motion of any individual joint.
To examine this possibility, we concatenated the firing rate of each spike recording as a function of time from all successful trials performed in a given session. We also concatenated the corresponding temporal trajectories of each of the 18 joint angles and the temporal weightings of each of the 18 PCs. For each spike recording, we then performed separate cross-correlations of the neuron's concatenated firing rates with each of the 18 joint angles and with each of the 18 PCs for leads/lags up to ±200 ms, which can be expected to cover the relevant time period of relationships between neuron discharge and either joint rotation or motion along PCs. To identify significant values in the resulting cross-correlation functions, we shuffled the trial order of the spike firing rate data and repeated the cross-correlations with each joint angle and each PC 100 times, using these 100 shuffled cross-correlations to define 95% confidence intervals for each time bin of each unshuffled cross-correlation. For each spike recording, we then identified both the maximum significant absolute cross-correlation (MAXC) with any joint angle and the MAXC with any PC, using the absolute values so as to treat positive and negative correlations as equally meaningful. If no significant correlations were found, a value of zero was assigned.
Figure 7A shows a scatterplot of these maximum correlations from session X0918. Each point in this scatterplot represents a different spike recording plotted at the coordinates of its MAXC with any joint angle (abscissa) and its MAXC with any PC (ordinate). Open squares mark points representing SUs; other points are considered MUs.
Fig. 7.

Maximal absolute cross-correlations with joint DoFs vs. PCs. A: in this scatterplot, each point represents a spike recording plotted at the coordinates of its maximum significant absolute cross-correlation (MAXC) with any joint (abscissa) vs. its MAXC with any PC (ordinate). Points representing single units (SUs) have been marked with open squares; other points represent multiunit (MU) recordings. The solid line has a slope of 1.0, and the dashed line is the linear regression best fit to the data (SUs + MUs). B: two-dimensional histogram and marginal one-dimensional histograms show the number of spike recordings that had their MAXC with each joint DoF and with each PC. The data shown in A and B represent all spike recordings (SUs + MUs) from session X0918. C and D represent identical analysis performed after replacing each real spike recording with a simulated recording created to correlate with a joint angle from session X0918, whereas E and F represent identical analysis performed after replacing each real spike recording with a simulated recording created to correlate with one of the PCs.
Overall, the MAXCs with joint angles and with PCs were themselves correlated across the spike recordings. Both SUs and MUs that had relatively high correlation with a joint angle also had a relatively high correlation with a PC. This was the case for all four sessions from the two monkeys. For SUs, ρ (the CC between MAXCs for joints and MAXCs for PCs) ranged from 0.93 to 0.99 (P < 10−7 for each session) across the four recording sessions; for SUs and MUs together, ρ ranged from 0.96 to 0.98 (P < 10−56 for each session).
Further inspection of Fig. 7A, however, shows that relatively few spike recordings were represented by points falling above the line of unity slope (solid line), indicating a stronger correlation with a PC than with any joint angle. Substantially more points fell below the line of unity slope, indicating that these spikes had a somewhat stronger maximal cross-correlation with a joint angle than with any PC. Considering the points representing SUs and MUs together, in this session 26 fell above the line and 141 below. For the other three sessions, the ratios of points falling above the line to those falling below were as follows: 32:119, 27:92, and 33:68.
Initially we tested the null hypothesis that points were equally likely to fall above or below the line. For each of the four sessions, however, the likelihood of finding the smaller number of points above the line was significantly different from 50:50 chance (P < 0.0005, binomial test). Nonparametric, paired testing further showed that the majority of spike recordings had higher MAXCs with a joint angle than with any PC for SUs considered alone (P < 0.005, Wilcoxon signed-rank test) in all sessions except X1002, which had only 17 SUs. Considering SUs and MUs together, the difference was significant for each of the four sessions (P < 10−6, Wilcoxon signed-rank test). The discharge of most motor cortex neurons thus did not correlate more strongly with PCs than with the original joint angles; indeed, the reverse was true.
Moreover, in the scatterplot of Fig. 7A, points representing individual spike recordings tended to lie progressively further below the line of unity slope as one progresses from lower to higher MAXCs. Indeed, the (dashed) line best fitting these data for both SUs and MUs together had a slope significantly less than unity for each of the four recording sessions (range: 0.73–0.93, P < 0.05), and the slope also was less than unity if only SUs were considered (range: 0.80–0.90, P < 0.05). Hence motor cortex neurons that showed progressively stronger correlations with kinematics tended to be progressively more strongly correlated with a joint angle than with any PC.
The two-dimensional histogram of Fig. 7B shows how many spike recordings (both SUs and MUs) were maximally correlated with each joint angle and with each PC. The marginal histograms show that MAXCs of different spike recordings were distributed across the 18 joint angles, but MAXCs were much more common with low-order PCs, with PC1 being most common. This pattern was observed in the data from each of the four recording sessions.
Whereas the original joint angles were correlated with one another to varying degrees (Fig. 4), the PCs by definition were not correlated with one another. We, therefore, considered the possibility that the quantitative differences in spike-recording cross-correlations with joint angles vs. PCs might result simply from the difference in correlation structure among the original joint angles vs. their PCs. For each of the four recording sessions, we, therefore, created two sets of simulated spike recordings: one correlated with the original joint angles, and the other correlated with the PCs. To generate a set of simulated neurons, we replaced the concatenated data from each real spike recording in the original data set with the concatenated data from either one of the 18 joint angles or one of the 18 PCs, stepping systematically through the different joint angles or PCs to produce an even distribution. To each simulated neuron we then added one of five levels of Gaussian noise, reducing the correlations between the simulated neuron and the kinematic data to varying degrees, such that the MAXCs of simulated neurons ranged from ∼0.00 to ∼0.70, similar to the range of real-neuron MAXCs. For each set of simulated neurons, we then found the MAXC with any of the original joint angles and the MAXC with any of the original PCs using the same algorithm applied to the real spike recordings.
Figure 7C shows the resulting scatterplot when the simulated neurons were based on joint angle data from the same session illustrated in Fig. 7A. Similar results were obtained for joint-angle-based simulated neurons from each of the four sessions. The MAXC with any joint angle was correlated with the MAXC with any PC (across the four simulated sessions, range: 0.98–0.99, P < 10−74). Here, the vast majority of points fell below the line of unity slope, indicating stronger correlation with a joint angle than with any PC (P < 10−17, Wilcoxon signed-rank test). Simulated neurons with higher MAXCs tended to lie further below the line of unity slope. Across the four simulated sessions using joint-angle simulated neurons, the best fit line had a slope ranging from 0.80 to 0.94, all of which were significantly different from unity (P < 0.05). The histograms of Fig. 7D show that, whereas maximal correlations were distributed evenly across the joints as expected, maximal correlations were most common for low-order PCs, with PC1 being most common. In all these regards, the population of simulated neurons created to correlate with joint angles resembled the real spike recordings for each of the four recording sessions.
Figure 7E shows the resulting scatterplot when the simulated neurons were based on motion along PCs from the same session illustrated in Fig. 7A. The MAXC with any joint again was correlated with the MAXC with any PC (across simulated sessions, range: 0.96–0.97, P < 10−60). But the remaining features of the population of simulated neurons based on motion along PCs differed qualitatively from the features of the real spike recordings. The vast majority of points now fell above the line of unity slope, indicating stronger correlation with a PC than with any joint angle (P < 10−17 for each simulated session). The slope of the best fit line in this simulated session was 1.01 and did not differ from unity, but the slope was significantly greater than 1 in the other three sessions of simulated neurons based on motion along PCs (range: 1.06–1.19, P < 0.05). The marginal histograms of Fig. 7F show that, whereas maximal correlations were distributed relatively evenly across the PCs as expected, maximal correlations with joints also were distributed across most of the 18 joints, as was seen in all four sessions with simulated PC-related neurons. In these regards, the populations of simulated neurons created to correlate with PCs were qualitatively distinct and readily distinguished both from the population simulated to correlate with joint angles (Fig. 7, C and D) and from the population of real spike recordings (Fig. 7, A and B). We infer that the stronger correlation with joint angles than with PCs observed for the majority of real spike recordings did not result simply from the difference in correlation structure among the joint angles vs. that among the PCs.
We also examined the MAXC of the spike recordings from each session with jPCs, which capture rotational dynamics, applying the same process used to find MAXCs with joint angles and with PCs. Using data from session Y0304, Fig. 8A shows a scatterplot of MAXCs with joint angles vs. PCs (analogous to Fig. 7A), whereas Fig. 8B shows a similar scatterplot of MAXCs with joint angles vs. jPCs. This comparison of joint angles vs. jPCs (Fig. 8B) shows many of the same features of the joint angle vs. PC comparison: across spike recordings, whether SUs only or both SUs and MUs, the MAXC with any joint angle was correlated with the MAXC with any jPC (SUs only, range: 0.93–0.99, P < 10−7; SUs + MUs, range: 0.94–0.98, P < 10−49). Although some points lie above the line of unity slope, indicating stronger correlation with a given jPC than with any joint angle, most points lie below the line, indicating stronger correlation with a given joint angle than with any jPC (for SUs only, P < 10−8 for all sessions except X1002 which had only 17 SUs; for SUs + MUs, P < 10−8, Wilcoxon signed-rank test). Using only SUs, the best fit line did not have a slope different from 1. But using both SUs and MUs, the best fit line had a slope less than 1 (range: 0.88–0.95, P < 0.05), indicating that spike recordings with progressively stronger correlations were progressively more strongly correlated with a joint angle than with any jPC.
Fig. 8.
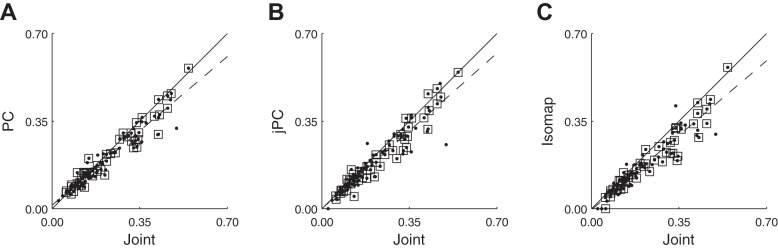
Maximal absolute cross-correlations with joint DoFs vs. PCs, jPCs, or isomap dimensions. A: in this scatterplot using data from session Y0304, each point represents a spike recording plotted at the coordinates of its MAXC with any joint (abscissa) vs. its MAXC with any PC (ordinate). B: a similar scatterplot using data from the same session, but now the ordinate represents the MAXC with any jPC. C: a similar scatterplot for isomap dimensions. In all three frames, points representing SUs have been marked with open squares; other points represent MU recordings. The solid line has unity slope, and the dashed line is the linear regression best fit to the data (SUs + MUs).
Lastly, we examined the MAXC of the spike recordings from each session with isomap dimensions, reduced dimensions along a nonlinear manifold. We again applied the same process to find MAXCs. Figure 8C shows a scatterplot of MAXCs with joint angles vs. MAXCs with isomap dimensions, again for spike recordings from session Y0304. This comparison shows many of the same features of the joint angle vs. PC or jPC comparisons: across spike recordings, whether for SUs only or for both SUs and MUs, the MAXC with any joint angle was correlated with the MAXC with any isomap dimension (SUs only, range: 0.87–0.95, P < 10−5; SUs + MUs, range: 0.89–0.95, P < 10−43). Although some points lie above the line of unity slope, indicating stronger correlation with a given isomap dimension than with any joint angle, most points lie below the line, indicating stronger correlation with a given joint angle than with any isomap dimension (for SUs only, P < 10−2; for SUs + MUs, P < 10−7, Wilcoxon signed-rank test). The best fit line had a slope less than 1 whether using SUs (range: 0.58–0.87, P < 0.05) or both SUs and MUs (range: 0.57–0.85, P < 0.05), indicating that spike recordings with progressively stronger correlations were progressively more strongly correlated with a joint angle than with any isomap dimension.
In summary, individual SUs and MUs showed similar MAXCs with a joint angle, with a PC, with a jPC, and with an isomap dimension, but, for the majority of both SUs and MUs, maximal cross-correlations were larger with a given joint angle than with any PC, jPC, or isomap dimension. Contrary to the notion that motor cortex neurons represent the kinematic synergies identified by PCA, jPCA, or isomap, these observations provide evidence that, if anything, the original joint angles are represented in the activity of most motor cortex neurons somewhat more strongly than the kinematic synergies captured with these dimensionality reduction approaches. Because simultaneously recorded populations may provide more information than individual spike recordings, we next used decoding analyses to examine the representation of joint angles and their reduced dimensions in spikes and LFPs. Given that isomap generally produced weaker correlations with spike recordings, here we focused on PCs and jPCs.
Decoding joint kinematics, PCs and jPCs from neural activity.
During reach-to-grasp movements, individual DoFs can be decoded relatively accurately using either spike recordings or LFPs in various frequency bands recorded from either M1 or PM (Aggarwal et al. 2013; Bansal et al. 2011; Vargas-Irwin et al. 2010). Whereas a population of spike recordings is thought to reflect neuronal output from a region, LFPs are thought to reflect synaptic input (Fromm and Bond 1964; Gray et al. 1989; Mitzdorf 1985). We, therefore, considered the possibility that a transformation in neural representation from PCs to joint angles might occur in the motor cortex. If so, then PCs might be decoded more accurately than joint angles from LFPs, and conversely joint angles might be decoded more accurately than PCs from spike recordings.
We evaluated the extent to which both the individual joint DoFs and the individual PCs could be decoded from these neurophysiological signals. We used both SUs and MUs to assess the decodable information available from spiking activity (Bansal et al. 2012; Chestek et al. 2009; Stark and Abeles 2007); however, here we used only those SUs and MUs with a mean firing rate greater than 1 Hz (Table 2, Used For Decoding). Furthermore, to compare results across recording sessions, we limited our analysis to a maximum of 55 recordings, the number of LFP channels available from monkey X.
Figure 9 shows decoding performance for the best decoded joint DoF (A) and the best decoded PC (B) from each session. For each number of features used in decoding, whether spikes or LFPs, accuracy was quantified as the average CC between the actual and predicted values of the kinematic parameter across fivefold cross-validation. The error bars in Fig. 9 indicate the standard deviation across the five folds.
Fig. 9.

Prediction of original joint angles and their PCs from neurophysiological signals. Decoding accuracy of the best decoded joint DoF (A) and best decoded PC (B) in each session is shown as a function of the number of features used for spike recordings (including both SUs and MUs) and for local field potential (LFP) power in the 100- to 170-Hz band. Decoding accuracy has been quantified as the correlation coefficient (CC) between the actual and predicted parameters. Error bars represent SDs across 5-fold cross-validation of each point. LFP power in the 100- to 170-Hz band (High Gamma) generally provided higher CCs than LFP power in the remaining bands or LFP amplitude, and hence LFP decoding results are shown only for this band. The curve for the best decoded PC has been subtracted from that for the best decoded joint DoF in each session separately for spike recordings (C) and high-gamma LFP power (D). Note the expanded scale of the ordinate in C and D.
Among LFP features, the high-gamma band (100–170 Hz) provided higher decoding accuracy for both joint angles and PCs, and hence results using this band are shown in the figure. The best decoded joint DoF was chosen as the one which had the highest decoding accuracy using all 55 features. The best decoded joint DoF varied from session to session as indicated in the figure legends, whether using spike recordings or LFPs. The best decoded PC likewise was chosen as the PC which had the highest decoding accuracy using all 55 features. In all four sessions, however, the best decoded PC always was PC1, whether using spike recordings or LFPs. As the number of features used for decoding was increased from 1 to 55, decoding accuracy for the best decoded joint rose from between 0.15 and 0.5 to between 0.75 and 0.85, while RMSE (not illustrated) fell from between 25% and 35% to between 13% and 20%. Similarly, decoding accuracy of the best decoded PC rose from between 0.3 and 0.5 to between 0.7 and 0.85, while RMSE (not illustrated) fell from between 25% and 36% to between 15% and 20%. Overall, decoding accuracy for the best decoded joint angle and the best decoded PC thus was generally comparable, and the decoding accuracy obtained using spike recordings and LFPs was similar.
To compare the decoding of the best decoded joint and the best decoded PC in greater detail, for each session we, therefore, subtracted the curve for the best decoded PC point by point from the corresponding curve for the best decoded joint DoF. These joint-minus-PC difference curves are shown separately for spike recordings (Fig. 9C) and LFPs (Fig. 9D). First we examine the portions of these curves in which more than ∼10 features were used for decoding. In this region, the difference between decoding the best decoded joint and the best decoded PC was relatively constant in each session. For both sessions from monkey X, the positive difference values of ∼0.1 indicate that the best decoded joint was decoded with larger accuracy than the best decoded PC. No clear or consistent difference was apparent between spike- and LFP-based decoding, however. For monkey Y, joint-minus-PC difference values were close to zero for both spike- and LFP-based decoding. Hence, when decoding using more than 10 features, we found no consistent evidence either that PCs were represented more accurately in motor cortex than joint DoFs, or that PCs were represented more in LFPs than in spiking activity.
As fewer and fewer features (∼10 or fewer) were used in decoding, the best decoded PC (PC1) tended to become somewhat more accurately decoded than the best decoded joint, as indicated by negative joint-minus-PC difference values. LFP decoding from monkey X was the exception, as for unclear reasons in both sessions, the difference remained greater than 0. But in each session from monkey X and in each session from monkey Y, the joint-minus-PC difference was more negative for spike-based decoding than for LFP-based decoding when decoding using only one feature. Here, where PC1 was decoded slightly more accurately than the best decoded joint, spike recordings again thus provided somewhat better decoding than LFPs. These findings again provide no consistent evidence that PCs are more represented in LFP activity while joint angles are more represented in spikes and, therefore, fail to support the hypothesis that a PC-to-joint angle transformation occurs in motor cortex.
If motor cortex neurons controlled the hand through the kinematic synergies identified by PCA, then accurate control of the hand would require accurate control not just of PC1 but of multiple PCs. Controlling just the first one or two PCs might permit simple grasping, but not the more dexterous hand shaping seen here, for example, during button-pushing. The motor cortex is crucial for such dexterity, and we, therefore, would expect that PCs beyond the first one or two would be decoded more accurately than joint angles, if the PCs were represented in the motor cortex. Figure 5 indicates that, to control the hand accurately in the present reach-to-grasp movements, capturing 95% of the variance or more, would require controlling at least seven PCs. If motor cortex neurons were controlling the kinematic synergies identified through PCA, then we would expect decoding of PCs to be better than decoding of joint DOFs for at least the first seven PCs.
To examine this possibility, we compared decoding accuracies obtained using 55 spike recordings from each session for joint DoFs, PCs and jPCs beyond the best decoded, as summarized in Table 3. Decoding accuracy is given for 1) the best decoded joint DoF, the best decoded PC and the best decoded jPC; 2) averaged across the first seven PCs that accounted for 95% of the variance (Fig. 5) and averaged across all eight jPCs; and 3) averaged across all joint DoFs and all PCs. Whereas decoding of PC1 tended to be equivalent to that of the best decoded joint DoF, the decoding accuracy for higher-order PCs fell faster than that for additional rank-ordered joint DoFs, such that a substantial disparity between joint decoding and PC decoding was evident in the average across all joint DoFs and across all PCs. Beyond PC1, joint DoFs on average were decoded from spike recordings with higher accuracy than PCs. Even averaging across all 18 joint DOFs, decoding accuracy was higher than averaging across the first seven PCs. These observations suggest that even these first seven PCs were not represented in motor cortex more accurately than the original joint DoFs.
Table 3.
Decoding accuracies for joint degrees of freedom, PCs, and jPCs using 55 spike recordings
| Recording Session | X0918 | X1002 | Y0211 | Y0304 |
|---|---|---|---|---|
| Best-decoded joint | 0.87 | 0.85 | 0.86 | 0.85 |
| All joints | 0.76 ± 0.1 | 0.73 ± 0.15 | 0.76 ± 0.1 | 0.72 ± 0.1 |
| Best-decoded PC (PC1) | 0.82 | 0.71 | 0.86 | 0.83 |
| PC1–PC7 | 0.56 ± 0.17 | 0.53 ± 0.14 | 0.68 ± 0.11 | 0.66 ± 0.1 |
| All PCs | 0.43 ± 0.15 | 0.44 ± 0.15 | 0.51 ± 0.16 | 0.53 ± 0.13 |
| Best-decoded jPC | 0.82 (jPC4) | 0.83 (jPC3) | 0.86 (jPC3) | 0.81 (jPC1) |
| All jPCs (1–8) | 0.69 ± 0.14 | 0.64 ± 0.17 | 0.72 ± 0.1 | 0.69 ± 0.1 |
Values are means ± SD. PC, principal component. The best-decoded jPC for each recording session in noted in parentheses.
Generally, similar results were obtained for the decoding of jPCs. As the number of features used for decoding was increased from 1 to 55, decoding accuracy for the best decoded jPC rose from between 0.2 and 0.5 to between 0.8 and 0.86, while RMSE fell from between 24% and 31% to between 10% and 14% (not illustrated). Decoding accuracy was similar for the best decoded joint and the best decoded jPC, but decoding accuracy was slightly lower when averaged across all 8 jPCs than when averaged across all 18 joints. Like PCs, jPCs thus were not represented in motor cortex more accurately than the original joint DoFs.
Decoding PCs in M1 vs. PM.
Representation of the kinematic synergies defined by PCs might differ between M1 and PM. Neurons in the ventral PM, for example, have been hypothesized to represent canonical hand shapes, such as precision grip or power grasp (Rizzolatti et al. 1987, 1988), which might correspond to particular kinematic synergies. We, therefore, compared the decoding of PC1 obtained from PM with that obtained from M1. Because in monkey X only 15 LFP channels were available in PM, we repeated each decoding analysis 10 times using random samples of 15 spike recordings or LFP channels from each area to provide a fair comparison across neurophysiological signal types and across cortical areas.
Two-way ANOVA using all seven neurophysiological signal types (one LFP amplitude, five LFP frequency band power and one spike firing rate features) and the two cortical motor areas showed a significant main effect of both signal type (P < 0.0001) and cortical area (P < 0.0001), as well as significant interactions (P < 0.0001), on the decoding accuracy of PC1 in each monkey. Post hoc testing (Tukey-Kramer, α = 0.05) showed no significant difference when using spike recordings from M1 vs. PM to decode PC1. Significant differences were present, however, for some LFP frequency bands: 6–14, 15–22, 75–100 and 100–170 Hz in monkey X; and 6–14, 25–40, 75–100 and 100–170 Hz in monkey Y. With the exception of the 25- to 40-Hz band in monkey Y, however, higher accuracy for decoding PC1 was obtained from M1 than from PM. Representation of PC1 thus was not stronger in PM than in M1.
DISCUSSION
Representation of kinematic PCs and jPCs in M1 and PM.
If motor cortex neurons controlled the kinematic synergies represented by PCs, jPCs or isomap dimensions, we would have expected their firing to correlate more strongly with these reduced dimensions than with the original joint DoFs. We found, however, that, across spike recordings, the MAXC of a given SU's or MU's firing rate with a PC, a jPC, or an isomap dimension was similar to its MAXC with an original joint DoF. Some spike recordings had a slightly higher maximal correlation with a reduced dimensions than with any joint DoF, raising the possibility that this subset of motor cortex neurons encoded a particular synergy. But for the majority of spike recordings in each session, the maximal cross-correlation with a joint DoF was higher than that with any PC, with any jPC, or with any isomap dimension (e.g., Fig. 8). Moreover, spike recordings with progressively higher correlations with movement kinematics tended to be progressively more highly correlated with a joint DoF than with any of the reduced dimensions we examined. From these findings we do not infer that the motor cortex controls joint angles per se. Rather, these observations indicate that the firing rate of the majority of motor cortex neurons did not preferentially represent the kinematic synergies identified by PCA, jPCA or isomap.
We also used decoding analysis to examine the representation of PCs and jPCs in spike recordings and LFPs at the population level. For both types of neurophysiological signal, we found that the most accurate decoding of an original joint DoF was similar to that of the most accurate decoding of a PC, which was always PC1. PCs beyond PC1, particularly the first 7 PCs that accounted for 95% of the kinematic variance, however, were not decoded as well as the 18 joint angles on average. Likewise, decoding of the best decoded jPC was comparable to that of the best decoded joint DoF, but other jPCs were less well decoded. These observations provide additional evidence that the kinematic synergies identified by PCA or jPC are not represented more strongly by the majority of neurophysiological signals in the motor cortex than the original joint DoFs.
PC1 was consistently the best decoded PC in each of the four sessions. This dominance of PC1 is to be expected, given that PC1 captured on average 60% of the variance in the kinematic data. The dominance of PC1 accounts for the fact that, using one randomly chosen spike or LFP feature, PC1 was decoded slightly better than the best decoded joint (Fig. 9, C and D). A randomly chosen spike or LFP was more likely to be correlated with PC1 than with any particular joint (Fig. 7B). Indeed, when we created simulated neurons that were correlated a priori with various joint angles and evenly distributed across the 18 joint DoFs, the simulated neurons were by far most often best correlated with PC1 rather than with other PCs, just as the real spike recordings. Thus neurons related to joint kinematics were more likely to correlate better with PC1 than with any other PC, not because they were a priori correlated with PC1, but simply because PC1 captured the majority of the kinematic variance.
Using general linear modeling and temporally extended trajectories, Saleh and colleagues (2010, 2012) found that fewer PCs than joint angles were needed to build accurate point-process models of single-neuron spike trains. If a neuron were related to only one joint, then only that one DoF would have been needed to build an accurate model. Their findings thus indicate that single M1 neurons encode information on more than one joint. But do these models necessarily show that M1 neurons encode kinematic synergies? Typically, more than one PC was needed for these models to reach their full predictive power. If each PC represented a kinematic synergy, this would mean that a single neuron encodes multiple synergies. Up to five PCs were needed to provide the full predictive power of the encoding models. In such case, the synergy actually represented by a given neuron could be some weighted combination of the multiple PCs needed to predict its spike train.
A critical question then becomes whether multiple neurons encode the same synergy. If groups of neurons are found to exist in which all the neurons of a given group encode the same synergy, then the synergy helps us understand how the neurons work to control the hand. The studies of Saleh and colleagues, however, provide little if any evidence of different groups of neurons encoding particular subsets either of joint angles or of PCs. If each neuron encodes a somewhat different combination of joint angles or of PCs, then the concept of kinematic synergies controlled from the motor cortex becomes much less useful. Although we did not undertake a detailed cluster analysis in the present study, preliminary studies based on the peak (or trough) cross-correlations with each of the joint DoFs or with each of the PCs gave little evidence of consistent groups of spike recordings related to the same joint DoF(s) or to the same PC(s). Further studies will be needed to examine the degree to which neural activity represents a limited set of some other type of fixed synergies vs. a more distributed representation of joint DoF combinations.
Synergies and neural control of movement.
The present study has been limited to the kinematic synergies identified by PCA, jPCA, or isomap. Our findings do not exclude a number of other possibilities, however. Other methods of dimensionality reduction, either linear or nonlinear, may be better able to identify kinematic synergies used by the nervous system. Alternatively, rather than working in the domain of kinematic synergies, the motor cortex instead might control muscle synergies (D'Avella and Bizzi 2005; Overduin et al. 2012, 2014).
Furthermore, much of the basic generation of synergies, whether kinematic or muscle based, might occur at subcortical levels. Subcortical centers that might drive muscle synergies include the pontomedullary reticular formation (PMRF) and the spinal gray matter (Giszter and Hart 2013). Neurons in the intermediate zone of the lumbar spinal gray of the spinalized frog provide premotor drive for a limited number of muscular synergies (Hart and Giszter 2010), and rostral midbrain transection in the frog leaves most natural muscular synergies intact (Roh et al. 2011). In monkeys, outputs from the PMRF produce relatively stereotyped facilitation of ipsilateral flexors and suppression of ipsilateral extensors (Davidson and Buford 2006, 2004; Davidson et al. 2007), including hand muscles (Baker 2011; Riddle et al. 2009), and PMRF neurons participate in visually targeted reaching movements (Buford and Davidson 2004; Stuphorn et al. 1999). Together, these two observations suggest that muscle synergies driven by PMRF neurons probably are active during reach-to-grasp. Muscle synergies indeed have been identified during reach-to-grasp movements in both monkeys (Overduin et al. 2008, 2012) and humans (D'Avella et al. 2006, 2008, 2011), and remain largely unchanged after stroke damages the frontal cortex (Cheung et al. 2009), consistent with such synergies resulting from activity in subcortical centers. But these muscle synergies have yet to be related to natural neurophysiological activity at particular levels of the neuraxis in either monkeys or humans. Further work will be needed to delineate the extent to which various types of synergies might be represented in different parts of the nervous system.
PM vs. M1.
Decoding of joint kinematics during reach-to-grasp movements using neurophysiological signals recorded from the PM recently has been found to be comparable to decoding using signals from M1 (Aggarwal et al. 2013; Bansal et al. 2011). The PM typically has been viewed, however, as having a higher order representation of body movement than the M1. Neurons in the ventral PM have been described as representing specific, iconic hand shapes, such as precision grip or power grasp (Rizzolatti et al. 1987, 1988). Power grasp in particular entails concurrent flexion of all five digits to close the hand around an object. We, therefore, considered the possibility that the kinematic synergy represented by PC1 might be represented more strongly in PM than in M1. We found no difference in decoding PC1 from PM vs. M1, however, using either spiking activity or LFPs, which are thought to represent population synaptic activity (Fromm and Bond 1964; Gray et al. 1989; Mitzdorf 1985). If anything, we found slightly better decoding of PC1 from M1 than from PM.
Native neural control vs. efficient brain-machine interfaces.
In summary, we found little evidence that the kinematic synergies identified by PCA, jPCA or isomap were represented more strongly in the motor cortex than the original joint angles from which these reduced dimensions were derived. We also found little evidence that more decodable information representing PCs or jPCs was present in M1 and/or PM than information representing the original joint DoFs. As in previous studies involving complex hand shapes, however, we too found that the first 7 PCs consistently captured ≥95% of the variance in the original 18 joint DoFs (Fig. 5). Whether neurophysiological signals in the motor cortex actually represent kinematic synergies or not, simultaneously decoding a relatively small number of reduced dimensions from the motor cortex might prove to be a computationally efficient means of controlling a much larger number of DoFs in a prosthetic hand.
GRANTS
This work was funded in part by National Institutes of Health R01s EB-010100 and NS-079664, the Natural Sciences and Engineering Research Council of Canada, the DARPA Revolutionizing Prosthetics program (prime contract N66001-06-C-8005), and REPAIR program (prime contract N66001-10-C-2009).
DISCLOSURES
No conflicts of interest, financial or otherwise, are declared by the author(s).
AUTHOR CONTRIBUTIONS
Author contributions: M.M., V.A., N.V.T., and M.H.S. conception and design of research; M.M. and M.H.S. performed experiments; M.M., V.A., and M.H.S. analyzed data; M.M. and M.H.S. interpreted results of experiments; M.M., V.A., and M.H.S. prepared figures; M.M. and M.H.S. drafted manuscript; M.M., V.A., N.V.T., and M.H.S. edited and revised manuscript; M.M. and M.H.S. approved final version of manuscript.
ACKNOWLEDGMENTS
The authors thank Adam Davidson for assistance in data acquisition and spike sorting, Jay Uppalapati and Andrea Moore for technical assistance, Marsha Hayles for editorial comments, and Gil Rivlis for helpful comments.
REFERENCES
- Aggarwal V, Mollazadeh M, Davidson AG, Schieber MH, Thakor NV. State-based decoding of hand and finger kinematics using neuronal ensemble and LFP activity during dexterous reach-to-grasp movements. J Neurophysiol 109: 3067–3081, 2013 [DOI] [PMC free article] [PubMed] [Google Scholar]
- Baker SN. The primate reticulospinal tract, hand function and functional recovery. J Physiol 589: 5603–5612, 2011 [DOI] [PMC free article] [PubMed] [Google Scholar]
- Bansal AK, Truccolo W, Vargas-Irwin CE, Donoghue JP. Decoding 3D reach and grasp from hybrid signals in motor and premotor cortices: spikes, multiunit activity, and local field potentials. J Neurophysiol 107: 1337–1355, 2012 [DOI] [PMC free article] [PubMed] [Google Scholar]
- Bansal AK, Vargas-Irwin CE, Truccolo W, Donoghue JP. Relationships among low-frequency local field potentials, spiking activity, and three-dimensional reach and grasp kinematics in primary motor and ventral premotor cortices. J Neurophysiol 105: 1603–1619, 2011 [DOI] [PMC free article] [PubMed] [Google Scholar]
- Brand PW, Hollister A. Clinical Mechanics of the Hand. St. Louis: Mosby Year Book, 1993 [Google Scholar]
- Buford JA, Davidson AG. Movement-related and preparatory activity in the reticulospinal system of the monkey. Exp Brain Res 159: 284–300, 2004 [DOI] [PubMed] [Google Scholar]
- Chestek CA, Cunningham JP, Gilja V, Nuyujukian P, Ryu SI, Shenoy KV. Neural prosthetic systems: current problems and future directions. Conf Proc IEEE Eng Med Biol Soc 2009: 3369–3375, 2009 [DOI] [PubMed] [Google Scholar]
- Cheung VC, Piron L, Agostini M, Silvoni S, Turolla A, Bizzi E. Stability of muscle synergies for voluntary actions after cortical stroke in humans. Proc Natl Acad Sci U S A 106: 19563–19568, 2009 [DOI] [PMC free article] [PubMed] [Google Scholar]
- Churchland MM, Cunningham JP, Kaufman MT, Foster JD, Nuyujukian P, Ryu SI, Shenoy KV. Neural population dynamics during reaching. Nature 487: 51–56, 2012 [DOI] [PMC free article] [PubMed] [Google Scholar]
- D'Avella A, Bizzi E. Shared and specific muscle synergies in natural motor behaviors. Proc Natl Acad Sci U S A 102: 3076–3081, 2005 [DOI] [PMC free article] [PubMed] [Google Scholar]
- D'Avella A, Fernandez L, Portone A, Lacquaniti F. Modulation of phasic and tonic muscle synergies with reaching direction and speed. J Neurophysiol 100: 1433–1454, 2008 [DOI] [PubMed] [Google Scholar]
- D'Avella A, Portone A, Fernandez L, Lacquaniti F. Control of fast-reaching movements by muscle synergy combinations. J Neurosci 26: 7791–7810, 2006 [DOI] [PMC free article] [PubMed] [Google Scholar]
- d'Avella A, Portone A, Lacquaniti F. Superposition and modulation of muscle synergies for reaching in response to a change in target location. J Neurophysiol 106: 2796–2812, 2011 [DOI] [PubMed] [Google Scholar]
- Davidson AG, Buford JA. Bilateral actions of the reticulospinal tract on arm and shoulder muscles in the monkey: stimulus triggered averaging. Exp Brain Res 173: 25–39, 2006 [DOI] [PubMed] [Google Scholar]
- Davidson AG, Buford JA. Motor outputs from the primate reticular formation to shoulder muscles as revealed by stimulus-triggered averaging. J Neurophysiol 92: 83–95, 2004 [DOI] [PMC free article] [PubMed] [Google Scholar]
- Davidson AG, Schieber MH, Buford JA. Bilateral spike-triggered average effects in arm and shoulder muscles from the monkey pontomedullary reticular formation. J Neurosci 27: 8053–8058, 2007 [DOI] [PMC free article] [PubMed] [Google Scholar]
- Davoodi R, Loeb GE. Real-time animation software for customized training to use motor prosthetic systems. IEEE Trans Neural Syst Rehabil Eng 20: 134–142, 2012 [DOI] [PubMed] [Google Scholar]
- Engel KC, Flanders M, Soechting JF. Anticipatory and sequential motor control in piano playing. Exp Brain Res 113: 189–199, 1997 [DOI] [PubMed] [Google Scholar]
- Fromm GH, Bond HW. Slow changes in the electrocorticogram and the activity of cortical neurons. Electroencephalogr Clin Neurophysiol 17: 520–523, 1964 [DOI] [PubMed] [Google Scholar]
- Giszter SF, Hart CB. Motor primitives and synergies in the spinal cord and after injury–the current state of play. Ann N Y Acad Sci 1279: 114–126, 2013 [DOI] [PMC free article] [PubMed] [Google Scholar]
- Gray CM, Konig P, Engel AK, Singer W. Oscillatory responses in cat visual cortex exhibit inter-columnar synchronization which reflects global stimulus properties. Nature 338: 334–337, 1989 [DOI] [PubMed] [Google Scholar]
- Hager-Ross CK, Schieber MH. Quantifying the independence of human finger movements: comparisons of digits, hands and movement frequencies. J Neurosci 20: 8542–8550, 2000 [DOI] [PMC free article] [PubMed] [Google Scholar]
- Hart CB, Giszter SF. A neural basis for motor primitives in the spinal cord. J Neurosci 30: 1322–1336, 2010 [DOI] [PMC free article] [PubMed] [Google Scholar]
- Hartman CG, Straus WL. The Anatomy of the Rhesus Monkey (Macaca mulatta). Baltimore, MD: Williams and Wilkins, 1933 [Google Scholar]
- Jarvis MR, Mitra PP. Sampling properties of the spectrum and coherency of sequences of action potentials. Neural Comput 13: 717–749, 2001 [DOI] [PubMed] [Google Scholar]
- Jerde TE, Soechting JF, Flanders M. Coarticulation in fluent fingerspelling. J Neurosci 23: 2383–2393, 2003 [DOI] [PMC free article] [PubMed] [Google Scholar]
- Mason CR, Gomez JE, Ebner TJ. Hand synergies during reach-to-grasp. J Neurophysiol 86: 2896–2910, 2001 [DOI] [PubMed] [Google Scholar]
- Mason CR, Theverapperuma LS, Hendrix CM, Ebner TJ. Monkey hand postural synergies during reach-to-grasp in the absence of vision of the hand and object. J Neurophysiol 91: 2826–2837, 2004 [DOI] [PubMed] [Google Scholar]
- Mitra PP, Pesaran B. Analysis of dynamic brain imaging data. Biophys J 76: 691–708, 1999 [DOI] [PMC free article] [PubMed] [Google Scholar]
- Mitzdorf U. Current source-density method and application in cat cerebral cortex: investigation of evoked potentials and EEG phenomena. Physiol Rev 65: 37–100, 1985 [DOI] [PubMed] [Google Scholar]
- Mollazadeh M, Aggarwal V, Davidson AG, Law AJ, Thakor NV, Schieber MH. Spatiotemporal variation of multiple neurophysiological signals in the primary motor cortex during dexterous reach-to-grasp movements. J Neurosci 31: 15531–15543, 2011 [DOI] [PMC free article] [PubMed] [Google Scholar]
- Overduin SA, d'Avella A, Carmena JM, Bizzi E. Microstimulation activates a handful of muscle synergies. Neuron 76: 1071–1077, 2012 [DOI] [PMC free article] [PubMed] [Google Scholar]
- Overduin SA, d'Avella A, Carmena JM, Bizzi E. Muscle synergies evoked by microstimulation are preferentially encoded during behavior. Front Comput Neurosci 8: 20, 2014 [DOI] [PMC free article] [PubMed] [Google Scholar]
- Overduin SA, d'Avella A, Roh J, Bizzi E. Modulation of muscle synergy recruitment in primate grasping. J Neurosci 28: 880–892, 2008 [DOI] [PMC free article] [PubMed] [Google Scholar]
- Percival DB, Walden AT. Spectral Analysis for Physical Applications–Multitaper and Conventional Univariate Techniques. Cambridge, MA: Cambridge University Press, 1993 [Google Scholar]
- Riddle CN, Edgley SA, Baker SN. Direct and indirect connections with upper limb motoneurons from the primate reticulospinal tract. J Neurosci 29: 4993–4999, 2009 [DOI] [PMC free article] [PubMed] [Google Scholar]
- Rizzolatti G, Camarda R, Fogassi L, Gentilucci M, Luppino G, Matelli M. Functional organization of inferior area 6 in the macaque monkey. II. Area F5 and the control of distal movements. Exp Brain Res 71: 491–507, 1988 [DOI] [PubMed] [Google Scholar]
- Rizzolatti G, Gentilucci M, Fogassi L, Luppino G, Matelli M, Ponzoni-Maggi S. Neurons related to goal-directed motor acts in inferior area 6 of the macaque monkey. Exp Brain Res 67: 220–224, 1987 [DOI] [PubMed] [Google Scholar]
- Roh J, Cheung VC, Bizzi E. Modules in the brain stem and spinal cord underlying motor behaviors. J Neurophysiol 106: 1363–1378, 2011 [DOI] [PMC free article] [PubMed] [Google Scholar]
- Saleh M, Takahashi K, Amit Y, Hatsopoulos NG. Encoding of coordinated grasp trajectories in primary motor cortex. J Neurosci 30: 17079–17090, 2010 [DOI] [PMC free article] [PubMed] [Google Scholar]
- Saleh M, Takahashi K, Hatsopoulos NG. Encoding of coordinated reach and grasp trajectories in primary motor cortex. J Neurosci 32: 1220–1232, 2012 [DOI] [PMC free article] [PubMed] [Google Scholar]
- Santello M, Flanders M, Soechting JF. Patterns of hand motion during grasping and the influence of sensory guidance. J Neurosci 22: 1426–1435, 2002 [DOI] [PMC free article] [PubMed] [Google Scholar]
- Santello M, Flanders M, Soechting JF. Postural hand synergies for tool use. J Neurosci 18: 10105–10115, 1998 [DOI] [PMC free article] [PubMed] [Google Scholar]
- Santello M, Soechting JF. Gradual molding of the hand to object contours. J Neurophysiol 79: 1307–1320, 1998 [DOI] [PubMed] [Google Scholar]
- Soechting JF, Flanders M. Flexibility and repeatability of finger movements during typing: analysis of multiple degrees of freedom. J Comput Neurosci 4: 29–46, 1997 [DOI] [PubMed] [Google Scholar]
- Stark E, Abeles M. Predicting movement from multiunit activity. J Neurosci 27: 8387–8394, 2007 [DOI] [PMC free article] [PubMed] [Google Scholar]
- Stuphorn V, Hoffmann KP, Miller LE. Correlation of primate superior colliculus and reticular formation discharge with proximal limb muscle activity. J Neurophysiol 81: 1978–1982, 1999 [DOI] [PubMed] [Google Scholar]
- Tenenbaum JB, de Silva V, Langford JC. A global geometric framework for nonlinear dimensionality reduction. Science 290: 2319–2323, 2000 [DOI] [PubMed] [Google Scholar]
- Thakur PH, Bastian AJ, Hsiao SS. Multidigit movement synergies of the human hand in an unconstrained haptic exploration task. J Neurosci 28: 1271–1281, 2008 [DOI] [PMC free article] [PubMed] [Google Scholar]
- Theverapperuma LS, Hendrix CM, Mason CR, Ebner TJ. Finger movements during reach-to-grasp in the monkey: amplitude scaling of a temporal synergy. Exp Brain Res 169: 433–448, 2006 [DOI] [PubMed] [Google Scholar]
- Todorov E, Ghahramani Z. Analysis of the synergies underlying complex hand manipulation. Conf Proc IEEE Eng Med Biol Soc 6: 4637–4640, 2004 [DOI] [PubMed] [Google Scholar]
- Tubiana R. (Editor). The Hand. Philadelphia, PA: Saunders, 1981 [Google Scholar]
- Vargas-Irwin CE, Shakhnarovich G, Yadollahpour P, Mislow JM, Black MJ, Donoghue JP. Decoding complete reach and grasp actions from local primary motor cortex populations. J Neurosci 30: 9659–9669, 2010 [DOI] [PMC free article] [PubMed] [Google Scholar]
- Wu W, Gao Y, Bienenstock E, Donoghue JP, Black MJ. Bayesian population decoding of motor cortical activity using a Kalman filter. Neural Comput 18: 80–118, 2006 [DOI] [PubMed] [Google Scholar]