

Abstract
Background
Data from observational studies suggest that body mass index (BMI) is causally related to esophageal adenocarcinoma (EAC) and its precursor, Barrett’s esophagus (BE). However, the relationships may be affected by bias and confounding.
Methods
We used data from the Barrett’s and Esophageal Adenocarcinoma Genetic Susceptibility Study: 999 patients with EAC, 2061 patients with BE, and 2169 population controls. We applied the two-stage control function instrumental variable method of the Mendelian randomization approach to estimate the unbiased, unconfounded effect of BMI on risk of EAC and BE. This was performed using a genetic risk score, derived from 29 genetic variants shown to be associated with BMI, as an instrument for lifetime BMI. A higher score indicates propensity to obesity. All tests were two-sided.
Results
The genetic risk score was not associated with potential confounders, including gastroesophageal reflux symptoms and smoking. In the instrumental variable analyses (IV), EAC risk increased by 16% (IV-odds ratio [OR] = 1.16, 95% confidence interval [CI] = 1.01 to 1.33) and BE risk increased by 12% (IV-OR = 1.12, 95% CI = 1.00 to 1.25) per 1kg/m2 increase in BMI. BMI was statistically significantly associated with EAC and BE in conventional epidemiologic analyses.
Conclusions
People with a high genetic propensity to obesity have higher risks of esophageal metaplasia and neoplasia than people with low genetic propensity. These analyses provide the strongest evidence to date that obesity is independently associated with BE and EAC, and is not due to confounding or bias inherent in conventional epidemiologic analyses.
Esophageal adenocarcinoma (EAC) incidence continues to rise in industrialized nations (1,2). Of the estimated 17460 people newly diagnosed with esophageal cancer in the US in 2012 (3), over 11000 were diagnosed with EAC (4), and the majority will not survive for more than one year (5).
Most EAC cases arise within Barrett’s esophagus (BE), a metaplastic transformation of the esophageal lining associated with gastroesophageal reflux (GER) (6), and both EAC and BE are substantially more common in white men (7,8). Extensive epidemiological research has shown that obesity increases the risk of EAC and BE (in particular, abdominal obesity) (9,10), such that trends of increasing prevalence of obesity may explain part of the continued rise in EAC incidence (11). If the associations were shown to be causal, then obesity would be a key target for primary prevention of EAC. However, given the many environmental, dietary and other risk factors associated with obesity, it is difficult to exclude other explanations for the associations observed in these studies, such as confounding by such factors or biased recall by study participants.
“Mendelian randomization” is one approach to exploring the possible causal nature of the observed associations between obesity and risk of EAC and BE (12). This approach uses instrumental variables (eg, genetic variants that proxy for directly measured environmental factors) to make causal inferences about the relationship between a risk factor and an outcome; results from this method are considered to be analogous to the outcomes of a randomized trial (12–14). For BMI and EAC, inheriting an allele associated with higher BMI (eg, each A allele of the fat mass and obesity-associated protein [FTO] rs1558902 polymorphism) (15) is akin to being randomly allocated a higher BMI (eg, 0.39kg/m2 higher for each additional risk allele in FTO) than individuals with other genotypes (eg, TT genotype of rs1558902). If obesity is causally related to EAC, then the variability in BMI that is because of genotype should confer differences in EAC risk directly attributable to obesity. Importantly, the instrumental variable approach overcomes issues of confounding and recall bias inherent in observational studies. First, since alleles are randomly allocated from parents to offspring at conception, the association between genotype and outcome is not confounded by environmental exposures (12,13,16). Second, genetic variants are measured reliably and are not affected by disease status (17). Further, as those with the risk allele have been essentially allocated randomly to higher levels of exposure across the lifecourse, genetic variation may more accurately reflect lifetime exposure compared with a single measurement (12,13,18).
Most phenotypes are due to the effects of multiple genes; however, the same principles apply. Using multiple genetic variants as instrumental variables can actually increase statistical power and improve the precision of causal estimates (19). Here, we report the findings of a Mendelian randomization study that used data and genetic material from the Barrett’s and Esophageal Adenocarcinoma Genetic Susceptibility Study (BEAGESS) and instrumental variable methods (13,16). We used multiple genetic variants that have been robustly associated with BMI in genome-wide association studies (GWAS) (15) as instrumental variables to reassess the observational estimates of the effect for obesity on EAC and BE.
Methods
The BEAGESS study included a subset of ethnically homogenous individuals of European ancestry from 14 epidemiological studies conducted in Western Europe, Australia, and North America by investigators in BEAGESS (Supplementary Table 1, available online). European ancestry was confirmed in GWAS samples using principal components analysis. The design of the BEAGESS study has been described in detail previously (20). The study was approved by the institutional review boards or research ethics committees of each participating institution.
We calculated BMI as weight divided by height squared (kg/m2). While the individual studies captured participants’ weight at various periods of life (9), for the current analysis we selected the weight from each study that most accurately reflected usual adult weight prior to any disease-related weight loss. Genotype information was available for 29 of the 32 genetic variants (using either the directly genotyped single nucleotide polymorphism [SNP] or “LD proxy” SNPs with r2 greater than 0.80 identified using HapMap) determined by the Genetic Investigation of Anthropometric Trials (GIANT) Consortium as being robustly associated with BMI in European populations (Table 1) (15). Genotyping of DNA from buffy coat or whole blood was performed using the Illumina HumanOmni1-Quad platform as previously described (20). Call rates were greater than or equal to 95%, and all SNPs were in Hardy-Weinberg equilibrium over controls given α = 0.0001.
Table 1.
Single nucleotide polymorphisms included in the genetic risk score for body mass index
| Chr | Nearest gene | SNP | Risk allele* | Other allele | Frequency of risk allele | Per allele change in BMI† |
|---|---|---|---|---|---|---|
| 1 | NEGR1 | rs2815752 | T | C | 0.62 | 0.13 |
| TNNI3K | rs1514175 | A | G | 0.43 | 0.07 | |
| PTBP2 | rs10489741 | T | C | 0.58 | 0.06 | |
| SEC16B | rs543874 | G | A | 0.20 | 0.22 | |
| 2 | TMEM18 | rs2867125 | C | T | 0.82 | 0.31 |
| ADCY3, RBJ | rs713587 | A | G | 0.49 | 0.14 | |
| FANCL | rs2192497 | G | A | 0.29 | 0.10 | |
| 3 | CADM2 | rs13078807 | C | T | 0.22 | 0.10 |
| 4 | GNPDA2 | rs10938397 | G | A | 0.43 | 0.18 |
| SLC39A8 | rs13107325 | A | G | 0.08 | 0.19 | |
| 5 | FLJ35779 | rs10057967 | A | G | 0.64 | 0.10 |
| ZNF608 | rs4836133 | A | G | 0.43 | 0.07 | |
| 6 | TFAP2B | rs987237 | C | T | 0.19 | 0.13 |
| NUDT3 | rs206936 | C | T | 0.19 | 0.06 | |
| 9 | LRRN6C | rs10968576 | G | A | 0.32 | 0.11 |
| 11 | STK33, RPL27A | rs11041994 | C | A | 0.52 | 0.06 |
| BDNF | rs7103411 | T | C | 0.77 | 0.19 | |
| CELF1, MTCH2 | rs7124681 | T | G | 0.41 | 0.06 | |
| 12 | BCDIN3D, FAIM2 | rs7138803 | A | G | 0.39 | 0.12 |
| 13 | MTIF3, GTF3A | rs9512699 | G | A | 0.20 | 0.09 |
| 14 | NRXN3 | rs17109256 | T | C | 0.22 | 0.13 |
| 15 | MAP2K5 | rs2241423 | C | T | 0.79 | 0.13 |
| 16 | GPRC5B, IQCK | rs12444979 | G | A | 0.86 | 0.17 |
| SH2B1 | rs7498665 | C | T | 0.40 | 0.15 | |
| FTO | rs9930506 | G | A | 0.42 | 0.39 | |
| 18 | MC4R | rs571312 | T | G | 0.23 | 0.23 |
| 19 | KCTD15 | rs29942 | G | A | 0.68 | 0.06 |
| QPCTL | rs2287019 | C | T | 0.80 | 0.15 | |
| ZC3H4, TMEM160 | rs3810291 | T | C | 0.66 | 0.09 |
* BMI-increasing risk allele. BMI = body mass index; SNP = single nucleotide polymorphism.
† The increase in kg/m2 per one additional BMI-increasing risk allele. From reference 15.
A total of 1516 EAC and 2416 BE case patients, and 2187 population controls had DNA available for genome-wide genotyping. Of these, 517 EAC, 355 BE, and 18 controls had missing data on weight and/or height and were excluded from this analysis. Of the 5229 participants with BMI data (999 EAC, 2061 BE, and 2169 controls), 5158 had complete genotype data on all 29 SNPs and 71 had genotype data on at least 27 SNPs (70 had missing data on one SNP, one had missing data on two SNPs); we imputed genotype data on those 71 participants with missing SNP data using mean replacement.
We created a genetic risk score (GRS) from the 29 SNPs to be an instrumental variable for BMI. The GIANT GWAS found no evidence of nonadditive effects among the 29 SNPs (15), thus we fit additive SNP effects. For each SNP, participants received a score of 0, 1, or 2 for carrying zero (wild-type homozygous), one (heterozygous) or two (homozygous for the risk allele) BMI-increasing risk alleles, respectively. Imputed SNPs had values that ranged from 0 to 2. The GRS was then calculated by summing across all SNPs (the GRS could theoretically range from 0 to 58). We also constructed a weighted GRS, where the BMI-increasing alleles for each SNP were weighted by the per allele change in BMI (the increase in kg/m2 per one additional risk allele) reported for the SNP or its LD proxy-SNP in the GIANT BMI GWAS (the weighted GRS could theoretically range from 0 to 7.98) (15).
Other covariates included in analyses were age (years, continuous), sex, education (less than high school, high school, or more), pack-years of smoking (never smoker, ≤15, 15.01–30, 30.01–50, and >50 pack-years derived from dividing the number of cigarettes smoked by 20 and multiplying by the total number of years smoked), regular alcohol consumption (yes/no), GER (never/ever), and use of nonsteroidal anti-inflammatory drugs (NSAIDs, never/ever), and acid suppressant medications (never/ever). We included participants with missing data for covariates in the analyses using an additional category for missing values.
Statistical Methods
Analyses were performed separately for EAC and BE. As the relationships between BMI and risks of EAC and BE are linear (9,10), we fit models with BMI as a continuous variable and computed odds ratios (OR) per 1kg/m2 increase in BMI. We examined the associations between potential confounders and case-control status using chi-square tests and Student t-tests. In control patients, the associations between potential confounders, the GRS, and BMI were assessed using linear regression, Student t-test, and analysis of variance.
For the instrumental variable analysis, we used the two-stage control function instrumental variable approach (21), with the GRS as an instrumental variable, and assumed an additive model. The first-stage linear regression analysis was restricted to control patients for the purpose of predicting BMI from the GRS. In the second stage, we fit a logistic model regressing case-control status on the predicted values of BMI from the first-stage, adjusted for the estimated residuals from the first stage to account for the uncertainty in the predicted values of BMI. The first- and second-stage models were also adjusted for age, as well as for the first four principal components that reflected the population structure to control for population stratification. The coefficient from the second-stage regression is the effect of the instrumental variable for BMI (ie, the GRS per 1kg/m2 increase in predicted BMI) on EAC/BE. We used the F-statistic from the first-stage regression to assess the strength of the instrument (F>10 indicates sufficient strength to ensure the validity of the instrumental variable method) (22). For comparison, we present the estimates for the BMI-EAC and BMI-BE associations derived from multivariable logistic regression (“conventional epidemiologic analyses”). We compared the effect estimate from the instrumental variable analysis with that from the conventional epidemiologic analysis using the Durbin form of the Durbin-Wu-Hausman statistic (23). Rejection of the null hypothesis (ie, risk estimates for BMI from both analyses are equal) indicates that the estimate from conventional epidemiologic analysis may be confounded or biased. Statistical significance was determined at P = .05, and all tests for statistical significance were two-sided. Analyses were performed using Stata 12.0 (StataCorp, College Station, TX).
Results
Compared with control patients, EAC case patients were older and more likely to be male, to have ever smoked, had GER symptoms, and used acid suppressant medications (Table 2). Similarly, BE case patients were more likely to have ever had GER symptoms and used acid suppressant medications than control patients.
Table 2.
Characteristics of the study population
| Characteristics | Population control patients n = 2169 | EAC n = 999 | Control patients vs EAC P * | BE n = 2061 | Control patients vs BE P * |
|---|---|---|---|---|---|
| Age, y, mean (SD) | 61.7 (11.1) | 63.9 (10.4) | <.001 | 61.0 (12.2) | .05 |
| Sex | <.001 | .01 | |||
| Male | 1705 (78.6) | 883 (88.4) | 1547 (75.1) | ||
| Female | 464 (21.4) | 116 (11.6) | 514 (24.9) | ||
| Highest level of education | <.001 | .01 | |||
| Less than high school | 469 (21.6) | 355 (35.5) | 338 (16.4) | ||
| High school or more | 1696 (78.2) | 633 (63.4) | 1522 (73.9) | ||
| Missing | 4 (0.2) | 11 (1.1) | 201 (9.7) | ||
| Body mass index, kg/m2 | <.001 | <.001 | |||
| <25 | 787 (36.3) | 246 (24.6) | 429 (20.8) | ||
| 25–29.99 | 944 (43.5) | 457 (45.8) | 881 (42.8) | ||
| ≥30 | 438 (20.2) | 296 (29.6) | 751 (36.4) | ||
| mean (SD) | 27.0 (4.7) | 28.3 (5.2) | 29.0 (5.2) | ||
| Cumulative smoking history, pack-years | <.001 | .18 | |||
| Never smoker | 883 (40.7) | 254 (25.4) | 690 (33.5) | ||
| ≤ 15 | 379 (17.5) | 153 (15.3) | 341 (16.6) | ||
| 15.01–30 | 319 (14.7) | 148 (14.8) | 236 (11.4) | ||
| 30.01–50 | 313 (14.4) | 200 (20.0) | 214 (10.4) | ||
| >50 | 245 (11.3) | 159 (15.9) | 192 (9.3) | ||
| Missing | 30 (1.4) | 85 (8.5) | 388 (18.8) | ||
| Frequency of heartburn/acid reflux | <.001 | <.001 | |||
| Never | 952 (43.9) | 302 (30.2) | 439 (21.3) | ||
| Ever | 1125 (51.9) | 687 (68.8) | 1430 (69.4) | ||
| Missing | 92 (4.2) | 10 (1.0) | 192 (9.3) | ||
| Frequency of use of aspirin or nonaspirin NSAIDs | .26 | .50 | |||
| Never | 808 (37.2) | 379 (37.9) | 497 (24.1) | ||
| Ever | 1027 (47.4) | 438 (43.8) | 665 (32.3) | ||
| Missing | 334 (15.4) | 182 (18.2) | 899 (43.6) | ||
| Ever use of acid suppressant medications | <.001 | <.001 | |||
| Never | 1345 (62.0) | 361 (36.1) | 372 (18.0) | ||
| Ever | 417 (19.2) | 319 (31.9) | 1500 (72.8) | ||
| Missing | 407 (18.8) | 319 (31.9) | 189 (9.2) |
* P value from chi-square tests for categorical variables and Student t tests for continuous variables. Missing categories were excluded from comparison tests. BE = Barrett’s esophagus; EAC = esophageal adenocarcinoma; NSAIDs = nonsteroidal anti-inflammatory drugs; SD = standard deviation.
Conventional Epidemiologic Analyses
On average, EAC (men, mean = 28.4, standard deviation [SD] = 5.1; women, mean = 27.7, SD = 5.9) and BE case patients (men, mean = 28.8, SD = 4.8; women, mean = 29.4, SD = 6.2) had statistically significantly higher BMI than control patients (men, mean = 27.0, SD = 4.4; women, mean = 27.0, SD = 5.6). Among control patients, the prevalence of obesity was 19% and 23% among men and women, respectively, compared with 30% of men and women with EAC, and 35% of men and 42% of women with BE. We found strong associations between age, GER, acid suppressant medications, and BMI among the control patients (Table 3), suggesting likely confounding with case-control status. On multivariable analysis (Table 4), EAC risk increased by 6% (95% CI = 1.05 to 1.08), and BE risk increased by 4% (95% CI = 1.03 to 1.06) for every 1kg/m2 increase in BMI.
Table 3.
Associations of potential confounders with body mass index and genetic risk score among population controls (= 2169)
| Variables | Body mass index | P * | Unweighted genetic risk score | Weighted genetic risk score | P * | |
|---|---|---|---|---|---|---|
| Mean (SD) | Mean (SD) | P * | Mean (SD) | |||
| Age, β on linear regression | -0.0279 (-0.046, -0.010) | .002 | 0.0032 (-0.010, 0.017) | .64 | 0.0008 (-0.001, 0.003) | .45 |
| Sex | .78 | .88 | .66 | |||
| Male | 27.02 (4.39) | 26.53 (3.46) | 3.73 (0.55) | |||
| Female | 26.95 (5.62) | 26.56 (3.73) | 3.72 (0.53) | |||
| Highest level of education | .48 | .04 | .02 | |||
| Less than high school | 27.14 (4.95) | 26.83 (3.45) | 3.77 (0.51) | |||
| High school or more | 26.97 (4.60) | 26.46 (3.54) | 3.71 (0.54) | |||
| Missing | 26.42 (4.24) | 25.25 (3.20) | 3.53 (0.49) | |||
| Cumulative smoking history, pack-years | .08 | .35 | .52 | |||
| Never smoker | 26.88 (4.51) | 26.37 (3.44) | 3.71 (0.53) | |||
| ≤15 | 26.62 (4.53) | 26.75 (3.40) | 3.76 (0.52) | |||
| 15.01–30 | 27.45 (4.59) | 26.65 (3.56) | 3.72 (0.53) | |||
| 30.01–50 | 27.03 (4.97) | 26.54 (3.72) | 3.74 (0.55) | |||
| >50 | 27.44 (5.12) | 26.74 (3.64) | 3.74 (0.58) | |||
| Missing | 27.07 (5.04) | 26.21 (3.81) | 3.67 (0.58) | |||
| Frequency of heartburn / acid reflux | <.001 | .28 | .79 | |||
| Never | 26.46 (4.30) | 26.63 (3.50) | 3.73 (0.53) | |||
| Ever | 27.32 (4.85) | 26.46 (3.57) | 3.72 (0.55) | |||
| Missing | 28.81 (5.45) | 26.67 (3.20) | 3.72 (0.49) | |||
| Frequency of use of aspirin or non-aspirin NSAIDs | .002 | .02 | .07 | |||
| Never | 26.53 (4.29) | 26.36 (3.45) | 3.70 (0.53) | |||
| Ever | 27.19 (4.69) | 26.73 (3.53) | 3.74 (0.53) | |||
| Missing | 27.58 (5.41) | 26.40 (3.65) | 3.74 (0.56) | |||
| Ever use of acid suppressant medications | <.001 | .94 | .71 | |||
| Never | 26.90 (4.63) | 26.54 (3.51) | 3.72 (0.54) | |||
| Ever | 28.40 (5.25) | 26.55 (3.56) | 3.73 (0.53) | |||
| Missing | 25.94 (3.80) | 26.52 (3.54) | 3.74 (0.52) |
* P value from Student t test or analysis of variance. Missing categories were excluded from comparison tests. NSAIDs = nonsteroidal anti-inflammatory drugs.
Table 4.
Comparison of conventional epidemiologic and instrumental variable associations between body mass index and risks of esophageal adenocarcinoma and Barrett’s esophagus
| Sample | Multivariable adjusted OR (95% CI)* | Unweighted genetic risk score: IV-adjusted OR (95% CI) | P † | Weighted genetic risk score: IV-adjusted OR (95% CI) | P † |
|---|---|---|---|---|---|
| EAC | |||||
| All | 1.06 (1.05 to 1.08) | 1.16 (1.01 to 1.33) | .21 | 1.23 (1.06 to 1.43) | .05 |
| Men | 1.07 (1.05 to 1.09) | 1.22 (1.02 to 1.46) | .15 | 1.31 (1.07 to 1.60) | .05 |
| Women | 1.04 (1.00 to 1.08) | 1.03 (0.80 to 1.33) | .96 | 1.13 (0.87 to 1.46) | .47 |
| BE | |||||
| All | 1.04 (1.03 to 1.06) | 1.12 (1.00 to 1.25) | .61 | 1.13 (1.01 to 1.28) | .47 |
| Men | 1.05 (1.03 to 1.08) | 1.11 (0.96 to 1.29) | .81 | 1.15 (0.96 to 1.36) | .58 |
| Women | 1.03 (1.00 to 1.06) | 1.11 (0.95 to 1.30) | .64 | 1.10 (0.95 to 1.28) | .72 |
* Adjusted for age (continuous), sex, education (less than high school, high school, or more), pack-years of smoking (never smoker, ≤15, 15.01–30, 30.01–50, >50 pack-years), gastroesophageal reflux symptoms (never, ever), acid suppressant medication use (never, ever), and NSAID use (never, ever). BE = Barrett’s esophagus; CI = confidence interval; EAC = esophageal adenocarcinoma; IV = instrumental variable. OR = odds ratio.
† P value from Durbin-Wu-Hausman test. All statistical tests were two-sided.
Instrumental Variable Analyses
Control patients carried 15 to 39 BMI-increasing risk alleles (mean = 26.5, SD = 3.5), compared with 16 to 36 BMI-increasing risk alleles (mean = 26.9, SD = 3.4) in EAC case patients and 17 to 38 BMI-increasing risk alleles (mean = 26.8, SD = 3.4) in BE case patients. The weighted GRS ranged from 1.66 to 5.50 (mean = 3.72, SD = 0.54) in control patients, 1.82 to 5.31 (mean = 3.79, SD = 0.53) in EAC cases and 2.20 to 5.36 (mean = 3.77, SD = 0.52) in BE case patients. In control patients and case patients, the GRS was normally distributed. Importantly, BMI increased with increasing numbers of risk alleles in case patients and control patients (Figure 1), such that persons with higher scores had higher average BMIs. The GRS-BMI association was homogeneous across studies (Supplementary Figure 1, available online). In contrast to that seen for BMI, we found no consistent evidence of associations between the GRS and the covariates in Table 3. Therefore, these same risk factors are unlikely to confound the instrumental variable analyses evaluating the BMI-EAC and BMI-BE associations.
Figure 1.
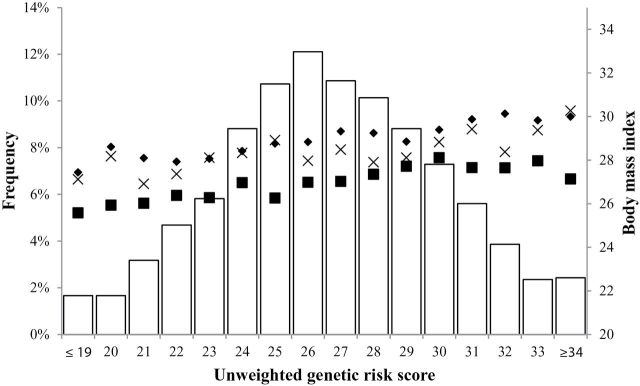
Distribution of the unweighted genetic risk score (left y-axis and histogram) and mean body mass index by genetic risk score and case-control status (right y-axis and marks). BE = Barrett’s esophagus; EAC = esophageal adenocarcinoma.
When we regressed BMI on the unweighted GRS among control patients, each additional BMI-increasing risk allele from the risk score was associated with a 0.16kg/m2 (95% CI = 0.11 to 0.22) increase in BMI. The GRS was a strong instrument for BMI (F-statistic = 31.4). In the instrumental variable (IV) analysis (Table 4), we found that a 1kg/m2 increase in BMI was associated with a 16% increase in risk of EAC (IV OR = 1.16, 95% CI = 1.01 to 1.33). There was no evidence that the effect estimate from the instrumental variable analysis differed from the effect estimate in the conventional epidemiologic analysis (P difference = .21). When we used the weighted GRS, the IV-OR estimate was moderately higher than the conventional epidemiologic analysis estimate (P difference = .05).
In the instrumental variable analysis of BE, there was a 12% increase in risk associated with a 1kg/m2 increase in BMI (IV-OR = 1.12, 95% CI = 1.00 to 1.25). We found a similar effect using the weighted GRS. The estimates from the instrumental variable analyses of BE did not differ from the conventional epidemiologic analysis estimate (unweighted, P difference = .61; weighted, P difference = .47).
The estimates were unchanged when we adjusted the instrumental variables models by potential confounders of the conventional epidemiologic analysis, or when we analyzed only those with complete genotype, BMI, and covariate data.
To determine whether the effect of BMI on EAC and BE was modified by sex, we conducted stratified analyses (Table 4). In instrumental variable analysis among men, we found a statistically significant association between BMI and EAC. The association was weaker and not statistically significant among women; however, the confidence intervals overlapped with those for men. The risk estimates for BE were similar for men and women. None of these sex-specific ORs was statistically significantly different from those from conventional epidemiologic analyses.
Discussion
Epidemiological studies have previously implicated obesity in the etiology of BE (10) and EAC (9), as well as breast, colorectal, pancreatic, kidney, and gallbladder cancers (24). Conversely, obesity is inversely related to lung cancer and esophageal squamous cell carcinoma (25). However, inferring causality between obesity and cancer from analysis of observational data presents substantial challenges. Mendelian randomization is one method used to strengthen causal inference but has been underutilized in cancer research to date. Using genetic variants as instrumental variables for BMI, we examined the BMI-EAC and BMI-BE associations without the limitations of confounding or bias that can affect self-reported estimates from observational studies. Since the genotype effect on BMI levels is inferred to represent lifetime BMI, the risk estimates reflect the effect of lifetime exposure to higher BMI. We found that elevated BMI was associated with increased risk of EAC and BE. The findings from the instrumental variable analysis confirm that obesity is independently associated with EAC and BE. Importantly, these findings also suggest that obesity may confer greater risk than previously reported (9,10).
The three fundamental relationships underlying the Mendelian randomization framework are: genotype–risk factor, risk factor–outcome, and genotype-outcome. Assuming that three key assumptions are satisfied, the outcomes from the instrumental variable analysis will be unconfounded, unbiased estimates for the effect of obesity on EAC and BE. We firstly assume that the genetic variants selected for analysis are associated with EAC and BE only through their association with BMI. Thus, we assume that they do not have a direct effect on EAC or BE. While it is unlikely that one or more pleiotropic SNPs in the GRS will reduce the causal implications of BMI calculated from the GRS, we are unable to directly test this assumption and it is thus possible that our IV estimates for the BMI associations are a combination of the BMI-outcome and the direct genotype-outcome effects. The second assumption is that the variants are associated with BMI. In particular, Mendelian randomization requires a strong instrument for analysis (13). We used the top-performing SNPs from an external study, which we also demonstrated were strongly associated with BMI in our large dataset. Given that the genetic risk score was a strong instrument for BMI in our study (F-statistic >>10), power and bias from weak instruments are unlikely to have seriously affected the results. We also satisfied the final assumption of the Mendelian randomization method, that the genetic risk scores are independent of potential confounders.
Case-control and cohort studies have reported statistically significant associations between BMI and risk of EAC and BE (9,10,26–33). The results of our conventional epidemiologic analyses differ somewhat from a prior analysis of BEACON BE studies (10). That analysis utilized a two-stage meta-analytic approach; however, as we needed to pool genetic data, the current study used a different design and a somewhat different study population. In these observational studies, the high correlation between BMI and multiple other environmental and lifestyle factors means that adequate control for all potential confounding may not have been possible. The inherent value of the Mendelian randomization approach is not in any greater specificity of exposure measurement, but that the exposure is assigned at conception, and therefore cannot be confounded by subsequent environmental exposures. The higher risk estimates found in our instrumental variable analyses indicate that the estimates obtained from multivariable regression methods may underestimate the true BMI effect, possibly because of confounding and/or misclassification and reporting errors, or overadjustment in the context of intermediate variables, which may bias the risk estimate towards the null (34). Misclassification of self-reported BMI may have biased our IV estimates away from the null. However, the bias is likely to be minimal, because measurement error has been shown to be small and inconsequential for rare, binary outcomes such as EAC and BE (35,36).
GER is the primary risk factor for EAC and BE, and people who are obese experience GER symptoms more frequently (37). While studies of EAC and BE have adjusted for GER symptoms in multivariable analysis of BMI, it is impossible to exclude residual confounding because symptom history is imperfectly correlated with the occurrence of GER, and reporting can be compromised by treatment history. Other issues for interpretation of conventional analyses arise. Firstly, GER may be an intermediary on the causal pathway between obesity and neoplasia, in which case adjusting for GER symptoms may actually bias the true risk estimate (34). Secondly, conventional analyses are based on the participant’s BMI at one time point and thus may be subject to misclassification and reporting errors (eg, tall men under-report height and short men over-report height, and women under-report weight) (38,39). Thirdly, early stages of cancer may result in weight loss, and so BMI values taken from within this latent period may introduce bias because of reverse causation. As the latent period for BMI is unknown, a measure that reflects typical lifetime BMI may limit such bias.
Our analyses using the Mendelian randomization approach do not suffer from any of these sources of error, and thus provide the strongest evidence to date that obesity is a risk factor for BE and EAC, which operates independently of other factors that also inflate risk. The mechanisms remain largely unknown. There is an emerging body of evidence that visceral (as opposed to subcutaneous) fat is particularly important for promoting esophageal neoplasia (40–42), with adipokines (such as leptin) or proinflammatory cytokines (such as insulin-like growth factors) proposed as possible mediators. However, as the 29 SNPs are associated with BMI and not waist-to-hip ratio, the observed associations reflect the effects of total adiposity on risks of BE and EAC, suggesting that there may be an alternative mechanism underlying these associations that does not relate to visceral adiposity. Unfortunately, we had too few participants with waist-to-hip ratio data (377 control patients, 746 BE case patients) to perform a Mendelian randomization study to detect the independent effects of central vs overall obesity. Exploring these possible pathways and other mechanisms is an area of ongoing inquiry.
Funding
This work was primarily funded by National Institutes of Health (R01CA136725). The funders of the study had no role in the design, analysis, or interpretation of the data, nor in writing or publication decisions related to this article.
APT is supported by Travel Fellowships from the European Association for Cancer Research and the University of Queensland and an Early Career Fellowship from the National Health and Medical Research Council of Australia. NJS is supported by a grant (P30 DK034987) from the National Institutes of Health. GL was supported by the Alan B. Brown Chair in Molecular Genomics and by the CCO Chair in Experimental Therapeutics and Population Studies. YR is supported by a grant from the National Institutes of Health (NIDDK 02956), the Robert Wood Johnson Foundation Harold Amos Medical Faculty Development Program, and the Fraternal Order of the Eagles. SM is supported by an Australian National Health and Medical Research Council Career Development Award and the Swedish Ministry of Higher Education. TLV is supported by National Institutes of Health Career Development Award K05CA124911. DCW is supported by a Future Fellowship (FT0990987) from the Australian Research Council.
Funding of Constituent Studies:
California Tobacco Related Research Program: 3RT-0122, 10RT-0251.
Swedish Cancer Society: 4559-B01-01XAA, 4758-B02-01XAB.
US National Institutes of Health: P01CA091955, R01CA072866, R01CA57947, R01CA59636, R01CA100264, P30CA016672, R01CA133996, P50CA093459, U01CA57949, U01CA57983, U01CA57923, and R01DK63616.
The Mayo Clinic Esophageal Adenocarcinoma and Barrett’s Esophagus (EABE) Registry Consortium is supported in part by the American Digestive Health Foundation “Endoscopic Research Award,” the American College of Gastroenterology “Junior Faculty Development Award,” the Glaxo Wellcome Inc. Institute for Digestive Health “Clinical Research Award,” and the Miles and Shirley Fiterman Center for Digestive Diseases at Mayo Clinic, Rochester, MN. The EABE Registry also has charitable gifts from five industry partners (Affymetrix, AstraZeneca, Santarus, Takeda and Wyeth). Members of the Mayo Clinic Esophageal Adenocarcinoma and Barrett’s Esophagus Registry Consortium (1Mayo Clinic Florida, 2Mayo Clinic Rochester, 3Mayo Clinic Arizona): Sami R.Achem, MD1, Yvonne Romero, MD2, David A. Ahlquist, MD2, Steven R. Alberts, MD2, Jeffrey A. Alexander, MD2, Mark S. Allen, MD2, Amindra S. Arora, MBBChir2, Jonathan B. Ashman, MD, PhD3, Pamela J. Atherton2, Lisa A. Boardman, MD2, Ernest P. Bouras, MD1, Vicki A. Bryhn2, Patrick A. Burch, MD2, George E. Burdick, MD2, Navtej S. Buttar, MD2, John K. Camoriano, MD3, John R. Cangemi, MD1, Stephen D. Cassivi, MD2, Frances K. Cayer1, Amy C. Clayton, MD2, Michael D. Crowell, MD, PhD3, Julie M. Cunningham, PhD2, Mariza de Andrade, PhD2, Piet de Groen, MD2, Giovani De Petris, MD3, Claude Deschamps, MD2, Kenneth R. DeVault, MD1, Robert B. Diasio, MD2, John K. DiBaise, MD3, Eric S. Edell, MD2, Sharon Elcombe2, Charles Erlichman, MD2, Douglas O. Faigel, MD3, Tom R. Fitch, MD3, David E. Fleischer, MD3, Jean C. Fox, MD2, Amy E. Foxx-Orenstein, DO2, Dawn Francis, MD2, Mary B. Fredericksen2, Evanthia Galanis, MD2, Debra M. Geno2, Axel Grothey, MD2, Michael G. Haddock, MD2, Kevin C. Halling, MD, PhD2, Denise M. Harnois, DO1, Tracy W. Hilton1, Timothy Hobday, MD2, Lesley A. Houghton, PhD1, Prasad A. Iyer, MD2, Dawn E. Jaroszewski, MD3, Aminah Jatoi, MD2, Robert B. Jenkins, MD, PhD2, Elizabeth A. Johnson, MD1, Rajni Katipamula, MD2, David A. Katzka, MD2, Sharon F. Kaufman2, Andrew P. Keaveny, MD1, Daniel A. Keller2, George P. Kim, MD1, Benjamin R. Kipp, PhD2, Dora M. Lam-Himlin, MD2, Stephen M. Lange, MD1, Louis Lanza, MD3, Shauna N. Legrand1, Paul J. Limburg, MD2, Wilma L. Lingle, PhD2, Wanguo Liu, PhD2, G. Richard Locke III, MD2, David S. Loeb, MD1, Lori S. Lutzke2, James A. Martenson Jr, MD2 Robert R. McWilliams, MD2, Robert C. Miller, MD2, Joseph A. Murray, MD2, Cuong C. Nguyen, MD3, Francis C. Nichols, III, MD2, John A. Odell, MD1, Rahul Pannala, MD3, Harshita R. Paripati, MD2, Alexander S. Parker, PhD1, Shabana F. Pasha, MD2, Bret T. Petersen, MD2, Gloria M. Petersen, PhD2, Michael F. Picco, MD1, Henry C. Pitot, MD2, J. Fernando Quevedo, MD2, Massimo Raimondo, MD1, Elizabeth Rajan, MD2, Francisco (Pancho) C. Ramirez, MD2, Renee M. Root2, Helen J. Ross, MD3, Joseph Rubin, MD2, Schuyler O. Sanderson, MD2, Daniel J. Sargent, PhD2, Daniel J. Schaid, PhD2, K. Robert Shen, MD2, Qian Shi, PhD2, Frank A. Sinicrope, MD2, Jeff A. Sloan, PhD2, Dan C. Smith, MD1, David I. Smith, PhD2, Thomas C. Smyrk, MD2, Mark E. Stark, MD1, Nicholas Talley, MD, PhD2, Stephen N. Thibodeau, PhD2, Michael D. Van Norstrand, MD, PhD2, Michael B. Wallace, MD1, Kenneth K. Wang, MD2, Richard M. Weinshilboum, MD2, Dennis Wigle, MD, PhD2, Herbert C. Wolfsen, MD1, Louis M. Wong Kee Song, MD2, Timothy A. Woodward, MD1, Tsung-The Wu, MD, PhD2, Harry H. Yoon, MD2, Alan R. Zinsmeister, PhD2.
We thank Georgia Green, Patricia Christopherson, Paul Hansen, Lorna Nolan, and Terri Watson for their efforts in project management and organization of biospecimens and data.
The authors declare that no competing interests exist.
References
- 1. Thrift AP, Whiteman DC. The incidence of esophageal adenocarcinoma continues to rise: analysis of period and birth cohort effects on recent trends. Ann Oncol. 2012;23(12):3155–3162 [DOI] [PubMed] [Google Scholar]
- 2. Edgren G, Adami HO, Weiderpass E, Nyren O. A global assessment of the oesophageal adenocarcinoma epidemic. Gut. 2013;62(10):1406–1414 [DOI] [PubMed] [Google Scholar]
- 3. American Cancer Society. Cancer Facts and Figures 2012. Atlanta: American Cancer Society; 2012 [Google Scholar]
- 4. Surveillance Epidemiology and End Results (SEER) Program. Surveillance, Epidemiology, and End Results (SEER) Program (www.seer.cancer.gov) SEER*Stat Database: Incidence - SEER 9 Regs Research Data, Nov 2011 Sub (1973–2010) <Katrina/Rita Population Adjustment> - Linked To County Attributes - Total U.S., 1969–2010 Counties, National Cancer Institute, DCCPS, Surveillance Research Program, Surveillance Systems Branch, released April 2013, based on the November 2012 submission. 2012.
- 5. Ferlay J, Shin HR, Bray F, Forman D, Mathers C, Parkin DM. Estimates of worldwide burden of cancer in 2008: GLOBOCAN 2008. Int J Cancer. 2010;127(12):2893–2917 [DOI] [PubMed] [Google Scholar]
- 6. Reid BJ, Li X, Galipeau PC, Vaughan TL. Barrett’s oesophagus and oesophageal adenocarcinoma: time for a new synthesis. Nat Rev Cancer. 2010;10(2):87–101 [DOI] [PMC free article] [PubMed] [Google Scholar]
- 7. Cook MB, Chow WH, Devesa SS. Oesophageal cancer incidence in the United States by race, sex, and histologic type, 1977–2005. Br J Cancer. 2009;101(5):855–859 [DOI] [PMC free article] [PubMed] [Google Scholar]
- 8. Cook MB, Wild CP, Forman D. A systematic review and meta-analysis of the sex ratio for Barrett’s esophagus, erosive reflux disease, and nonerosive reflux disease. Am J Epidemiol. 2005;162(11):1050–1061 [DOI] [PubMed] [Google Scholar]
- 9. Hoyo C, Cook MB, Kamangar F, et al. Body mass index in relation to oesophageal and oesophagogastric junction adenocarcinomas: a pooled analysis from the International BEACON Consortium. Int J Epidemiol. 2012;41(6):1706–1718 [DOI] [PMC free article] [PubMed] [Google Scholar]
- 10. Kubo A, Cook MB, Shaheen NJ, et al. Sex-specific associations between body mass index, waist circumference and the risk of Barrett’s oesophagus: a pooled analysis from the international BEACON consortium. Gut. 2013;62(12):1684–1691 [DOI] [PMC free article] [PubMed] [Google Scholar]
- 11. Lagergren J. Influence of obesity on the risk of esophageal disorders. Nat Rev Gastroenterol Hepatol. 2011;8(6):340–347 [DOI] [PubMed] [Google Scholar]
- 12. Davey Smith G, Ebrahim S. ‘Mendelian randomization’: can genetic epidemiology contribute to understanding environmental determinants of disease? Int J Epidemiol. 2003;32(1):1–22 [DOI] [PubMed] [Google Scholar]
- 13. Lawlor DA, Harbord RM, Sterne JA, Timpson N, Davey Smith G. Mendelian randomization: using genes as instruments for making causal inferences in epidemiology. Stat Med. 2008;27(8):1133–1163 [DOI] [PubMed] [Google Scholar]
- 14. Greenland S. An introduction to instrumental variables for epidemiologists. Int J Epidemiol. 2000;29(6):722–729 [DOI] [PubMed] [Google Scholar]
- 15. Speliotes EK, Willer CJ, Berndt SI, et al. Association analyses of 249,796 individuals reveal 18 new loci associated with body mass index. Nat Genet. 2010;42(11):937–948 [DOI] [PMC free article] [PubMed] [Google Scholar]
- 16. Davey Smith G, Lawlor DA, Harbord R, Timpson N, Day I, Ebrahim S. Clustered environments and randomized genes: a fundamental distinction between conventional and genetic epidemiology. PLoS Med. 2007;4(12):e352. [DOI] [PMC free article] [PubMed] [Google Scholar]
- 17. Davey Smith G, Ebrahim S. What can mendelian randomisation tell us about modifiable behavioural and environmental exposures? Br Med J. 2005;330(7499):1076–1079 [DOI] [PMC free article] [PubMed] [Google Scholar]
- 18. Ebrahim S, Davey Smith G. Mendelian randomization: can genetic epidemiology help redress the failures of observational epidemiology? Hum Genet. 2008;123(1):15–33 [DOI] [PubMed] [Google Scholar]
- 19. Palmer TM, Lawlor DA, Harbord RM, et al. Using multiple genetic variants as instrumental variables for modifiable risk factors. Stat Methods Med Res. 2012;21(3):223–242 [DOI] [PMC free article] [PubMed] [Google Scholar]
- 20. Levine D, Ek WE, Zhang R, et al. A genome-wide association study identifies new susceptibility loci for esophageal adenocarcinoma and Barrett’s esophagus. Nat Genet. 2013;45(12):1487–1493 [DOI] [PMC free article] [PubMed] [Google Scholar]
- 21. Palmer TM, Sterne JA, Harbord RM, et al. Instrumental variable estimation of causal risk ratios and causal odds ratios in Mendelian randomization analyses. Am J Epidemiol. 2011;173(12):1392–1403 [DOI] [PubMed] [Google Scholar]
- 22. Staiger D, Stock JH. Instrumental variables regression with weak instruments. Econometrica. 1997;65(3):557–586 [Google Scholar]
- 23. Baum CF, Schaffer ME, Stillman S. Instrumental variables and GMM: estimation and testing. Stata Journal. 2003;3:1–32 [Google Scholar]
- 24. World Cancer Research Fund/American Institute for Cancer Research. Food, Nutrition, Physical Activity, and the Prevention of Cancer: a Global Perspective. Washington, DC: 2007 [Google Scholar]
- 25. Renehan AG, Tyson M, Egger M, Heller RF, Zwahlen M. Body-mass index and incidence of cancer: a systematic review and meta-analysis of prospective observational studies. Lancet. 2008;371(9612):569–578 [DOI] [PubMed] [Google Scholar]
- 26. Kubo A, Corley DA. Body mass index and adenocarcinomas of the esophagus or gastric cardia: a systematic review and meta-analysis. Cancer Epidemiol Biomarkers Prev. 2006;15(5):872–878 [DOI] [PubMed] [Google Scholar]
- 27. Cook MB, Greenwood DC, Hardie LJ, Wild CP, Forman D. A systematic review and meta-analysis of the risk of increasing adiposity on Barrett’s esophagus. Am J Gastroenterol. 2008;103(2):292–300 [DOI] [PubMed] [Google Scholar]
- 28. Bollschweiler E, Wolfgarten E, Nowroth T, Rosendahl U, Monig SP, Holscher AH. Vitamin intake and risk of subtypes of esophageal cancer in Germany. J Cancer Res Clin Oncol. 2002;128(10):575–580 [DOI] [PubMed] [Google Scholar]
- 29. Chak A, Lee T, Kinnard MF, et al. Familial aggregation of Barrett’s oesophagus oesophageal adenocarcinoma, and oesophagogastric junctional adenocarcinoma in Caucasian adults. Gut. 2002;51(3):323–328 [DOI] [PMC free article] [PubMed] [Google Scholar]
- 30. Tretli S, Robsahm TE. Height, weight and cancer of the oesophagus and stomach: a follow-up study in Norway. Eur J Cancer Prev. 1999;8(2):115–122 [DOI] [PubMed] [Google Scholar]
- 31. Zhang ZF, Kurtz RC, Sun M, et al. Adenocarcinomas of the esophagus and gastric cardia: medical conditions, tobacco, alcohol, and socioeconomic factors. Cancer Epidemiol Biomarkers Prev. 1996;5(10):761–768 [PubMed] [Google Scholar]
- 32. Merry AH, Schouten LJ, Goldbohm RA, van den Brandt PA. Body mass index, height and risk of adenocarcinoma of the oesophagus and gastric cardia: a prospective cohort study. Gut. 2007;56(11):1503–1511 [DOI] [PMC free article] [PubMed] [Google Scholar]
- 33. MacInnis RJ, English DR, Hopper JL, Giles GG. Body size and composition and the risk of gastric and oesophageal adenocarcinoma. Int J Cancer. 2006;118(10):2628–2631 [DOI] [PubMed] [Google Scholar]
- 34. Schisterman EF, Cole SR, Platt RW. Overadjustment bias and unnecessary adjustment in epidemiologic studies. Epidemiology. 2009;20(4):488–495 [DOI] [PMC free article] [PubMed] [Google Scholar]
- 35. Palmer TM, Thompson JR, Tobin MD, Sheehan NA, Burton PR. Adjusting for bias and unmeasured confounding in Mendelian randomization studies with binary responses. Int J Epidemiol. 2008;37(5):1161–1168 [DOI] [PubMed] [Google Scholar]
- 36. Pierce BL, VanderWeele TJ. The effect of non-differential measurement error on bias, precision and power in Mendelian randomization studies. Int J Epidemiol. 2012;41(5):1383–1393 [DOI] [PubMed] [Google Scholar]
- 37. Hampel H, Abraham NS, El-Serag HB. Meta-analysis: obesity and the risk for gastroesophageal reflux disease and its complications. Ann Intern Med. 2005;143(3):199–211 [DOI] [PubMed] [Google Scholar]
- 38. Macgregor S, Cornes BK, Martin NG, Visscher PM. Bias, precision and heritability of self-reported and clinically measured height in Australian twins. Hum Genet. 2006;120(4):571–580 [DOI] [PubMed] [Google Scholar]
- 39. Connor Gorber S, Tremblay M, Moher D, Gorber B. A comparison of direct vs. self-report measures for assessing height, weight and body mass index: a systematic review. Obes Rev. 2007;8(4):307–326 [DOI] [PubMed] [Google Scholar]
- 40. Corley DA, Kubo A, Zhao W. Abdominal obesity and the risk of esophageal and gastric cardia carcinomas. Cancer Epidemiol Biomarkers Prev. 2008;17(2):352–358 [DOI] [PMC free article] [PubMed] [Google Scholar]
- 41. Vaughan TL, Davis S, Kristal A, Thomas DB. Obesity, alcohol, and tobacco as risk factors for cancers of the esophagus and gastric cardia: adenocarcinoma versus squamous cell carcinoma. Cancer Epidemiol Biomarkers Prev. 1995;4(2):85–92 [PubMed] [Google Scholar]
- 42. Kendall BJ, Macdonald GA, Hayward NK, Prins JB, O’Brien S, Whiteman DC. The risk of Barrett’s esophagus associated with abdominal obesity in males and females. Int J Cancer. 2013;132(9):2192–2199 [DOI] [PMC free article] [PubMed] [Google Scholar]