

Abstract
Human-induced pluripotent stem cell-derived cardiomyocytes (hiPSC-CMs) are being used as an in vitro model system in cardiac biology and in drug discovery (e.g., cardiotoxicity testing). Qualification of these cells for use in mechanistic investigations will require detailed evaluations of cardiomyocyte signaling pathways and cellular responses. ErbB signaling and the ligand neuregulin play critical roles in survival and functional integrity of cardiac myocytes. As such, we sought to characterize the expression and activity of the ErbB family of receptors. Antibody microarray analysis performed on cell lysates derived from maturing hiPSC-CMs detected expression of ∼570 signaling proteins. EGFR/ErbB1, HER2/ErbB2, and ErbB4, but not ErbB3 receptors, of the epidermal growth factor receptor family were confirmed by Western blot. Activation of ErbB signaling by neuregulin-1β (NRG, a natural ligand for ErbB4) and its modulation by trastuzumab (a monoclonal anti-ErbB2 antibody) and lapatinib (a small molecule ErbB2 tyrosine kinase inhibitor) were evaluated through assessing phosphorylation of AKT and Erk1/2, two major downstream kinases of ErbB signaling, using nanofluidic proteomic immunoassay. Downregulation of ErbB2 expression by siRNA silencing attenuated NRG-induced AKT and Erk1/2 phosphorylation. Activation of ErbB signaling with NRG, or inhibition with trastuzumab, alleviated or aggravated doxorubicin-induced cardiomyocyte damage, respectively, as assessed by a real-time cellular impedance analysis and ATP measurement. Collectively, these results support the expanded use of hiPSC-CMs to examine mechanisms of cardiotoxicity and support the value of using these cells in early assessments of cardiotoxicity or efficacy.
Keywords: human-induced pluripotent stem cell-derived cardiomyocytes (hiPSC-CMs), protein expression, ErbB signaling, nanofluidic proteomic immunoassay (NIA), real-time impedance-based cell assay (RTCA) cardio system
There continues to be an urgent need to develop more appropriate, relevant, and predictive tools and assays to inform a better understanding of the mechanistic basis of cardiotoxicity. Targeted therapeutics may be associated with general cytotoxicity or mechanisms of toxicity related to “on-target” effects particularly when cardiomyocyte viability is dependent upon the targeted pathway for cell viability or survival (Force and Kolaja, 2011). In vitro cell systems employed to interrogate mechanisms of toxicity are suitable for generating experimental evidence supporting mechanistic hypotheses when the system has been adequately characterized. Little is known about the functionality of cell signaling pathways in human-induced pluripotent stem cell-derived cardiomyocytes (hiPSC-CMs) cultures. We evaluated hiPSC-CMs (Takahashi and Yamanaka, 2006; Yu et al., 2007) for use in mechanistic investigations of cardiac toxicity involving the ErbB signaling pathway. We show that maturing hiPSC-CMs express several cell signaling proteins that may play roles in mediating cardiac toxicities associated with anti-cancer agents. We examined the activation states of key receptor and cell signaling proteins and specifically measured the effect of neuregulin/ErbB signaling on doxorubicin-induced cardiotoxicity. Our data support the use of hiPSC-CMs to explore cardiac cell signaling pathways and the role of the ErbB2 pathway in mediating mechanisms of cardiac toxicity for new uncharacterized early drug candidates.
MATERIALS AND METHODS
Chemicals
Doxorubicin-HCl (purchased from Enzo Life Sciences Farmingdale, NY) and lapatinib [provided by the Developmental Therapeutics Program, National Cancer Institute (Bethesda, MD)] were dissolved in dimethyl sulfoxide (DMSO) before diluted in media for cell treatments. Trastuzumab was purchased from Genentech, Inc. (South San Francisco, CA) and solubilized in Maintenance Medium (Cellular Dynamics International (CDI), Madison, WI). Recombinant human neuregulin-1β (NRG1-β1/HRG1-β1 EGF domain) was purchased from R&D Systems (Minneapolis, MN) and dissolved in PBS containing 0.1% bovine serum albumin at 100-μg/ml stock concentration and diluted in Maintenance Media for cell treatments.
Cell culture
Cryopreserved human iPSC-derived cardiomyocytes (iCell Cardiomyocytes, CDI) were thawed, plated, and maintained per manufacturer's instructions (http://www.cellulardynamics.com/products/lit/CDI_iCellCMUsersGuide121106.pdf). Cells were thawed and plated in iCell Cardiomyocytes Plating Medium (CDI) in 0.1% gelatin-coated 6-, 12-, 24-, or 96-well plates. Plating Medium was replaced by Maintenance Medium (CDI) after 48 h post-plating, and medium change was performed every 2 or 3 days. Cells were cultured at 37°C and 5% CO2.
Light and fluorescence microscopy and image analysis
Cells were plated on 96-well plates at 5 or 10 k/well. On Day 2 and Day 14, cells were imaged under bright light and a 30-s video was taken from the center field of each well using Nikon ECLIPSE Ti microscope/Nikon DS-Ri1 digital camera system (Nikon Instruments Inc., Melville, NY) for manually assessing contraction (beating). After imaging, the cells were fixed in 3% paraformaldehyde for 10 min, permeabilized and blocked with 0.1% Triton-X 100 in PBS, Odyssey Blocking Buffer (LI-COR Biosciences, Lincoln, NE), and incubated with anti-cardiac troponin I (1:100; Abcam, Cambridge, MA) and anti-myomesin (clone B4) (1:50; University of Iowa Developmental Studies Hybridoma Bank, Iowa City, IA) for 2 h at room temperature. Subsequently the cells were incubated with appropriate secondary antibodies conjugated with fluorescence-dyes (1:1000 Life Technologies, Grand Island, NY) for 1 hr at room temperature. The nuclei were stained with Hoechst (2 μg/ml, Life Technologies) for 15 min. The stained cells were imaged in three different channels and analyzed using IN Cell Analyzer 2000 software (Multi-Target Analysis module) (GE Healthcare Bio-Sciences, Pittsburgh, PA) to segment cells based on staining pattern. The blue 4',6-diamidino-2-phenylindole (DAPI) channel was used to detect nuclei, the red (Cy3) channel detected cTnI, and the green fluorescein isothiocyanate (FITC) channel detected myomesin.
Electron microscopy and image analysis
Cells were plated on 6-well plates and fixed on Day 2 or Day 14 in 2% glutaraldehyde, 0.1-M cacodylate buffer, pH 7.4 for 1 h at room temperature and then stored at 4°C until transmission electron microscopy was performed. The cells were post fixed in 1% osmium tetroxide in the same buffer for 1 h and en bloc stained with 0.5% uranyl acetate in 0.1-M acetate buffer, pH 4.2. The cells were then dehydrated in graded ethanol solutions (35%, 50%, 70%, 95%, 100%) and infiltrated overnight in epoxy resin (Poly/Bed 812, Polysciences, Warrington, PA). After adding fresh pure resin, the cell plates were cured for 72 h in 55°C. After removing the polystyrene plates, suitable areas for thin sectioning were selected, cut out with a jewelry saw, and glued onto empty resin stubs. Approximately 70-nm thin sections were cut on an ultramicrotome (Leica EM UC6, Leica Microsystems, Buffalo Grove, IL) and mounted on naked copper grids. The thin sections were double stained (uranyl acetate and lead citrate), examined in a Hitachi H-7650 transmission electron microscope (Hitachi High Technologies America, Gaithersburg, MD), and images were taken using an AMT CCD camera (Advanced Microscopy Techniques, Woburn, MA). The area of mitochondria and sarcomeres were segmented and quantified using Definiens Developer XD 64 software, version 2.0.4. (Definiens Inc., Carlsbad, CA) (see Supplementary fig. 1 for illustration).
Kinex antibody microarray protein profiling
Protein profiling services were conducted by Kinexus (Vancouver, BC, Canada) using the Kinex antibody microarray that consists of 517 pan-specific antibodies and 337 phospho-site-specific antibodies. The cell lysis buffer supplied by Kinexus consisted of 20-mM 4-morpholinepropanesulfonic acid, 2-mM ethylene glycol tetraacetic acid, 5-mM ethylenediaminetetraacetic acid (EDTA), 30-mM sodium fluoride, 60-mM β-glycerophosphate, pH 7.2, 20-mM sodium pyrophosphate, 1-mM sodium orthovanadate, and 1% Triton X-100 supplemented with protease inhibitors and dithiothreitol. Frozen samples were shipped overnight on dry ice to Kinexus for analysis. In brief, 50 μg of lysate protein collected from Day 14 hiPSC-CM cultures was covalently labeled with a proprietary fluorescent dye. Free dye molecules were removed at the completion of labeling reactions by gel filtration. After blocking non-specific binding sites on the Kinex microarray, an incubation chamber was mounted onto the microarray to permit loading of the two samples side by side on the same chip and prevent mixing of the samples. Following sample incubation, unbound proteins were washed away. Each array produced a pair of 16-bit images, which were captured with a Perkin-Elmer ScanArray Reader laser array scanner (Waltham, MA). Signal quantification was performed with ImaGene 8.0 from BioDiscovery (El Segundo, CA) with predetermined settings for spot segmentation and background correction. The globally normalized signal intensity was used to assess the expression level of targeted proteins.
Western blot analysis
HiPSC-CMs were washed with ice cold PBS before being lysed directly in plates using RIPA buffer (0.5-M Tris-HCl, pH 7.4, 1.5-M NaCl, 2.5% deoxycholic acid, 10% NP-40, 10-mM EDTA; Millipore, Billerica, MA, USA) supplemented with 0.5% sodium dodecyl sulfate (Sigma) and phosphatase and protease inhibitor cocktails (Sigma and Thermo Scientific Pierce, Rockford, IL, respectively), followed by brief sonication. Protein concentration was quantified using the bicinchoninic acid (BCA) protein assay kit (Thermo Scientific Pierce).
For detection of signaling proteins, AKT and Erk1/2 in the activation experiments, lysate was loaded onto a 10% Tris-HCl Ready Gel, 10 well, 50 μl/well (Bio-Rad, Hercules, CA) at 10 μg of protein/well. For characterizing receptor protein expression levels, lysate was loaded onto a 4–15% Ready Gel Tris-HCl (1 large well for cell lysate and 1 smaller well for molecular weight markers; Bio-Rad) at 400 μg of protein in 450 μl. Protein was transferred to membrane and membranes were probed for protein detection. All membranes were incubated with primary antibodies overnight at 4°C and secondary antibody incubation for 1 h at room temperature. Membranes were imaged using the Odyssey Infrared Imaging System (LI-COR). Relative intensities of the protein bands were quantified using the Image Studio 2 software program (LI-COR). The signal intensities of each sample were normalized to glyceraldehyde-3-phosphate dehydrogenase (GAPDH).
The primary antibodies used for all Western blots were ErbB1/EGFR (Cell Signaling at 1:250), ErbB2/HER2 (Cell Signaling at 1:500), 3 ErbB3/HER3 (Cell Signaling and Abcam at 1:100 to 1:1000), phospho-ErbB3(Y1328) (Kinexus at 1:500), ErbB4/HER4 (Cell Signaling at 1:500), AKT1/2/3 pan (Cell Signaling at 1:500), phospho-AKT(Ser473) (Cell Signaling at 1:250), p44/42 MAPK (Erk1/2) (Cell Signaling at 1:500), phospho-p44/42 MAPK (Erk1/2)(Thr202/Tyr204) (Cell Signaling at 1:250), and GAPDH (Cell Signaling at 1:1000–2000). Secondary antibodies used were IRDye 680LT goat anti-rabbit (LI-COR) at 1:20,000 and IRDye 800CW goat anti-rabbit (LI-COR) at 1:10,000.
Nanofluidic proteomic immunoassay
HiPSC-CMs were cultured for 12–14 days before treatment. The cells were washed with ice cold PBS before being lysed directly in plates using M-PER Mammalian Protein Extraction Reagent (Thermo Scientific Pierce) supplemented with phosphatase and protease inhibitors (Sigma and Thermo Scientific Pierce). Lysate from duplicate wells was pooled then briefly sonicated and centrifuged at 15,000 × g for 15 min at 4°C. The clarified lysate was then aliquoted into smaller volumes and stored at −80°C. The hiPSC-CMs lysates were run in triplicate on the NanoPro1000 instrument (ProteinSimple, Santa Clara, CA) at 0.05 or 0.1-mg/ml final concentration in the capillary along with Premix G2, Pharmalyte pH 5–8 separation gradient and pI standard ladder 3 from ProteinSimple. The proteins were separated by their isoelectric point at 21,000 μW for 40 min and immobilized to the capillary wall for 105 s. The 0.1-mg/ml concentrated proteins were then probed for either AKT1/2/3 (Santa Cruz Technology, Santa Clara, CA), AKT1 (Millipore), AKT2 (Cell Signaling), or phospho-AKT (Ser473) (Cell Signaling) all at 1:50 dilution and incubated for 240 min for phospho-AKT and 120 min for AKT1/2/3, AKT1, and AKT2 antibodies. The 0.05-mg/ml concentrated proteins were probed with either pan Erk1/2 (ProteinSimple) or phospho-Erk1/2 (Thr202/Tyr204) (Cell Signaling) at 1:50 dilution and incubated for 120 min each. Next, the proteins were probed with anti-rabbit biotinylated secondary antibody (ProteinSimple) at 1:100 dilution and incubated for 60 min, followed by probing with Streptavidin-HRP conjugate (ProteinSimple) at 1:100 dilution and incubated for 10 min. Proteins were detected by chemiluminescence at 240 and 480 s. Quantification of AKT and Erk protein peaks was determined by Compass (Version 2.3.7) analysis software (ProteinSimple).
siRNA transfection
HiPSC-CMs were plated on 6-well plates, cultured for at least 14 days, and transfected with 100-nM ON-TARGETplus SMARTpool human ErbB2 siRNAs or Non-targeting pool control siRNAs (Thermo-Fisher Scientific/Dharmacon, Pittsburgh, PA) using Lipofectamine RNAiMAX/Opti-MEM (Life Technologies) for up to 144 h. Cells were then treated with or without NRG (100 ng/ml) for 30 min and lysed in radio immunoprecipitation assay (RIPA) buffer. Downregulation of ErbB2 expression and NRG-induced AKT or Erk1/2 phosphorylation was determined by Western analysis with 30- and 10-μg protein loading in each lane, respectively.
Real-time cellular analyzer cardiomyocyte monitoring
HiPCS-CMs were seeded in 0.1% gelatin-coated 96-well E-plates (Roche Applied Sciences, Mannheim, Germany and ACEA Biosciences, San Diego, CA) at 18 × 103 cells/well and cultured at 37°C, 5% CO2 for 10–14 days before drug treatment. The medium change was performed every 2–3 days. Spontaneous cardiomyocyte contraction and cell health were monitored in real-time by impedance, reported as cellular impedance index, using xCELLigence real-time cellular analyzer (RTCA) Cardio system (Roche Applied Sciences/ACEA Biosciences) as previously described (Guo et al., 2011). The impedance signal was sampled at 77 Hz and recorded at selected time points for 30 s per sweep. For drug treatment, trastuzumab and recombinant human neuregulin-1 were diluted in the maintenance medium at 2x target concentration, and doxorubicin at 10x target concentration. Drug dilutions were equilibrated in 37°C, 5% CO2 incubator for 30 min before being applied to E-plates. Cells in selected wells were pre-treated with 1-μM trastuzumab or 100-ng/ml NRG for 24 h before exposure to doxorubicin at various concentrations between 0.1 and 1 μM for 40 h. For data analysis, cellular impedance index, beat rate, and amplitude were measured off-line using RTCA Cardio software 1.0 (Roche Applied Sciences/ACEA Biosciences) and normalized for each well to the baseline (pre-dose) values measured prior to doxorubicin treatment.
ATP measurements
Upon the completion of impedance recording, the intracellular ATP of cardiomyocytes in each E-plate was quantified using CellTiter-Glo Luminescent kit (Promega, Madison, WI). The assay was conducted according to the manufacture's recommendation. The luminescence intensity was measured using an Infinite M1000 plate reader (Tecan, Grodig, Austria).
Statistical analysis
Data presented represent the mean ± standard error of the mean (SEM) of at least three independent cell culture experiments. Student's t-test for two-group comparisons was used to assess the statistical significance, and the value of p < 0.05 was considered significant. Statistical analysis was conducted with Microsoft Excel 2010.
RESULTS
HiPSC-CMs Exhibit a Functional Cardiomyocyte Phenotype in Culture
In short-term cultures, hiPSC-CMs underwent a progressive transition toward a more functional cardiac myocyte phenotype. The number of cells with visible twitching or beating increased from ∼40% on Day 2 to more than 95% on Day 14; this was accompanied with a 51% increase in cell size or a 38% increase in the ratio of cell/nuclear area as determined by light/fluorescence microscopic measurement of the troponin I (cTnI) stain (Fig. 1). The contractility of cardiomyocytes, determined by the beating amplitude of impedance measurements, increased by 8-fold, and was consistent with a 29% increase in myomesin expression as measured by the staining signal intensity (Fig. 2). Myomesin is a core component of functional sarcomere structure of striated muscles, including cardiomyocytes (Agarkova and Perriard, 2005).
FIG. 1.
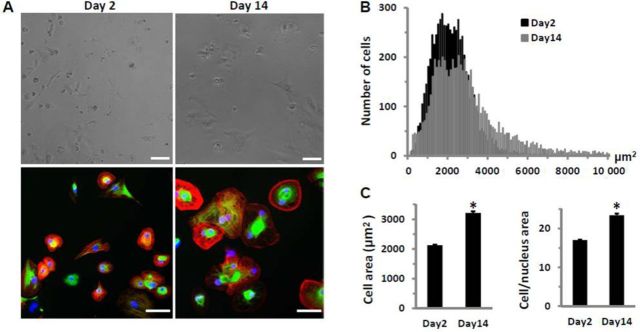
HiPSC-CMs in culture for 2 or 14 days after plating. (A) Microscopic images before fixation (top) and after, stained (bottom) for cTnI (red), myomesin (green), and nuclei (blue), demonstrate hypertrophic growth of hiPSC-CMs in culture. Bar represents 60μM. (B) Frequency distribution of cell surface area based on cTnI-stained cells (n > 6000 cells each from Day 2 and Day 14 cultures) shows an increased cell population with larger cell size in Day 14 cultures. (C) Comparison of cell surface area and the ratio of cell/nuclear area of cTnI-stained cells from Day 2 or Day 14 cultures. Each bar represents the mean ± SE of 20 wells. *p < 0.05 versus Day 2.
FIG. 2.
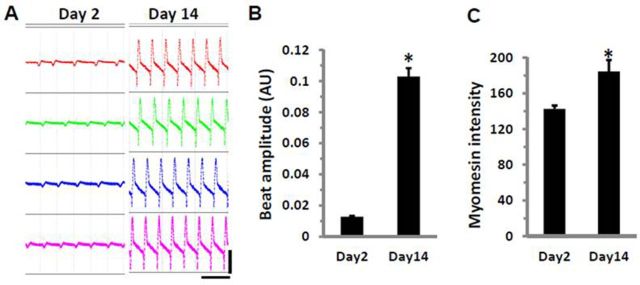
Enhancement of contractile properties in cultured hiPSC-CMs. (A) Screenshots of spontaneous beating cells taken from the same four wells on Day 2 and Day 14. Horizontal scale bar represents 3 s; vertical scale bar represents 0.06 arbitrary units (AU). (B) Comparison of beat amplitude and (C) myomesin staining intensity in cells from Day 2 or Day 14 cultures. Each bar represents the mean ± SE of 32 (B) or 20 (C) wells. *p < 0.05 versus Day 2.
The beat rate was 36 ± 1.2 at Day 2 and 35 ± 0.3 at Day 14 (mean ± SE, n = 32, p = 0.29). Although the overall beat rate did not show statistical significance, cells at Day 14 exhibited much less well-to-well variation than those at Day 2. The calculated coefficient of variation for beat rate measured at Day 2 was 18% and 5% at Day 14, representing a range of beat rate variation between 24 and 53 beats/min at Day 2, and between 32 and 39 at Day 14, respectively.
Differences in ultrastructural features of hiPSC-CMs between Day 2 and Day 14 cultures were also noted from transmission electron microscopic images. As shown in Figures 3A–C, cells on Day 2 in culture contained few well-developed sarcomeres, but rich disorganized myofilaments. Cells on Day 14 displayed an increased population of organized myofilaments with well-defined sarcomeres. Sarcomeres and mitochondria were quantified by calculating the fraction of sarcomeres or mitochondria area over the total cell area (Supplementary fig. 1). Sarcomeres were significantly increased in Day 14 cultures (Fig. 3D). However, mitochondria were present in similar abundance in both Day 2 and Day 14 post-plating cultures (Fig. 3D).
FIG. 3.

Transmission electron microscopy (TEM) images of hiPSC-CMs demonstrate maturation to a more functional cardiac myocyte phenotype. (A) Low magnification (×1000) TEM images illustrate the presence of abundant mitochondria in hiPSC-CMs cultured for 2 or 14 days; well-defined sarcomeres are sparse in Day 2 cell cultures. (B) High magnification (×5000) TEM images show the disorganized myofilaments, the lack of Z-like dense structures and aligned sarcomeres in Day 2 hi-PSC-CMs, whereas the well-developed sarcomeres are frequently observed in Day 14 hi-PSC-CMs. (C) Underconstruction and well-established sarcomeres of hiPSC-CMs in Day 2 and Day 14 cultures, respectively. H: H-zone; M: mitochondria; MF: myofilaments; N: nucleus; S: sarcomeres; Z: Z-bands. (D) The area of mitochondria and sarcomeres relative to the total cell area was quantified using Definiens analysis software in low magnification (×1000) images randomly taken from Day 2 or Day 14 cultures of hiPSC-CMs. Bar graph depicts equal amounts of mitochondria in both Day 2 and Day 14 cultures, but significantly greater sarcomeres in Day 14 cultures. p < 0.05 versus Day 2; each data point represents mean ± SEM of 20 images per time point.
Expression Profile for Select Signaling Proteins From hiPSC-CMs
We examined baseline expression of several cell signaling proteins using a high-content microarray that employs a panel of 854 pan- and phospho-site-specific antibodies targeting 190 protein kinases, 35 protein phosphatases, 26 stress-response proteins, 20 transcription factors, and 100 other proteins involved in regulation of cell metabolism, cell cycle progression and proliferation, and survival or programmed cell death. Detailed information for antibodies used and signal intensity measured for each antibody is provided in Supplementary table 1. About 90% of proteins probed (565 proteins) exhibited a signal above the low detection limit of 100 of the globally normalized signal intensity. Among protein kinases with detectable signal intensity, 50 are selected (Fig. 4) to represent key protein kinases involved in the growth-activated or stress-activated signaling pathways in human heart, which include several receptor kinases such as ErbB/HER, GPCR, insulin receptor, IGF1R, PDGFR, and their downstream mediators or effectors including PKAs, PKBs (AKT1/2/3/), PKCs, Erk1/2, JAKs, JNKs, and p38-MAPKs. ErbB3 receptor protein was not performed; however, a phospho-site-specific (Y1328) ErbB3 antibody showed a signal. A total of 30 protein phosphatases were detected. KAP (cyclin-dependent kinase-associated phosphatase), PP2A-B(B56) (protein-serine phosphatase 2A–B regulatory subunit - B56 alpha isoform), PAC1 (dual specificity MAP kinase protein phosphatase), Cdc25C (cell division cycle 25C phosphatase), and PTEN (phosphatidylinositol-3,4,5-trisphosphate 3-phosphatase and protein phosphatase and tensin homolog deleted on chromosome 10) were the top 5 based on highest signal intensity. Five of six small GTPase signaling proteins probed displayed a detectable signal, which are Cdc42 (Cell division control protein 42 homolog), Rac1 (Ras-related C3 botulinum toxin substrate 1) pan- and S71, ROKb/ROCK1 (RhoA protein-serine kinase beta), and ROKa/ROCK2 (RhoA protein-serine kinase alpha).
FIG. 4.

List of 50 selected protein kinases involved in the growth factor-activated or stress-activated pathways. Each data point represents the mean signal intensity in Day 14 hiPSC-CM cell lysates from three independent experiments using microarray protein analysis as described in the Materials and Methods section.
HiPSC-CMs Express ErbB Receptors
Because ErbB signaling is critical to normal cardiac function, we measured expression of four epidermal growth factor receptor family (EGFR) members: EGFR/ErbB1, ErbB2, ErbB3, and ErbB4. HiPSC-CMs expressed ErbB1, ErbB2, and ErbB4 receptors as determined by Western blot analysis (Fig. 5A). Protein expression levels of ErbB4 receptor were approximately double that measured for ErbB2 receptor, which was approximately double the expression of ErbB1 receptor (Fig. 5B). ErbB3 receptor protein expression, as determined by Western blot analysis, was not detected in the same hiPSC-CM lysates using three different antibodies targeting different residues of the ErbB3 receptor protein or the phospho-site-specific (Y1328) ErbB3 antibody used in the microarray. The quality of all three pan ErbB3 antibodies was confirmed by their detection of both the recombinant ErbB3 protein and ErbB3 protein in H441 cell lysates (data not shown). These findings were not surprising and may suggest that ErbB signaling is well developed in these hiPSC-CMs because ErbB3 receptor plays a role in cardiomyogenesis during heart development, but is not detectable in adult ventricular cardiomyocytes (De Keulenaer et al., 2010, Zhao et al., 1998).
FIG. 5.

Expression of ErbB1, ErbB2, and ErbB4 receptors in hiPSC-CMs. Four-hundred microgram of total protein in 450 μl was loaded in the gel and each antibody marker was probed in duplicate lanes. GAPDH served as the loading control. (A) Representative Western blot. (B) Relative density of the bands normalized to GAPDH. Each data point represents the mean ± SE of three independent experiments.
The ErbB Signaling Pathway can be Activated in hiPSC-CMs by Neuregulin-1β (NRG)
We investigated whether NRG, a principal endogenous ligand for ErbB4 receptor, activates AKT and/or Erk1/2. Using antibodies specific for phosphorylated AKT(Ser473) and phosphorylated Erk1/2(Thr202/Tyr204), we demonstrated activation of both signaling proteins after treatment with NRG. Figure 6A shows increased expression of phosphorylated AKT after treatment with 20-ng/ml NRG for either 10 or 30 min that were statistically significant (p < 0.05) compared with their time-matched controls (Fig. 6C). Erk1/2 was activated transiently by media change as seen by increased expression of phosphorylated Erk1/2 10 min after treatment with or without NRG. After 30 min, phosphorylated Erk1/2 expression was back to untreated (i.e., no media change) control levels, whereas 20-ng/ml NRG clearly activated Erk1/2 to statistically significant levels (p < 0.05) compared with the 30-min control (Figs. 6B and D). The total AKT or Erk1/2 remained unchanged in all groups (Figs. 6C and D).
FIG. 6.

Activation of downstream ErbB signaling proteins in hiPSC-CMs. Cells treated with 20-ng/ml neuregulin-1β (NRG) for either 10 or 30 min; untreated controls did not receive fresh media, whereas the time-matched controls (at 10 or 30 min) as well as the neuregulin-treated groups did receive fresh media at the time of treatment. Representative Western blot for AKT (A) and Erk1/2 (B); 10 μg total protein was loaded into each individual well of a 10-well mini-gel (50 μl per well). Blots were first probed for phosphorylated AKT and Erk1/2, then stripped and re-probed for total AKT, total Erk1/2, and GAPDH. Relative density of the AKT bands normalized to GAPDH (C). Relative density of the Erk1/2 bands normalized to GAPDH (D). Each data point represents the mean ± SEM of three independent experiments. *#Statistically significant at p < 0.05: *pAKT 30-min control significantly less than untreated control; #pAKT 10-min and 30-min NRG treatment significantly greater than time-matched controls; *pErk1/2 10-min control significantly greater than untreated control; #pErk1/2 30-min NRG significantly greater than 30-min control.
AKT and Erk1/2 activation was confirmed using nanofluidic proteomic immunoassay (NIA) that separates proteins based on isoelectric point (Fan et al., 2009). Amino acid phosphorylation results in a shift in isoelectric point allowing for detection of all residues of phosphorylated protein of interest. NIA analysis of cell lysates from untreated hiPSC-CMs probed with anti-total AKT1/2/3, AKT1, or AKT2 antibodies revealed eleven isoelectric peaks at pI = 5.00, 5.05, 5.09, 5.15, 5.21, 5.27, 5.31, 5.38, 5.43, 5.47, and 5.63 (Supplementary fig. 2). We confirmed peaks between 5.00 and 5.38 represent AKT1, and peaks between 5.43 and 5.63 represent AKT2 using isoform-specific antibodies against AKT1 or AKT2. No AKT3 isoform peaks were detected with anti-total AKT1/2/3 antibody. Based on isoelectric point, only three peaks were evident using the AKT2 antibody; thus, AKT2 was used as a simplified readout of ErbB activation.
Phosphorylated proteins show a leftward shift in pI values compared with the non-phosphorylated form. Figure 7 shows the NIA analysis of lysates collected from cells treated with NRG (20 ng/ml) or fresh medium (control) for 30 min. Anti-AKT2 antibody detected three large peaks (pI = 5.43, 5.47, and 5.63) and three small peaks (pI = 5.21, 5.31, and 5.38) in lysates from cells receiving fresh medium alone. The signal intensity of all three large peaks with pI > 5.40 was reduced whereas all small peaks with pI < 5.40 were increased; an additional two peaks at pI 5.09 and 5.15 were also detected in NRG-treated cell lysates (Fig. 6A, upper row). NIA analysis of medium-treated cell lysates with anti-pAKT(Ser475) antibody detected no peaks at pI > 5.40, but five small peaks left to pI 5.40 (pI = 5.05, 5.09, 5.15, 5.21, and 5.38). All these small peaks increased in NRG-treated cell lysates, and additional peaks at pI (4.97 and 5.00) emerged (Fig. 7A, lower row). These results suggest that (1) probed with anti-AKT2 or anti-pAKT(Ser475) antibody, peaks with pI < 5.40 represent phosphorylated AKT, whereas those with pI > 5.40 constitute non-phosphorylated AKT; (2) there was a low level of basal AKT phosphorylation in cultured hiPSC-CMs. The AKT peaks identified using NIA were similar to previously published findings using NIA (Guo et al., 2013).
FIG. 7.

Activation of multiple phosphorylation isoforms of AKT and Erk1/2 by neuregulin-1β (NRG). HiPSC-CMs were treated (or untreated) with fresh medium (time-matched vehicle control) or NRG 20 ng/ml (diluted in the fresh medium) for 10 or 30 min before lysed as described in the Materials and Methods section. Lysates were analyzed by the nanofluidic proteomic immunoassay (NIA) using antibodies raised against either the total protein or specific phosphorylated-site of AKT and Erk1/2. (A) Representative traces of nanofluidic proteomic immunoassay (NIA) analysis of 30-min treatment samples using anti-AKT2 or anti-pAKT(Ser473) to detect the non-phosphorylated or phosphorylated AKT. The vertical dashed line separates peaks of phosphorylated (pI < 5.40) or non-phosphorylated (pI > 5.40) ATK. Note the leftward shift and dramatic increases in phosphorylated peaks after NRG treatment. (B) Representative traces of NIA analysis of 30-min treatment samples using anti-Erk1/2 or anti-pErk/12(Thr202/Tyr204) to detect the non-phosphorylated or phosphorylated Erk1/2. Isoelectric peaks corresponding to the non-phosphorylated Erk1/2 and their mono- or dual-phosphorylated isoforms (pErk1/2 or ppErk1/2) are marked with vertical dashed lines. NRG treatment reduces the non-phosphorylated peak intensity of Erk1 and Erk2 and increases the peak intensity of phosphorylated isoforms, especially ppErk1 and ppErk2. The level of phosphorylation for AKT or Erk1/2 is quantified by either the phospho-/non-phosphorylated peak intensity ratio (C), or by the peak intensity of all phosphorylated isoform peaks (D). Each data represents the mean ± SE of three independent experiments. *p < 0.05 versus the time-matched control group. Isoelectric point (pI) is shown on the x-axis and chemiluminescence on the y-axis in (A) and (B).
As shown in Figure 7B, NIA analysis of medium or NRG-treated (for 30 min) cell lysates with anti-total Erk1/2 and anti-pErk/12(Thr202/Tyr204) antibodies identified six isoelectric peaks that represent non-phosphorylated isoforms Erk1 and Erk2, mono-phosphorylated Erk1(pErk1) and Erk2 (pErk2), or dual-phosphorylated Erk1(ppErk1) and Erk2 (ppErk2), respectively. Activated phosphorylation of Erk1/2 was manifested by a remarkable reduction in non-phosphorylated peaks of Erk1and Erk2, and a significant increase in phosphorylated peaks of pErk1 and pErk2, particularly ppErk1 and ppErk2. The Erk1/2 peaks identified using NIA were consistent with previously published findings using NIA (O'Neill et al., 2006).
Quantification of AKT or Erk1/2 phosphorylation using anti-total antibody-detected peaks was made by calculating the ratio of all phosphorylated peaks over all non-phosphorylated peaks (Fig. 7C). AKT phosphorylation was increased by 7-fold (p < 0.05) with either 10- or 30-min NRG treatment, whereas Erk1/2 phosphorylation was increased by 6- or 59-fold (both p < 0.05) when cells were treated with NRG for 10 and 30 min, respectively. When anti-phosphorylation site-specific antibody-detected peaks were used to quantify AKT or Erk1/2 phosphorylation, the signal intensity of all phosphorylated peaks was calculated because non-phosphorylated peaks were not detected (Fig. 7D). This calculation revealed a 6- or 38-fold increase (both p < 0.05) of AKT phosphorylation by NRG treatment for 10 or 30 min, respectively. Erk1/2 phosphorylation was increased by 15-fold in 30-min NRG treatment (p < 0.05), but the increase in 10-min NRG treatment was not statistically significant as fresh medium itself caused a transient increase in Erk1/2 phosphorylation.
ErbB Signaling can be Modulated by ErbB Receptor Inhibitors
We investigated activation of AKT and Erk1/2 when cells were pretreated with ErbB2 inhibitors. As shown in Figure 8, pre-incubation for 30 min with lapatinib, a small molecule ErbB2/ErbB1 receptor kinase inhibitor, or by trastuzumab, a humanized monoclonal antibody against ErbB2 receptor reduced NRG-activated AKT phosphorylation (measured 30 min after NRG treatment) significantly (p < 0.05) by 92% and 81% (Fig. 8C) or 99% and 89% (Fig. 8D). Similarly, NRG-activated Erk1/2 phosphorylation was completely blocked by lapatinib or reduced significantly (p < 0.05) by 96% or 70% by trastuzumab (Figs. 8C and D).
FIG. 8.

Attenuation of neuregulin-1β (NRG)-activated phosphorylation of AKT and Erk1/2 by lapatinib (LPN) and trastuzumab (TZM). HiPSC-CMs were pretreated with lapatinib (1μM) or trastuzumab (1μM) for 30 min before changing to fresh media (vehicle control) or NRG 100 ng/ml (by adding 10X stock prepared in fresh media) for 30 min. Lysates were prepared and analyzed as described in the Materials and Methods section. (A) and (B) show representative traces of NIA analysis to illustrate the change of phosphorylated and non-phosphorylated peaks by NRG alone, or subsequently with LPN and TZM. (C) and (D) show quantification of AKT or Erk1/2 phosphorylation by the phospho-/non-phosphorylated peak intensity ratio, or by the peak intensity of all phosphorylated isoform peaks, respectively. Each bar represents the mean ± SE of three independent cell culture experiments. *p < 0.05 versus NRG treatment group. Isoelectric point (pI) is shown on the x-axis and chemiluminescence on the y-axis in (A) and (B).
Downregulation of ErbB2 Expression Attenuates ErbB Signaling Activation
We tested whether downregulation of ErbB2 expression could modulate activation of AKT and Erk1/2 phosphorylation by NRG. As shown in Figures 9A and C, Western blot analysis of hiPSC-CMs transfected with targeted ErbB2 siRNAs reduced ErbB2 expression effectively by 73% and 90% (both p < 0.05) after 72- or 144-h transfection, respectively. Partial reduction in NRG-activated AKT and Erk1/2 phosphorylation (Figs. 9B and D) was observed after 72-h transfection. Compared with the control siRNA group, NRG-induced AKT and Erk1/2 phosphorylation was reduced by 30% and 11%, respectively, in ErbB2-targeted siRNA group (both p < 0.05).
FIG. 9.

ErbB2 expression knockdown by targeted siRNAs attenuates neuregulin-1β (NRG)-activated AKT and Erk1/2 phosphorylation. HiPSC-CMs were incubated with Lipofectamine/Opti-MEM (transfection vehicle), 100-nM scrambled or targeted siRNAs [control (ctrl) or ErB2 siRNAs] for up to 144 h. To test the effect of ErbB2 siRNA on NRG-activated AKT or Erk1/2 phosphorylation, cells at 72-h transfection were exposed to 100-ng/ml NRG for 30 min prior to lysing in RIPA buffer. (A) and (B) Representative Western blots of three independent experiments show diminished ErB2 expression and reduced phosphorylation of AKT and Erk1/2 in response to 100-ng/ml NRG treatment. Thirty microgram total protein was loaded into each individual well of a 10-well mini-gel (30 μl/well) (A); 10 μg total protein was loaded into each individual well of a 10-well mini-gel (30 μl/well) (B). Blots were first probed for phosphorylated AKT(Ser473) and Erk1/2(Thr202/Tyr204), then stripped and re-probed for total AKT and Erk1/2, and GAPDH. (C) Quantification of ErbB2 expression after 72- or 144-h transfection. ErbB2 expression relative to the protein loading (GAPDH) was normalized to the transfection vehicle group. (D) and (E) Quantification of NRG-induced AKT and Erk1/2 phosphorylation at 72-h transfection. Proteins detected by anti-pAKT(Ser473) or anti-pErk/12(Thr202/Tyr204) were expressed as a fraction of that detected by anti-total AKT or Erk1/2 antibodies. Each data point represents the mean ± SE of three independent experiments. *p < 0.05 compared with control siRNAs, ‡p < 0.05 compared with 72-h ErbB2 siRNAs, #p < 0.05 compared with vehicle control exposed to NRG.
Regulation of ErbB2 Pathway Modulates Doxorubicin-Induced Effects on hiPSC-CMs in Culture
We measured the effect of ErbB2 pathway modulation on doxorubicin-induced cytotoxic effects. Up- or downregulation of ErbB2 signaling was achieved by pretreating cells with NRG (100 ng/ml) or trastuzumab (1μM) for 24 h prior to adding doxorubicin at multiple concentrations up to 1μM, respectively. Cardiomyocyte contraction and cellular impedance (measure of cell viability) were monitored in real time by cellular impedance (Xi et al., 2011), and intracellular ATP reserve measured upon completion of observation.
As shown in Figure 10A, doxorubicin caused a change in both beat rate and amplitude. These effects were modulated by NRG and trastuzumab. NRG pre-treatment significantly attenuated the loss of cellular impedance and ATP that was caused by doxorubicin at the higher concentration (1μM). In contrast, trastuzumab pre-treatment caused a significant potentiating effect of doxorubicin on cellular impedance and ATP loss (Figs. 10B–D).
FIG. 10.

Neuregulin-1β (NRG) attenuates and trastuzumab (TZM) potentiates doxorubicin (Dox)-induced cardiomyocyte injury. (A) Representative screenshots of spontaneous beating cells taken from wells before or after exposure to Dox (1μM) or vehicle (0.1% DMSO) following pretreatment with NRG (100 ng/ml) or TZM (1μM) for 24 h. Horizontal scale bar: 3 s; vertical scale bar: 0.05 arbitrary units. (B) Real-time monitoring of cellular impedance for cells exposed to 0.3 or 1-μM Dox after pre-treatment with NRG (100 ng/ml) or TZM (1μM) for 24 h. Readings for each well were normalized to the baseline level prior to Dox application (marked by the arrow). For clarity, not all treatment groups are shown. Cellular impedance and intracellular ATP measured after 40-h exposure to Dox are plotted in (C) and (D). Data point for each concentration is the average of 9–12 wells from four to five separate experiments. RLU: relative light units; *p < 0.05 compared with Dox; #p < 0.05 compared with NRG 1μM + Dox.
DISCUSSION
Human cardiomyocytes (derived from either embryonic stem cells or induced pluripotent stem cells) are increasingly being used to replace primary cardiomyocytes for basic cardiac biology research and in drug discovery or toxicology testing (Force and Kolaja, 2011; Ivashchenko et al., 2013; Pointon et al., 2013; Scott et al., 2013). These cells have many advantages when compared with cardiomyocytes derived from postnatal mammalian hearts. For example, primary cardiomyocytes derived from postnatal mammalian hearts have been shown to undergo a rapid dedifferentiation and may regain proliferating capacity in culture (Qian and Guo, 2010; Zhang et al., 2010). In contrast, stem cell-derived adult human cardiomyocytes, induced to differentiate in culture and frozen at Day 30, retain a post-differentiated myocardial phenotype and continue on a slow but progressive maturation process in culture (Babiarz et al., 2012; Ivashchenko et al., 2013; Lundy et al., 2013; Shinozawa et al., 2012). We compared the contractile function and cell morphology between Day 2 and Day 14 cell cultures (equivalent to Day 32 and Day 44 post-differentiation). We found that at Day 14 hiPSC-CMs show contractile properties, maintain a post-differentiated phenotype, and exhibit hypertrophic growth in culture. These results are generally in agreement with previous reports (Babiarz et al., 2012; Ivashchenko et al., 2013; Lundy et al., 2013; Shinozawa et al., 2012) and provide an additional line of evidence to demonstrate that hiPSC-CMs structurally and functionally exhibit a more adult-like cardiac phenotype, rather than rapidly dedifferentiating like isolated primary cardiomyocytes in culture.
We report, for the first time, a protein expression profile of hiPSC-CM lysates obtained via high-content antibody microarray employing 854 antibodies that target mainly intracellular signaling proteins. Babiarz et al. (2012) examined mRNA and miRNA expression in hiPSC-CMs at various times after initiation of differentiation and found that the transcriptome largely stabilizes to an adult-like phenotype following 28 days of differentiation and continues to mature in culture. The level of expression of mRNAs for several cell signaling proteins in human embryonic stem cell-derived cardiomyocytes, closely related to hiPSC-CMs, was reported by Földes et al. (2011). Moreover, signaling proteins in the left ventricle obtained from a healthy adult male were profiled with LC-MS/MS spectrometer (Aye, et al., 2010). Protein phosphatases, small GTPase signaling proteins and phosphorylated proteins that were detected in the adult human left vehicle were abundant in our hiPSC-CMs lysate. These comparative results imply that protein expression in hiPSC-CMs after 14 days in culture is similar to the mature state of the left ventricular phenotype.
There are few reports of specific characterizations of cell signaling pathways in hiPSC-CMs. Ivashchenko et al. (2013) characterized the functional response of hiPSC-CMs to endothelin-1 (ET-1) and reported effects on gene expression and activation of AKT and Erk signaling. Stimulation of hiPSC-CMs with ET-1 resulted in decreased activation of AKT, but increased activation of Erk as determined by measuring the ratio of phosphorylated to total gene expression. In adult rat cardiac myocytes, ET-1 similarly activated Erk1/2, but not AKT, whereas neuregulin-1β (NRG) activated both AKT and Erk1/2 (Chung and Walker, 2007). ET-1 has been reported to regulate contractility and growth of the mammalian heart and is being explored for use as a cardio-protective agent through activation of various cell signaling pathways, including AKT, Erk, JNK, and p38-MAPK (Schorlemmer et al., 2008).
Here, we show activation of AKT and Erk1/2 cell signaling proteins in response to NRG and, importantly, the potential to test the ability of NRG to protect hiPSC-CMs from cardiotoxicity. The role of NRG/ErbB signaling in cardiovascular physiology and disease, cardiac toxicity, and protection against cardiac insults has been reviewed extensively (De Keulenaer et al., 2010; Fuller et al., 2008; Hedhli and Russell, 2010; Lemmens et al., 2007). NRG is synthesized in endothelial cells near cardiomyocytes (in the endocardium and myocardial microvasculature). On release, NRG binds the ErbB4 receptor on cardiomyocytes that, after homodimerization with ErbB4 or heterodimerization with ErbB2, leads to activation of AKT and Erk, with subsequent growth-promoting and cell-protective actions (Lemmens et al., 2007). The ErbB2/ErbB4 heterodimer has been reported to protect cardiomyocytes from insult via activation of AKT and Erk1/2 (Albini et al., 2011). Along these lines, unexpected cardiotoxicity was reported with the inhibitory, humanized anti-ErbB2 monoclonal antibody trastuzumab, particularly when administered in combination with anthracyclines (Baselga, 2001; Keefe, 2002). It is hypothesized that inhibition of ErbB2 signaling by trastuzumab causes blockage of critical downstream protective (AKT and Erk) responses in the heart (Azim et al., 2009).
NRG has been proposed for treatment of heart failure based on ErbB signaling, notably AKT and Erk1/2 downstream signaling proteins (Wadugu and Kuhn, 2012). In our study, treatment with NRG activated both AKT and Erk1/2 downstream signaling proteins. Furthermore, activation of ErbB signaling by NRG significantly attenuated doxorubicin-induced loss of cellular impedance and ATP. As hypothesized, inhibition of ErbB signaling by trastuzumab clearly potentiated cardiotoxic effects of doxorubicin. Furthermore, NRG attenuated doxorubicin-induced myofibrillar damage as assessed by immunofluorescence microscopy of cell cultures stained for myomesin and actin. Our results are in agreement with the results obtained in previous in vivo and in vitro studies. NRG improved survival of doxorubicin-treated mice in vivo (Bian et al., 2009). In vitro studies conducted with neonatal rat cardiomyocytes that showed NRG activated AKT and Erk1/2 (as determined by increased protein expression of phosphorylated AKT(Ser473) and Erk1/2(Thr202/Tyr204) (Chung and Walker, 2007) and NRG attenuation of doxorubicin-induced cardiotoxicity (Bian et al., 2009; Sawyer et al., 2002).
The consistency and robustness of the data obtained from the hiPSC-CM cultures presented here support the use of this in vitro model in both early viability screening and detailed mechanistic investigations of cardiac myocyte toxicity. An in vitro model system with fully functional and well-defined signaling pathways will enable early assessment of potential cardiotoxicity risk. Measurement of ErbB signaling and downstream modulation events on AKT and Erk1/2 are robust and reproducible enough to be employed for advanced screening applications. The functionality of NRG/ErbB signaling is also consistent with the current mechanistic understanding of this pathway; thus, fulfilling a need for early stage, functional in vitro models with defined clinical and mechanistic relevance (Anson et al., 2011 ; Kattman et al., 2011; Laverty et al., 2011; Ma et al., 2011; Mummery et al., 2012; Puppala et al., 2012; Rana et al., 2012; Sirenko et al., 2012).
SUPPLEMENTARY DATA
Supplementary data are available online at http://toxsci.oxfordjournals.org/.
FUNDING
Developmental Therapeutics Program, Division of Cancer Treatment and Diagnosis of the National Cancer Institute, National Cancer Institute, National Institutes of Health (HHSN261200800001E).
Supplementary Material
Acknowledgments
The authors thank Dr. Ralph Parchment (Leidos) for scientific input in experimental design, Dr. Deborah Pritchett (ProteinSimple) for scientific support of the NanoPro 1000 platform, and Dr. Ulrich Baxa (Leidos) from the Frederick National Laboratory for Cancer Research for electron microscopy services.
Disclaimer: The content of this publication does not necessarily reflect the views or policies of the Department of Health and Human Services, nor does mention of trade names, commercial products, or organizations imply endorsement by the U.S. Government.
Footnotes
These authors contributed equally to this study.
REFERENCES
- Agarkova I., Perriard J.-C. The M-band: An elastic web that crosslinks thick filaments in the center of the sarcomere. Trends Cell Biol. 2005;15:477–485. doi: 10.1016/j.tcb.2005.07.001. [DOI] [PubMed] [Google Scholar]
- Albini A., Cesana E., Donatelli F., Cammarota R., Bucci E. O., Baravelli M., Anzà C., Noonan D. M. Cardio-oncology in targeting the HER receptor family: The puzzle of different cardiotoxicities of HER2 inhibitors. Future Cardiol. 2011;7:693–704. doi: 10.2217/fca.11.54. [DOI] [PubMed] [Google Scholar]
- Anson B. D., Kolaja K. L., Kamp T. J. Opportunities for use of human iPS cells in predictive toxicology. Clin. Pharmacol. Ther. (2011;89:754–758. doi: 10.1038/clpt.2011.9. [DOI] [PMC free article] [PubMed] [Google Scholar]
- Aye T. T., Cesana E., Donatelli F., Cammarota R., Bucci E. O., Baravelli M., Anza C., Noonan D. M. Cardio-oncology in targeting the HER receptor family: the puzzle of different cardiotoxicities of HER2 inhibitors. Future Cardiology. 2011;7:693–704. doi: 10.2217/fca.11.54. [DOI] [PubMed] [Google Scholar]
- Azim H., Azim H. A., Jr, Escudier B. Trastuzumab versus lapatinib: The cardiac side of the story. Cancer Treat. Rev. 2009;35:633–638. doi: 10.1016/j.ctrv.2009.06.007. [DOI] [PubMed] [Google Scholar]
- Babiarz J. E., Ravon M., Sridhar S., Ravindran P., Swanson B., Bitter H., Weiser T., Chiao E., Certa U., Kolaja K. L. Determination of the human cardiomyocyte mRNA and miRNA differentiation network by fine-scale profiling. Stem Cells Dev. 2012;21:1956–1965. doi: 10.1089/scd.2011.0357. [DOI] [PMC free article] [PubMed] [Google Scholar]
- Baselga J. Clinical trials of Herceptin® (trastuzumab) Eur. J. Cancer. 2001;37:18–24. [PubMed] [Google Scholar]
- Bian Y., Sun M., Silver M., Ho K. K., Marchionni M. A., Caggiano A. O., Stone J. R., Amende I., Hampton T. G., Morgan J. P., et al. Neuregulin-1 attenuated doxorubicin-induced decrease in cardiac troponins. Am. J. Physiol. Heart Circ. Physiol. 2009;297:H1974–H1983. doi: 10.1152/ajpheart.01010.2008. [DOI] [PMC free article] [PubMed] [Google Scholar]
- Chung K. Y., Walker J. W. Interaction and inhibitory cross-talk between endothelin and ErbB receptors in the adult heart. Mol. Pharmacol. 2007;71:1494–1502. doi: 10.1124/mol.106.027599. [DOI] [PubMed] [Google Scholar]
- Fan A. C., Deb-Basu D., Orban M. W., Gotlib J. R., Natkunam Y., O'Neill R., Padua R. A., Xu L., Taketa D., Shirer A. E., et al. Nanofluidic proteomic assay for serial analysis of oncoprotein activation in clinical specimens. Nat. Med. 2009;15:566–571. doi: 10.1038/nm.1903. [DOI] [PMC free article] [PubMed] [Google Scholar]
- Force T., Kolaja K. L. Cardiotoxicity of kinase inhibitors: The prediction and translation of preclinical models to clinical outcomes. Nat. Rev. Drug Discov. 2011;10:111–126. doi: 10.1038/nrd3252. [DOI] [PubMed] [Google Scholar]
- Fuller S. J., Sivarajah K., Sugden P. H. ErbB receptors, their ligands, and the consequences of their activation and inhibition in the myocardium. J. Mol. Cell. Cardiol. 2008;44:831–854. doi: 10.1016/j.yjmcc.2008.02.278. [DOI] [PubMed] [Google Scholar]
- Földes G., Mioulane M., Wright J. S., Liu A. Q., Novak P., Merkely B., Gorelik J., Schneider M. D., Ali N. N., Harding S. E. Modulation of human embryonic stem cell-derived cardiomyocyte growth: A testbed for studying human cardiac hypertrophy. J. Mol. Cell. Cardiol. 2011;50:367–376. doi: 10.1016/j.yjmcc.2010.10.029. [DOI] [PMC free article] [PubMed] [Google Scholar]
- Guo L., Abrams R. M. C., Babiarz J. E., Cohen J. D., Kameoka S., Sanders M. J., Chiao E., Kolaja K. L. Estimating the risk of drug-induced proarrhythmia using human induced pluripotent stem cell-derived cardiomyocytes. Toxicol. Sci. 2011;123:281–289. doi: 10.1093/toxsci/kfr158. [DOI] [PubMed] [Google Scholar]
- Guo H., Gao M., Lu Y., Liang J., Lorenzi P. L., Bai S., Hawke D. H., Li J., Dogruluk T., Scott K. L. Coordinate phosphorylation of multiple residues on single AKT1 and AKT2 molecules. Oncogene. 2014;33:3465–3472. doi: 10.1038/onc.2013.301. [DOI] [PMC free article] [PubMed] [Google Scholar]
- Hedhli N., Russell K. S. Cytostatic drugs, neuregulin activation of erbB receptors, and angiogenesis. Curr. Hypertens. Rep. 2010;12:411–417. doi: 10.1007/s11906-010-0148-9. [DOI] [PubMed] [Google Scholar]
- Ivashchenko C. Y., Pipes G. C., Lozinskaya I. M., Lin Z., Xiaoping X., Needle S., Grygielko E. T., Hu E., Toomey J. R., Lepore J. J., et al. Human-induced pluripotent stem cell-derived cardiomyocytes exhibit temporal changes in phenotype. Am. J. Physiol. Heart Circ. Physiol. 2013;305:H913–H922. doi: 10.1152/ajpheart.00819.2012. [DOI] [PubMed] [Google Scholar]
- Kattman S. J., Koonce C. H., Swanson B. J., Anson B. D. Stem cells and their derivatives: A renaissance in cardiovascular translational research. J. Cardiovasc. Transl. Res. 2011;4:66–72. doi: 10.1007/s12265-010-9235-1. [DOI] [PubMed] [Google Scholar]
- Keefe D. L. Trastuzumab-associated cardiotoxicity. Cancer. 2002;95:1592–1600. doi: 10.1002/cncr.10854. [DOI] [PubMed] [Google Scholar]
- De Keulenaer G. W., Doggen K., Lemmens K. The vulnerability of the heart as a pluricellular paracrine organ: Lessons from unexpected triggers of heart failure in targeted ErbB2 anticancer therapy. Circ. Res. 2010;106:35–46. doi: 10.1161/CIRCRESAHA.109.205906. [DOI] [PubMed] [Google Scholar]
- Laverty H., Benson C., Cartwright E., Cross M., Garland C., Hammond T., Holloway C., McMahon N., Milligan J., Park B., et al. How can we improve our understanding of cardiovascular safety liabilities to develop safer medicines. Br. J. Pharmacol. 2011;163:675–693. doi: 10.1111/j.1476-5381.2011.01255.x. [DOI] [PMC free article] [PubMed] [Google Scholar]
- Lemmens K., Doggen K., De Keulenaer G. W. Role of neuregulin-1/ErbB signaling in cardiovascular physiology and disease. Circulation. 2007;116:954–960. doi: 10.1161/CIRCULATIONAHA.107.690487. [DOI] [PubMed] [Google Scholar]
- Lundy S. D., Zhu W. Z., Regnier M., Laflamme M. A. Structural and functional maturation of cardiomyocytes derived from human pluripotent stem cells. Stem Cells Dev. 2013;22:1991–2002. doi: 10.1089/scd.2012.0490. [DOI] [PMC free article] [PubMed] [Google Scholar]
- Ma J., Guo L., Fiene S. J., Anson B. D., Thomson J. A., Kamp T. J., Kolaja K. L., Swanson B. J., January C. T. High purity human-induced pluripotent stem cell-derived cardiomyocytes: Electrophysiological properties of action potentials and ionic currents. Am. J. Physiol. Heart Circ. Physiol. 2011;301:H2006–H2017. doi: 10.1152/ajpheart.00694.2011. [DOI] [PMC free article] [PubMed] [Google Scholar]
- Mummery C. L., Zhang J., Ng E. S., Elliott D. A., Elefanty A. G., Kamp T. J. Differentiation of human embryonic stem cells and induced pluripotent stem cells to cardiomyocytes. Circ. Res. 2012;111:344–358. doi: 10.1161/CIRCRESAHA.110.227512. [DOI] [PMC free article] [PubMed] [Google Scholar]
- O'Neill R. A., Bhamidipati A., Bi X., Deb-Basu D., Cahill L., Ferrante J., Gentalen E., Glazer M., Gossett J., Hacker K., et al. Isoelectric focusing technology quantifies protein signaling in 25 cells. Proc. Natl Acad. Sci. U.S.A. 2006;103:16153–16158. doi: 10.1073/pnas.0607973103. [DOI] [PMC free article] [PubMed] [Google Scholar]
- Pointon A., Abi-Gerges N., Cross M. J., Sidaway J. E. Phenotypic profiling of structural cardiotoxins in vitro reveals dependency on multiple mechanisms of toxicity. Toxicol. Sci. 2013;132:317–326. doi: 10.1093/toxsci/kft005. [DOI] [PubMed] [Google Scholar]
- Puppala D., Collis L. P., Sun S. Z., Bonato V., Chen X., Anson B., Pletcher M., Fermini B., Engle S. J. Comparative gene expression profiling in human induced pluripotent stem cell derived cardiocytes and human and cynomolgus heart tissue. Toxicol. Sci. 2012;131:117–131. doi: 10.1093/toxsci/kfs282. [DOI] [PubMed] [Google Scholar]
- Qian J. Y., Guo L. Altered cytosolic Ca2+ dynamics in cultured Guinea pig cardiomyocytes as an in vitro model to identify potential cardiotoxicants. Toxicol. In Vitro. 2010;24:960–972. doi: 10.1016/j.tiv.2009.12.027. [DOI] [PubMed] [Google Scholar]
- Rana P., Anson B., Engle S., Will Y. Characterization of human induced pluripotent stem cell derived cardiomyocytes: Bioenergetics and utilization in safety screening. Toxicol. Sci. 2012;130:117–131. doi: 10.1093/toxsci/kfs233. [DOI] [PubMed] [Google Scholar]
- Sawyer D. B., Zuppinger C., Miller T. A., Eppenberger H. M., Suter T. M. Modulation of anthracycline-induced myofibrillar disarray in rat ventricular myocytes by neuregulin-1beta and anti-erbB2: Potential mechanism for trastuzumab-induced cardiotoxicity. Circulation. 2002;105:1551–1554. doi: 10.1161/01.cir.0000013839.41224.1c. [DOI] [PubMed] [Google Scholar]
- Schorlemmer A., Matter M. L., Shohet R. V. Cardioprotective signaling by endothelin. Trends Cardiovasc. Med. 2008;18:233–239. doi: 10.1016/j.tcm.2008.11.005. [DOI] [PMC free article] [PubMed] [Google Scholar]
- Scott C. W., Peters M. F., Dragan Y. P. Human induced pluripotent stem cells and their use in drug discovery for toxicity testing. Toxicol. Lett. 2013;219:49–58. doi: 10.1016/j.toxlet.2013.02.020. [DOI] [PubMed] [Google Scholar]
- Shinozawa T., Imahashi K., Sawada H., Furukawa H., Takami K. Determination of appropriate stage of human-induced pluripotent stem cell-derived cardiomyocytes for drug screening and pharmacological evaluation in vitro. J. Biomol. Screen. 2012;17:1192–1203. doi: 10.1177/1087057112449864. [DOI] [PubMed] [Google Scholar]
- Sirenko O., Crittenden C., Callamaras N., Hesley J., Chen Y.-W., Funes C., Rusyn I., Anson B., Cromwell E. F. Multiparameter in vitro assessment of compound effects on cardiomyocyte physiology using iPSC cells. J. Biomol. Screen. 2012;18:39–53. doi: 10.1177/1087057112457590. [DOI] [PubMed] [Google Scholar]
- Takahashi K., Yamanaka S. Induction of pluripotent stem cells from mouse embryonic and adult fibroblast cultures by defined factors. Cell. 2006;126:663–676. doi: 10.1016/j.cell.2006.07.024. [DOI] [PubMed] [Google Scholar]
- Wadugu B., Kuhn B. The role of neuregulin/ErbB2/ErbB4 signaling in the heart with special focus on effects on cardiomyocyte proliferation. Am. J. Physiol. Heart Circ. Physiol. 2012;302:H2139–H2147. doi: 10.1152/ajpheart.00063.2012. [DOI] [PMC free article] [PubMed] [Google Scholar]
- Xi B., Wang T., Li N., Ouyang W., Zhang W., Wu J., Xu X., Wang X., Abassi Y. A. Functional cardiotoxicity profiling and screening using the xCELLigence RTCA Cardio System. J. Lab. Autom. 2011;16:415–421. doi: 10.1016/j.jala.2011.09.002. [DOI] [PubMed] [Google Scholar]
- Yu J., Vodyanik M. A., Smuga-Otto K., Antosiewicz-Bourget J., Frane J. L., Tian S., Nie J., Jonsdottir G. A., Ruotti V., Stewart R., et al. Induced pluripotent stem cell lines derived from human somatic cells. Science. 2007;318:1917–1920. doi: 10.1126/science.1151526. [DOI] [PubMed] [Google Scholar]
- Zhang Y., Li T. S., Lee S. T., Wawrowsky K. A., Cheng K., Galang G., Malliaras K., Abraham M. R., Wang C., Marban E. Dedifferentiation and proliferation of mammalian cardiomyocytes. PLoS ONE. 2010;5:e12559. doi: 10.1371/journal.pone.0012559. [DOI] [PMC free article] [PubMed] [Google Scholar]
- Zhao Y.-Y., Sawyer D. R., Baliga R. R., Opel D. J., Han X., Marchionni M. A., Kelly R. A. Neuregulins promote survival and growth of cardiac myocytes: Persistence of ErbB2 and ErbB4 expression in neonatal and adult ventricular myocytes. J. Biol. Chem. 1998;273:10261–10269. doi: 10.1074/jbc.273.17.10261. [DOI] [PubMed] [Google Scholar]
Associated Data
This section collects any data citations, data availability statements, or supplementary materials included in this article.